 Open Access Article
Electrochemical corrosion behaviour of four low-carbon steels in saline soil
Gang Qi ,
Xinhao Qin,
Jun Xie,
Pengju Han
 and
Bin He
 *
*
College of Civil Engineering, Taiyuan University of Technology, Taiyuan 030024, P. R. China. E-mail: hebin@tyut.edu.cn
First published on 21st July 2022
Abstract
In this paper, the electrochemical corrosion behaviour of Q235, X65, X70, and X80 low-carbon steel was systematically studied by a variety of test techniques using natural saline soil containing 1.1% salt under laboratory conditions. The electrochemical corrosion behaviour, macro-micro corrosion morphology, and corrosion product composition of these four low-carbon steels in saline soil were studied to explore their salt corrosion resistance and reveal their corrosion mechanisms. The research results showed that oxygen absorption corrosion occurred in all four low-carbon steels in the saline soil, and the corrosion types were all localised corrosion. The corrosion process of Q235 steel was controlled by mass transfer, while the corrosion processes of X65, X70, and X80 steel were controlled by charge transfer. The corrosion rates of these four low-carbon steels in saline soil followed the order Q235 > X65 ≈ X70 > X80. Variation in elemental composition was the main reason for this difference in corrosion behaviour. Finally, microscopic test results showed that local corrosion pits were present on the surface of the steel sheet specimens, and the uniformity and compactness of the corrosion product accumulation were poor.
1. Introduction
At present, there is a shortage of energy around the world, the novel coronavirus epidemic is raging, and international relations are increasingly tense. The distribution of energy resources in various countries around the world is extremely uneven, and many countries face the risk of energy supply cuts. China, which has long been short of energy resources, is actively seeking a breakthrough in clean energy generation. At present, China's photovoltaic power generation industry is the global leader. By 2021, China's cumulative photovoltaic installed capacity accounted for one-third of the total world capacity. To avoid affecting limited arable land, more than 55% of photovoltaic power stations in China are located in northwest China. At the same time, China purchases large quantities of oil and natural gas from Kazakhstan, Russia, and other countries. This oil and natural gas are transported through pipelines. The Sino-Russian western pipeline project, which has not yet started construction, is expected to have a total length of more than 10![[thin space (1/6-em)]](https://www.rsc.org/images/entities/char_2009.gif) 000 kilometres. Moreover, the total pipeline length of China's domestic west-east gas pipeline projects has exceeded 15
000 kilometres. Moreover, the total pipeline length of China's domestic west-east gas pipeline projects has exceeded 15![[thin space (1/6-em)]](https://www.rsc.org/images/entities/char_2009.gif) 000 kilometres, and more pipeline is still being constructed. At present, the west and north of China have become the key areas for the development of China's new energy and traditional energy layout. However, these western and northern regions contain high concentrations of saline soil. Six western provinces (Shaanxi, Gansu, Ningxia, Qinghai, Mongolia, and Xinjiang) account for 69.03% of the total saline soil area in China.1 Many photovoltaic projects and oil and gas pipelines are located in this region. Therefore, the corrosion protection of underground steel structures and pipelines in these areas is a significant challenge.2–5
000 kilometres, and more pipeline is still being constructed. At present, the west and north of China have become the key areas for the development of China's new energy and traditional energy layout. However, these western and northern regions contain high concentrations of saline soil. Six western provinces (Shaanxi, Gansu, Ningxia, Qinghai, Mongolia, and Xinjiang) account for 69.03% of the total saline soil area in China.1 Many photovoltaic projects and oil and gas pipelines are located in this region. Therefore, the corrosion protection of underground steel structures and pipelines in these areas is a significant challenge.2–5
Many scholars have investigated the different influencing factors that affect steel corrosion, including moisture content,6 pH,7 temperature,8,9 dissolved oxygen concentration,10 soil particle size,11 and microorganisms.12 Suganya et al.13 found that moisture content and soil texture had significant indigenous effects on the corrosion behaviour of low-carbon steel and that the corrosion that occurred in clay was more serious than that in mixed soil and sand. The corrosion products they detected included amorphous oxides, goethite, and low-strength hematite crystalline phases. E. A. Noor et al.14 studied the effect of soil moisture content on the corrosion behaviour of X60 steel in the soil of three cities in Saudi Arabia. They found that 10% moisture content enabled the X60 steel to reach a critical corrosion rate, and the corrosion caused by the soil in these three cities was evaluated under the condition of critical moisture content. X. Bai et al.15 studied the corrosion behaviour of X80 pipeline steel in silty saline soil containing chloride ions at different temperatures. They found that the corrosion kinetics of the steel at negative temperatures decreased with decreasing unfrozen moisture content in the soil, and the corrosion products were mainly iron oxide. C. Du et al.16 studied the corrosion behaviour of X70 steel in alkaline soil. They found that the oxide film on the surface of the steel was a protective physical barrier. The structure of the corrosion products on the steel surface after heat treatment was defective, and the protective effect of this oxide film was general. The presence of pearlite, bainite, and martensite enhanced the corrosion activity of the steel. B. He et al.17 studied the short-term electrochemical corrosion behaviour of X70 pipeline steel in Cl−-containing sand and found that pitting corrosion and localised corrosion mainly occurred when the moisture content was high (18%). Q. Qin et al.18 studied the effect of alternating current frequency on the corrosion behaviour of X80 steel in a saline soil environment and found that the steel corrosion rate decreased with increasing alternating current frequency. At low alternating current frequencies, the corrosion products were more likely to be broken down and corrosion was more severe. The main corrosion products identified in this work were FeOOH, Fe2O3, and Fe3O4. M. Yan et al.19 studied the corrosion behaviour of X80 pipeline steel in acidic red soil, reporting that corrosion significantly depended on the moisture content of the soil. The critical moisture content of the acidic red soil was about 30%, and the corrosion-promoting effect of iron oxides was beneficial for oxygen-deficient corrosion. In the long term, corrosion was also limited by the accumulation of corrosion products. L. Quej-Ake et al.20 studied the corrosion rate of X60, X65, and X70 steels in acid sand with a pH value of 3.0, finding that X65 steel was more susceptible to corrosion with a short exposure time. However, X60 steel had a higher corrosion rate after 5 h. The difference in corrosion rates of these three steels was due to the difference in their microstructures (the pearlite phase and ferrite phase content). M. Sancy et al.21 studied the corrosion of cast iron in a drinking water pipe network in saturated sandy soil and distinguished the corrosion control mechanism of the inner and outer layers of corrosion products. They found that the inner layer of corrosion products affected the charge transfer process, while the outer corrosion products affected the diffusion process.
When steel is exposed to saline soil, the factors that affect steel corrosion are the salt ion type,22,23 the salt ion concentration,24 and the influence of corrosion products. Common salt ions in saline soil include Cl−, SO42−, CO32−, and HCO3−. Cl− is a very small ion that can easily penetrate the protective film adsorbed on metal surfaces and metal defects. This leads to erosion of the metal matrix and corrosion product film. Thus, Cl− is very destructive. Moreover, salt ions in saline soil can reduce soil resistivity, which also promotes metal corrosion. Many scholars have reported in-depth research on the corrosion of ferrous metals in soils containing chloride ions. S. Réguer et al.25 studied the influence of chloride on the formation and evolution of the corrosion products of iron artefacts in soil. They identified the Cl−-containing corrosion products at the micron scale and determined the morphology, elemental composition, and crystal structure of these corrosion products. Y. Song et al.26 studied the corrosion effect of different concentrations of chloride saline soil on ductile iron and low-carbon steel, finding that a low concentration of chloride easily caused uniform corrosion, while a high concentration of chloride potentially led to local corrosion. Moreover, there was no obvious boundary between high and low concentrations. α-FeOOH and iron oxide were the main corrosion products at low concentrations, while γ-FeOOH and β-Fe8O8(OH)8Cl1.35 increasingly appeared at high concentrations. β-Fe8O8(OH)8Cl1.35 was initially observed when the chloride concentration was increased, and Fe3O4 existed in most of the corrosion products. Y. Ma et al.27 studied the effect of chloride ions on the properties of steel corrosion products. They found that β-FeOOH was produced under high chloride ion concentrations, while in low-chlorine or no-chlorine environments, the corrosion products were mainly γ-FeOOH and α-FeOOH. The mechanism of the chloride ion acceleration effect was different at different concentrations: a high concentration of chloride ions was conducive to the formation of β-FeOOH, while a low concentration of chloride ions promoted the conversion of γ-FeOOH to α-FeOOH.
The corrosion of steel is a major problem because it can lead to changes in the metal structure, reduce the stress area, weaken the strength of steel, and cause defects or cracks. The existence of these defects and cracks leads to the concentration of stress in the steel, reduces the strength of the overall structure, and threatens the safety of buildings and structures. Askey et al.28 developed a chlorine corrosion cycle model in which chloride ions were directly involved in the corrosion process. The hematite formed during this model's corrosion process physically damaged the shape of iron objects by generating stress and cracks. This was because the volume of this compound was much higher than that of the previous corrosion products. T. Chen et al.29 summarised the reasons for the decline in the drawing force of Q235 steel, which included the combined effect of current, electrochemical corrosion, and stress. Furthermore, the softening of the steel surface caused by corrosion also affected the strength of steel.
Using natural saline soil, the corrosion behaviour of four low-carbon steels (Q235, X65, X70, and X80) was systematically studied in a saline soil environment. Electrochemical impedance spectroscopy (EIS) and polarisation curves (PC) were used to measure and analyse the corrosion rates and corrosion processes of these steel specimens. Scanning electron microscopy (SEM) and energy-dispersive X-ray spectrometry (EDS) were used to study the macro- and micro-corrosion morphology and corrosion product types as well as the differences in corrosion behaviour of these four steels.
2. Test materials and experimental procedure
2.1 Low-carbon steel samples
The four low-carbon steel samples used in this experiment were national standard corrosion test pieces (produced by Rizhao Steel Co., Ltd.). Q235, X65, X70, and X80 steel samples were tested. Table 1 lists the main chemical compositions of these four steels. The difference in elemental composition is the main factor affecting the corrosion resistance of different steels in the same soil environment. The mechanical properties of these four steels are shown in Table 2. The dimensions of all steel samples were 15 mm × 15 mm × 2 mm.| C | Si | Mn | P | S | V | Nb | Ti | Cr | Mo | Al | Cu | |
|---|---|---|---|---|---|---|---|---|---|---|---|---|
| Q235 | 0.19 | 0.105 | 0.145 | 0.02 | 0.02 | — | — | — | — | — | 0.008 | — |
| X65 | 0.16 | 0.45 | 1.6 | 0.02 | 0.01 | 0.06 | 0.05 | 0.06 | — | — | — | 0.2 |
| X70 | 0.136 | 0.4 | 1.52 | ≤0.02 | ≤0.01 | 0.06 | 0.05 | 0.06 | — | — | — | — |
| X80 | 0.09 | 0.35 | 1.9 | 0.03 | ≤0.01 | 0.06 | 0.065 | 0.016 | 0.03 | 0.21 | 0.05 | — |
| Steel | Tensile strength (MPa) | Yield strength (MPa) | Elongation (%) |
|---|---|---|---|
| Q235 | 488 | 356 | 36.5 |
| X65 | 570 | 485 | 18 |
| X70 | 573 | 485 | 18 |
| X80 | 551 | 625 | 40 |
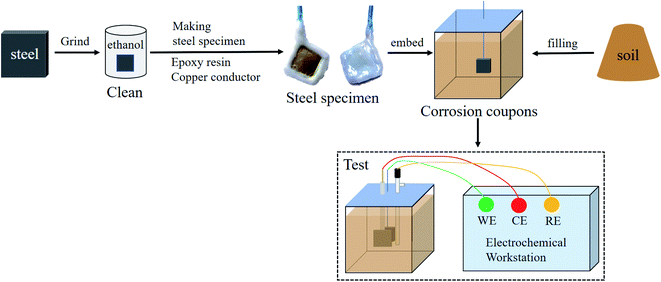
A metallographic sample grinding and polishing machine was used with water-resistant sandpaper to grind the working surface of each steel sample step by step from 2000 mesh to 5000 mesh. Each sample surface was polished to a near-mirror state, then immersed in alcohol to remove adhered impurities. The samples were naturally air-dried to obtain bright surface samples. After this surface treatment, a 20 cm length of copper wire was cut. The insulating layer of the wire was removed from some of this length, and the bare copper wire was wound along the thickness direction of the steel sheets to ensure full contact between the copper and steel. A 10 mm × 10 mm working surface was left on the polished area for exposure to the saline soil, and the remaining exposed surface and the exposed copper wire were tightly sealed with epoxy resin. The prepared samples were naturally air-dried before further use.
2.2 Salinized soil samples
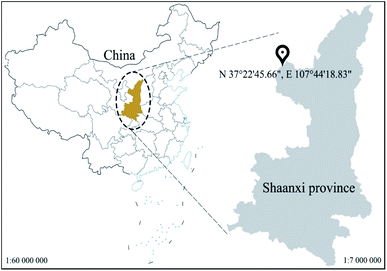
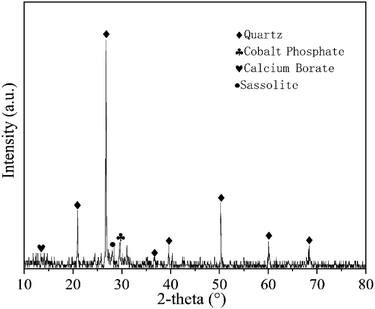
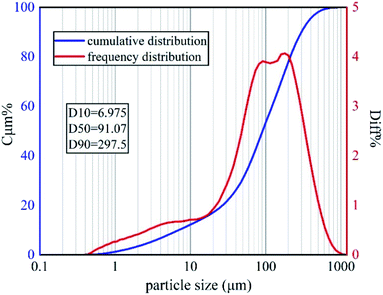
The soil samples used in this experiment were taken from Yanchangbao Town, Dingbian County, Yulin City, Shaanxi Province, China from a saline soil area. The precise location of the sampling site was N 37°22′45.66′′, E 107°44′18.83′′ (Fig. 1). The liquid-plastic limit, water content, salt content, and pH value of the soil samples were measured, and the results are listed in Table 3. According to the test results, the soil used in this work was sandy silt and alkaline saline soil. XRD was used to analyse the soil composition, as shown in Fig. 2. A laser particle size analyser (BT-9300S, Bettersize Instruments, Ltd.) was used to analyse the particle size of the soil samples, as shown in Fig. 3.| Liquid limit (%) | Plastic limit (%) | Plasticity index | Moisture content (%) | Salt content (%) | pH |
|---|---|---|---|---|---|
| 23.8 | 16.3 | 7.5 | 19.7 | 1.1 | 8.4 |
2.3 Preparation of corrosion samples
A rubber box with dimensions of 7.07 × 7.07 × 7.07 cm3 was used as the test mould for corrosion testing. Each steel sample was buried within the saline soil so that it was located 2 cm from the bottom of the mould. The working surface of the steel sample was in close contact with the soil. The soil filling process ensured that all the sample corrosion tests used the same amount of soil and that the filling height was consistent. A multi-layer filling process with layer-by-layer tamping was employed to avoid the influence of soil density. After this preparation process, the corrosion samples were sealed with a waterproof and breathable membrane. The corrosion samples were weighed after each test to keep the water content of the soil unchanged. Finally, the samples were held at room temperature (20 °C) for corrosion testing. Each low-carbon steel was tested with three corrosion samples.2.4 Three-electrode system
The steel sheets (Q235, X65, X70, and X80) embedded in the test mould were used as the working electrodes (WE), the counter electrode (CE) was a platinum electrode, and the reference electrode (RE) was a saturated calomel electrode (SCE, V vs. NHE 0.2415). Placed the reference electrode close to the working electrode and fixed the position of the three electrodes in the mold when making the samples to eliminate iR-drop. Ohmic compensation then was set on the specimen within the test software. The sample preparation and test process are shown in Fig. 4.2.5 Electrochemical measurements
Potentiodynamic polarisation curve scanning and electrochemical impedance spectroscopy measurements were performed using an electrochemical workstation (CorrTest CS350, Wuhan Corrtest Instruments Corp., Ltd.) with a three-electrode system. Before each formal test, polarisation was conducted for 15 min at the polarisation potential to ensure polarisation stability during the test. The potential range of the polarisation scan was −1 V to 3 V and the scan rate was 2 mV s−1. The measured polarisation curves were analysed by CVIEW2 software. The AC amplitude superimposed on the applied potential during EIS measurement was 10 mV, and the AC frequency range was 105 Hz to 10−1 Hz. The measurement results were fitted by ZView2 software to obtain the equivalent circuit and impedance parameters. EIS tests were conducted prior to polarisation tests to avoid the influence of the polarisation process on EIS measurement. All electrochemical measurements were carried out at 20 °C. Each of the electrochemical measurements was conducted three times to check the reproducibility.2.6 Weight loss test
Three parallel groups were performed for the weight loss test. The weight loss of corrosion of the four steels was measured at 14, 28, 120 and 360 days, respectively. The steel samples for the weight loss test were 15 mm × 15 mm × 2 mm in dimensions. The working surface of all samples were ground, eliminating surface defects to meet the requirements of smoothness. Ensured the surface condition of all samples was consistent. The sample dimensions were measured by vernier caliper. The samples were weighed by analytical balance with an accuracy of 0.0001 g. Steel samples were embedded into epoxy resin, and the 15 mm × 15 mm working surface of the samples were exposed. The soil sample for the weight loss test was the same as the electrochemical test. The buried specimens were taken out at 14, 28, 120 and 360 days, respectively, and the epoxy resin was removed. The corrosion products were removed with a descaling agent (1![[thin space (1/6-em)]](https://www.rsc.org/images/entities/char_2009.gif) :
:![[thin space (1/6-em)]](https://www.rsc.org/images/entities/char_2009.gif) 1 HCl + 3.5 g L−1 hexamethylenetetramine). The steel samples then were cleaned with distilled water and then with acetone, then air-dried and weighed. The mean value was calculated from the parallel group. Eqn (1) was used to calculate the average corrosion rate ACR (mm A−1).
1 HCl + 3.5 g L−1 hexamethylenetetramine). The steel samples then were cleaned with distilled water and then with acetone, then air-dried and weighed. The mean value was calculated from the parallel group. Eqn (1) was used to calculate the average corrosion rate ACR (mm A−1).
 | (1) |
2.7 Macro and micro corrosion morphology analysis
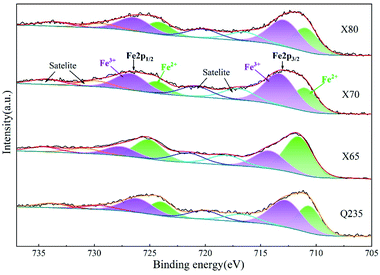
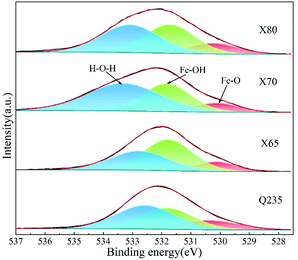
After electrochemical testing, the embedded steel samples were removed from their moulds, washed with absolute ethanol, and naturally air-dried. Next, a single-lens reflex digital camera (Canon EOS 80D) was used to observe the macroscopic topography. Scanning electron microscopy (SEM, Hitachi High-Technologies TM3000) coupled with energy-dispersive X-ray spectroscopy (EDS) was used to observe the corrosion morphology of the steel surfaces and to characterise and analyse the corrosion product elements. The SEM accelerating voltage was 15 kV. The Fe and O elements in corrosion products were analyzed by an X-ray photoelectron spectrometer (Thermo Scientific K-Alpha) with the Al Kα excitation. The C1s peak at 284.8 eV was used for binding energy calibration.3. Results and discussion
3.1 EIS of four low-carbon steels at different corrosion ages
The EIS results of the four steel samples (Q235, X65, X70, and X80) after 14 days of corrosion are shown in Fig. 5. The Nyquist plot of Q235 steel showed a capacitive reactance arc in the high-frequency region and an oblique line in the low-frequency region (Fig. 5a). The Bode plot of Q325 exhibited one time constant. The X65, X70, and X80 steels each showed a capacitive reactance arc in the high-frequency region and the low-frequency region. Two distinct peaks in their phase–frequency diagrams (Fig. 5b) and two time constants were observed for these steel samples. Diffusion features were observed in the low-frequency region of Q235, indicating that the electrochemical corrosion reaction process of this steel was controlled by a mass transfer process. In contrast, the corrosion of the other three steels was controlled by a charge transfer process. In the 10 Hz to 105 Hz frequency range of the Bode diagrams (Fig. 5c), the impedance modulus values of the four steels showed the same trend with increasing frequency. In the range of 0.1 Hz to 10 Hz, the impedance modulus values of X65, X70, and X80 increased, which was related to the accumulation of corrosion products on the electrode surfaces.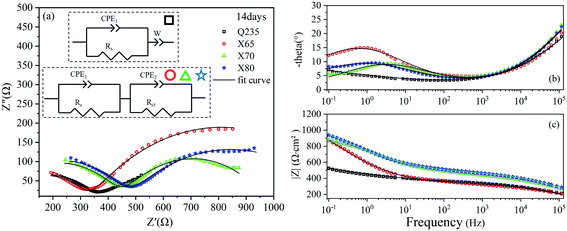 | ||
| Fig. 5 EIS diagrams of Q235, X65, X70, and X80 steel samples after 14 days of corrosion: (a) Nyquist diagram; (b), (c) Bode diagrams. | ||
The EIS results of the four steel samples after 28 days of corrosion are shown in Fig. 6. The Nyquist curves of these four steels were composed of a capacitive reactance arc in the high-frequency region and an oblique line in the low-frequency region. Compared with 14 days of corrosion, the capacitive reactance arcs of the X65, X70, and X80 steels in the low-frequency region were transformed into oblique lines. This indicated that the rate-controlling steps of these three steel corrosion reactions changed from charge transfer control to mass transfer. This result demonstrated that the surface product films of these steels were destroyed, leading to a more rapid charge flow. However, the reactant concentration in the interface area was insufficient to support the electrochemical reaction at a higher rate.
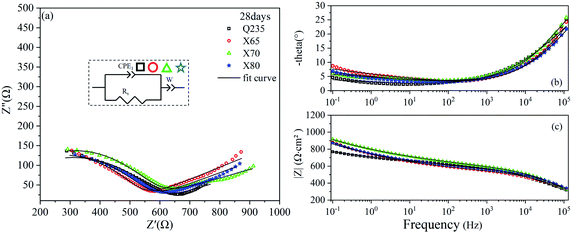 | ||
| Fig. 6 EIS diagrams of Q235, X65, X70, and X80 steel samples after 28 days of corrosion: (a) Nyquist diagram; (b), (c) Bode diagrams. | ||
The EIS results of the four steels after 120 days of corrosion are shown in Fig. 7. The Nyquist curves of the X65, X70, and X80 steels were composed of two capacitive reactance arcs in the high-frequency region and the low-frequency region, and two time constants were observed. The X65 steel also showed an oblique line in the low-frequency region, indicating that the corrosion process was controlled by both mass transfer and charge transfer. The corrosion of Q235 steel was still controlled by mass transfer, and one time constant was observed for this steel sample. The Bode diagram of Q235 (Fig. 7c) showed that the contribution of corrosion products on the Q235 steel surface to impedance was still low.
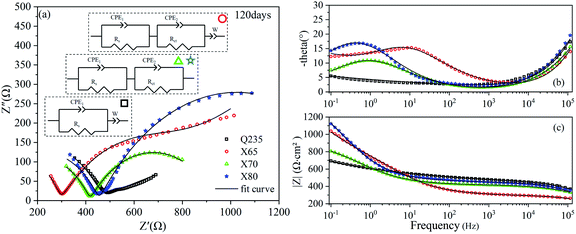 | ||
| Fig. 7 EIS diagrams of Q235, X65, X70, and X80 steel samples after 120 days of corrosion: (a) Nyquist diagram; (b), (c) Bode diagrams. | ||
The EIS results of the four steels after 360 days of corrosion are shown in Fig. 8. Two time constants were observed in the Nyquist curves of the X65, X70, and X80 steels. The corrosion process of Q235 steel was still controlled by mass transfer, and the corrosion of the other three steels was controlled by charge transfer. The impedance modulus curves of the four steels all increased by varying degrees from 14 to 360 days, indicating that the corrosion resistance of the four steels gradually increased with increasing corrosion time. This was attributed to the contribution of the corrosion product layer.
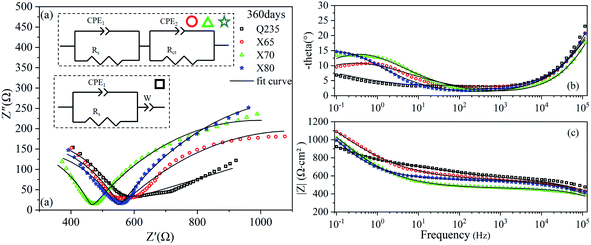 | ||
| Fig. 8 EIS diagrams of Q235, X65, X70, and X80 steel samples after 360 days of corrosion: (a) Nyquist diagram; (b), (c) Bode diagrams. | ||
The time constants obtained from these EIS results are the time constants of the relaxation process. The relaxation process is the response process of the state variable of electrochemical measurement in the system. In this experiment, the response of this state variable was capacitive. This response was caused by the capacitance of the electric double layer at the electrode–soil interface and the capacitive effect of corrosion products, as demonstrated by the capacitive reactance arcs of the Nyquist diagrams.
The electric double-layer capacitance at the electrode–soil interface generated the capacitive reactance arc in the high-frequency region on the Nyquist curves. This was the soil response. The capacitance behaviour of this soil was related to the soil characteristics.30 The soil had dielectric properties, which was attributed to the soil particle composition, water content, and pore characteristics.
The capacitive properties of the corrosion products were shown as capacitive arcs in the low-frequency region on the Nyquist curves. Corrosion products affect the diffusion of reactants from the soil to the electrode surface, the adsorption of salt ions to the electrode surface, and the charge transfer process in the corrosion reaction. In general, the size of the capacitive arc radius in the low-frequency region reflects the extent to which the charge transfer process in the corrosion reaction is hindered. A larger capacitive arc radius indicates more severely hindered charge flow. Thus, a larger capacitive arc radius indicates an inhibited corrosion reaction and reduced corrosion rate. The radius of the capacitive reactance arc in the low-frequency region corresponds to the charge transfer resistance.20 Usually, the impedance modulus value in the low-frequency region directly reflects the corrosion resistance of the metal, and this value is often used as an indicator of the corrosion rate.8 The oblique line in the low-frequency range can be regarded as the diffusion impedance in the reaction process.31 This diffusion impedance reflects barriers to the diffusion of reactants in the soil to the electrode surface.
EIS is one of the main techniques used to study electrochemical corrosion because it can characterise the response of different impedance contributions at different frequencies. The equivalent circuit models of the four low-carbon steels in saline soil at four ages were obtained by fitting the EIS results with ZView2 software. These equivalent circuit models are shown in the corresponding Nyquist diagrams, as shown in Fig. 5–8. CPE1 and Rs in these equivalent circuit models respectively represent the capacitance and resistance of the soil. Under ideal conditions, the electric double layer of the electrode–soil interface is equivalent to a capacitor. This is referred to as electric double-layer capacitance. However, solid electrodes were used in this experiment. The surfaces of these electrodes were not uniform, and the porous characteristics of the soil led to a “dispersion effect”. These factors meant that the frequency response characteristics of the electric double-layer capacitor deviated from pure capacitance behaviour. Therefore, the constant phase was used. In this work, CPE describes pure capacitance C,32 CPE2 represents the capacitance of the electrode–soil interface and the soil pore structure, and Rct represents the charge transfer resistance of steel during electrochemical corrosion in saline soil. W represents the Warburg impedance in the diffusion impedance, indicating that the mass transfer process is hindered in the corrosion process. The impedance of CPE was calculated using eqn (2):33
 | (2) |
In this experiment, the low-frequency oblique lines of the Nyquist plots deviated from a 45° angle. Therefore, the fitting error with ideal Warburg impedance was high, and CPE was used to replace Warburg impedance for fitting. On the other hand, the Warburg element was the constant phase element when CPE-P = 0.5.
The parameters of each element in the equivalent circuit obtained by EIS curve fitting after 14 days of corrosion are listed in Table 4. The relaxation time constants in the high-frequency region characterised the soil response. The time constant in the high-frequency region characterised the soil response. Due to the inhomogeneity of the natural soil and the complexity of the corrosion system, the Rs values obtained by fitting the four steels fluctuated. The time constants in the low-frequency region represented the charge transfer impedance, and the Rct values obtained by fitting were related to the radius of the capacitive reactance arcs in the low-frequency region of the Nyquist diagrams. The Rct value of X65 steel obtained by fitting was 954.6 Ω cm2, which was higher than the Rct values of X70 and X80. This indicated that the X65 steel was able to quickly deposit corrosion products on the electrode surface in the early stage of corrosion, which prevented early ion adsorption and charge transfer.
| Steel | CPE1 | Rs (Ω cm2) | CPE2 | Rct (Ω cm2) | W | |||
|---|---|---|---|---|---|---|---|---|
| CPE1-T (SP Ω−1 cm2) | CPE1-P | CPE2-T (SP Ω−1 cm2) | CPE2-P | W-T (SP Ω−1 cm2) | W-P | |||
| Q235 | 4.21 × 10⁻⁶ | 0.47065 | 321.6 | — | — | — | 0.005208 | 0.19356 |
| X65 | 4.36 × 10⁻⁶ | 0.46533 | 333.1 | 0.001104 | 0.47998 | 954.6 | — | — |
| X70 | 1.99 × 10⁻⁶ | 0.51126 | 446.7 | 0.000665 | 0.48894 | 527.7 | — | — |
| X80 | 1.77 × 10⁻⁶ | 0.51323 | 469.1 | 0.001041 | 0.42608 | 754.6 | — | — |
The fitting parameters after 28 days of corrosion are listed in Table 5. The corrosion reactions of the X65, X70, and X80 steels shifted from charge transfer control to mass transfer control. However, the Q235 steel was still controlled by diffusion. After 120 days of corrosion, Table 6 shows that the Rct fitting value of X65 steel was significantly lower than that after 14 days of corrosion. This demonstrated that the corrosion product film of X65 was damaged. The Rct fitting value of X80 steel was 1142 Ω cm2, which was more than twice as high as the Rct fitting values of X65 and X70. After 120 days of corrosion, the electrochemical corrosion reaction of Q235 steel was controlled by mass transfer, X65 was controlled by charge transfer and mass transfer, and X70 and X80 were controlled by charge transfer. After 360 days of corrosion, Table 7 shows that the charge transfer impedance of X80 steel increased to 1221 Ω cm2. This value steadily increased throughout the test period. The charge transfer resistance values of the X65 and X70 steels doubled compared to their values after 120 days of corrosion. These changes in Rct showed that the corrosion product film on the surface of the X80 steel was more stable in the corrosive environment and provided stronger protection to the metal under the film. In contrast, the X65 and X70 steels underwent a process of weakening and then strengthening.
| Steel | CPE1 | Rs (Ω cm2) | W | ||
|---|---|---|---|---|---|
| CPE1-T (SP Ω−1 cm2) | CPE1-P | W-T (SP Ω−1 cm2) | W-P | ||
| Q235 | 1.71 × 10⁻⁶ | 0.51333 | 516.7 | 0.004152 | 0.11412 |
| X65 | 6.39 × 10⁻⁷ | 0.57499 | 499.2 | 0.002788 | 0.19348 |
| X70 | 7.69 × 10⁻⁷ | 0.58929 | 497.3 | 0.002524 | 0.13921 |
| X80 | 1.03 × 10⁻⁶ | 0.54404 | 513.5 | 0.003032 | 0.17499 |
| Steel | CPE1 | Rs (Ω cm2) | CPE2 | Rct (Ω cm2) | W | |||
|---|---|---|---|---|---|---|---|---|
| CPE1-T (SP Ω−1 cm2) | CPE1-P | CPE2-T (SP Ω−1 cm2) | CPE2-P | W-T (SP Ω−1 cm2) | W-P | |||
| Q235 | 6.71 × 10⁻⁸ | 0.71669 | 413.6 | — | — | — | 0.003905 | 0.14563 |
| X65 | 4.68 × 10⁻⁹ | 0.91365 | 369.8 | 0.000648 | 0.54193 | 453.4 | 0.002871 | 0.25983 |
| X70 | 2.00 × 10⁻⁷ | 0.62761 | 417.4 | 0.0010848 | 0.56419 | 523.1 | — | — |
| X80 | 2.03 × 10⁻⁷ | 0.63739 | 454.3 | 0.000942 | 0.57985 | 1142 | — | — |
| Steel | CPE1 | Rs (Ω cm2) | CPE2 | Rct (Ω cm2) | W | |||
|---|---|---|---|---|---|---|---|---|
| CPE1-T (SP Ω−1 cm2) | CPE1-P | CPE2-T (SP Ω−1 cm2) | CPE2-P | W-T (SP Ω−1 cm2) | W-P | |||
| Q235 | 5.49 × 10⁻⁸ | 0.73375 | 475.9 | 0.002393 | 0.14713 | — | 0.002393 | 0.14713 |
| X65 | 1.27 × 10⁻⁷ | 0.6606 | 547.4 | 0.001208 | 0.42733 | 1115 | — | — |
| X70 | 6.75 × 10⁻⁸ | 0.7023 | 462.7 | 0.001149 | 0.50374 | 1056 | — | — |
| X80 | 2.62 × 10⁻⁷ | 0.61051 | 548.1 | 0.001811 | 0.53673 | 1221 | — | — |
3.2 Polarisation curves of four low-carbon steels at different corrosion ages
Most buried steel is located in a humid environment, and the corrosion that occurs is mainly electrochemical corrosion. Metal can undergo electrochemical corrosion in the solution phase by reacting with a substance in the solution, which oxidises the metal into metal ions or other compounds. The equilibrium potential of the reduction of this substance must be higher than that of the metal oxidation reaction. In corrosion processes, this substance is known as the depolariser. In this work, the depolariser was O2. In addition, in humid saline soil environments, salt ions such as Cl− and SO42− and gases such as CO2 and NO2 will dissolve in the moisture of the soil to form an electrolyte solution. Burying metal in this electrolyte solution leads to the formation of a corrosion micro-battery. The anode of this corrosion micro-battery is the metal and the cathode is metal inclusions. Corrosion micro-batteries can affect the rate of electrochemical corrosion and the extent of corrosion damage. The four low-carbon steels tested in this work had significant differences in carbon content. Increasing the carbon content provides a larger cathode reaction area for the corrosion micro-batteries and accelerates the corrosion of carbon steel.The polarisation curves of the four steels exhibited similar shapes. The anodic reaction was the dissolution of iron, and the cathodic reaction was the reduction of the depolariser (O2). These four steels all show passivation behaviour on the anodic curve, and an active dissolution zone, transition zone, and overpassivation zone were observed. In the active dissolution zone, the anode current density continuously increased with increasing potential. After reaching the passivation potential, the anode curves entered the passivation zone. In this zone, the current density sharply decreased and anode metal dissolution was inhibited. However, this transition zone was extremely short. This indicated that the passivation films on the electrode surfaces were quickly broken down after being formed. This behaviour was related to the extremely high penetration of Cl− in the soil. Moreover, due to the difference in cathode and anode current densities, Cl− was enriched on the metal surface in the anoxic zone. Thus, the corrosion product film was continuously weakened until it was destroyed, and the metal surface in this region was redissolved in an active state. At the same time, ions were adsorbed at the weak part of the electrode surface film under the action of electromigration, which accelerated the dissolution of metals in this area. This caused local corrosion on the electrode surface, resulting in pitting and crevice corrosion. Thus, corrosion holes, corrosion seams, and corrosion pits were formed.
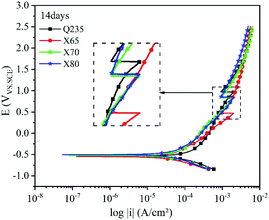
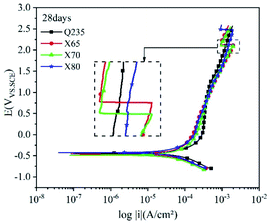
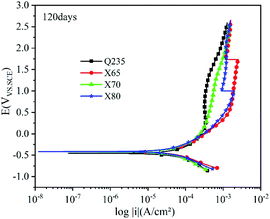
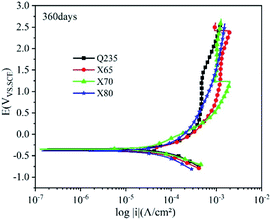
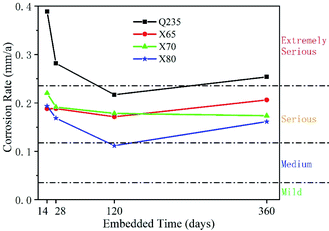
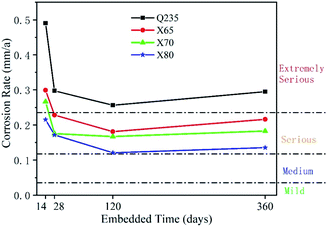
Fig. 9–12 show the polarisation curves of the four steels at 14, 28, 120, and 360 days, respectively. The weak polarisation region of polarisation curves were fitted through the linear fitting method, and the fitted potential range was −0.02 to 0.02 V (relative to the open circuit potential). The kinetic parameters related to corrosion were obtained by fitting, including the corrosion potential Ecorr (V), corrosion current density Icorr (A cm−2), polarisation resistance RP (Ω cm−2), and corrosion rate Ccorr (mm y−1). These corrosion parameters are listed in Tables 8–11. The corrosion rate (CR) was calculated based on Faraday's law using Icorr (Eqn (3)). The corrosion grade was determined according to the corrosion evaluation standard (Table 12).34
 | (3) |
| Steel | Ecorr (V) | Icorr (A cm−2) | RP (Ω cm−2) | Ccorr (mm A−1) | Corrosion level |
|---|---|---|---|---|---|
| Q235 | −0.5445 | 3.3068 × 10⁻⁵ | 788.89 | 0.38895 | Extremely serious |
| X65 | −0.54729 | 1.6096 × 10⁻⁵ | 1620.7 | 0.18812 | Serious |
| X70 | −0.52527 | 1.8823 × 10⁻⁵ | 1385.9 | 0.21999 | Serious |
| X80 | −0.50234 | 1.6554 × 10⁻⁵ | 1575.9 | 0.19347 | Serious |
| Steel | Ecorr (V) | Icorr (A cm−2) | RP (Ω cm−2) | Ccorr (mm A−1) | Corrosion level |
|---|---|---|---|---|---|
| Q235 | −0.4374 | 2.4113 × 10⁻⁵ | 1081.8 | 0.28182 | Extremely serious |
| X65 | −0.45918 | 1.6117 × 10⁻⁵ | 1618.6 | 0.18836 | Serious |
| X70 | −0.48177 | 1.6370 × 10⁻⁵ | 1593.6 | 0.19131 | Serious |
| X80 | −0.42495 | 1.4423 × 10⁻⁵ | 1808.7 | 0.16856 | Serious |
| Steel | Ecorr (V) | Icorr (A cm−2) | RP (Ω cm−2) | Ccorr (mm A−1) | Corrosion level |
|---|---|---|---|---|---|
| Q235 | −0.45741 | 1.8449 × 10⁻⁵ | 1414 | 0.217 | Serious |
| X65 | −0.4148 | 1.4564 × 10⁻⁵ | 1791.3 | 0.1713 | Serious |
| X70 | −0.41374 | 1.5155 × 10⁻⁵ | 1721.3 | 0.17826 | Serious |
| X80 | −0.42235 | 9.4870 × 10⁻⁶ | 2749.8 | 0.11159 | Medium |
| Steel | Ecorr (V) | Icorr (A cm−2) | RP (Ω cm−2) | Ccorr (mm A−1) | Corrosion level |
|---|---|---|---|---|---|
| Q235 | −0.337 | 2.1574 × 10⁻⁵ | 1209.2 | 0.25376 | Extremely serious |
| X65 | −0.37575 | 1.7522 × 10⁻⁵ | 1488.8 | 0.2061 | Serious |
| X70 | −0.34878 | 1.4748 × 10⁻⁵ | 1768.8 | 0.17347 | Serious |
| X80 | −0.38643 | 1.3721 × 10⁻⁵ | 1901.2 | 0.16139 | Serious |
| Corrosion level | Mild | Medium | Serious | Extremely serious |
| Current density | Icorr < 3 μA cm−2 | 3 < Icorr < 10 μA cm−2 | 10 < Icorr < 20 μA cm−2 | 20 μA cm−2 < Icorr |
In Eqn (2), M is the molar mass of iron (56 g mol−1), z is the number of electrons transferred per metal atom, F is the Faraday constant (96![[thin space (1/6-em)]](https://www.rsc.org/images/entities/char_2009.gif) 485.3C mol−1), ρ is the density of iron (7.82 g cm−3), and A is the working area of the electrode (1 cm2).
485.3C mol−1), ρ is the density of iron (7.82 g cm−3), and A is the working area of the electrode (1 cm2).
The polarisation curves of the four steel samples after 14 days of corrosion (Fig. 9) show that their anodic curves developed similarly. After entering the strong polarisation zone, the growth of the anode current density of the four steels gradually slowed down with increasing potential. The appearance of anode peaks on these curves indicated the existence of local corrosion on the electrode surface. After this peak, anode current density growth accelerated until passivation occurred. The anode current density continued to increase after passivation. The reduction reaction of O2 occurred at the cathode of the polarisation curve, and this reaction was affected by the diffusion process. In the linear region and the weak polarisation region, the anodic and cathodic polarisation curves of Q235 steel were shifted to the right compared with the other steels. As shown in Table 8, the corrosion current density fitting value of Q235 steel was 3.3068 × 10⁻⁵ A cm−2, which was about 2 times higher than that of the other three steels. This shows that Q235 steel had a higher current density, a higher electrochemical reaction rate, and the most serious corrosion compared with the other steel samples.
The anodic polarisation curves of the four steels had a significant negative shift after 28 days of corrosion (Fig. 10), demonstrating that anodic dissolution was inhibited. The corrosion current densities of the four steels decreased to varying degrees. The corrosion current density of Q235 steel decreased by 0.8995 × 10⁻⁵ A cm−2, while that of X65 steel did not significantly change. The corrosion current densities of X70 and X80 steel decreased by 0.2462 × 10⁻⁵ A cm−2 and 0.2131 × 10⁻⁵ A cm−2, respectively. This is because the corrosion film hindered charge transfer as well as ion migration and enrichment, which weakened the influence of the corrosion reaction kinetics and thermodynamic factors. Anodic peaks were observed on the polarisation curves, confirming the occurrence of pitting corrosion. The curve of Q235 steel was still shifted to the far right in the linear region and weakly polarised region, and the overall reaction rate of Q235 was higher than that of the other steels.
After 120 days of corrosion (Fig. 11), the anodic curves significantly differed in the strong polarisation area. For Q235 steel and X70 steel, the increase in anode current density first slowed down and then accelerated, indicating that their corrosion product films were damaged and that localised corrosion occurred. Compared with the 14th day, the four steels had higher self-corrosion potential on the 120th day. This was because the Fe2+ released via iron dissolution accumulated on the electrode surfaces of the steels due to their hindered corrosion product films, resulting in higher potential.35
After 360 days of corrosion (Fig. 12), the polarisation curves of the four steels showed more changes in the strong polarisation region. The anodic current densities of Q235, X65, and X70 significantly fluctuated greatly in this region, indicating that their corrosion product films were damaged. However, the anodic curve of X80 steel showed no obvious fluctuation, and the slope of its corrosion current density increased with increasing potential. This indicated that the film structure of X80 was well-preserved and the degree of local corrosion was relatively light. The self-corrosion potentials of the four steels were all greater than −0.4 V at 360 days, demonstrating that they had reduced corrosion tendency.
3.3 Corrosion rates of four low-carbon steels
The general electrode reaction process includes three processes: the transfer process of reactants in the solution phase to the electrode surface, the reaction process in the interface area, and the removal of corrosion products from the interface area. In this experiment, the corrosion products were deposited on the electrode surface, so the third process did not occur. The second process was the main electrochemical corrosion process. This process included adsorption, charge transfer, chemical reaction, and other steps, which successively occurred in series. The main adsorption process in this experiment was contact adsorption on the electrode surface. The main adsorbed anions were OH−, which directly participated in the reaction, and Cl−, which played a catalytic role in the corrosion process.36 Charge transfer occurred during the electrochemical corrosion reaction: the anode metal dissolved and lost electrons. Then, the electrons flowed to the cathode and were accepted by the cathode depolariser, and the cathode underwent a reduction reaction.
The rate-controlling model for corrosion follows Liebig's law of the minimum, where the overall reaction rate is determined by the most difficult step in a series of steps. This step is known as the rate-controlling step. The main control steps in this experiment were the mass transfer step and the charge transfer step. These steps replace the first and second electrode processes, respectively, and an adsorption step also occurs during the second process.
The declining corrosion rate is easily understood when corrosion products are deposited on the electrode surface and a corrosion product film is formed. In the presence of a corrosion product film, the corrosion reaction site is transferred from the phase boundary area between the original electrode and the soil to the interface area between the electrode and the corrosion product film. This significantly hinders reactant mass transfer, anion adsorption, and charge transfer. When there are enough reactants (depolarisers) to participate in the reaction on the electrode surface, but not enough electrons flowing from the anode to the cathode, the rate of charge transfer becomes the electrochemical reaction's rate-controlling step. When there is sufficient electron flow from the anode to the cathode, but not enough electron acceptors (depolarisers), the mass transfer process becomes the rate-controlling step. The EIS results show that the Q235 steel was subject to mass transfer control over a long period of time, while the other three steels shifted from charge transfer control to mass transfer control and back to charge transfer control. This shows that under the soil conditions of this test, the electrochemical corrosion reaction rate of Q235 steel was dependent on the concentration of reactants provided by the soil, not on the electrode itself. The other three steels showed the opposite behaviour. The charge transfer rates of these steels, which reflect the corrosion resistance of their electrodes, indicate that the corrosion resistance of Q235 steel was not as good as that of the other three steels. The corrosion resistance values of X65, X70, and X80 were distinguished by their fitted Rct values. In the long term, X80 steel exhibited the best corrosion resistance, and X65 and X70 showed similar corrosion resistance.
3.4 Corrosion mechanism and corrosion products characterization
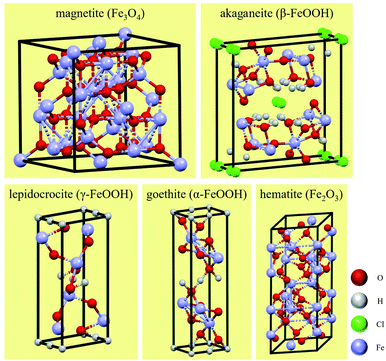
In soil environments, the corrosion products on the surfaces of low-carbon steels are mainly composed of iron oxides, including compounds such as red-brown hematite (Fe2O3) and black and magnetic magnetite (Fe3O4). These two corrosion products generally exhibit a layered distribution, with the magnetite usually closer to the metal surface. The common corrosion products in Cl−-containing soil environments include iron hydroxides as well as iron oxides. These iron hydroxides include lepidocrocite (γ-FeOOH), goethite (α-FeOOH), akaganeite (β-FeOOH), and other amorphous hydroxide crystals.41 γ-FeOOH exhibits a mostly plate-like or flake-like crystal morphology. α-FeOOH is mostly scale-like, column-like, needle-like, or clustered into small spheres, and β-FeOOH presents a needle-like crystal morphology.26,42 The formation of β-FeOOH requires high concentrations of chloride and a wet-dry corrosion environment cycle. However, compared with atmospheric corrosion, the diffusion resistance of soil is high, and it is difficult for high concentrations of Cl− to accumulate on metal surfaces in soil. Therefore, β-FeOOH is usually found in the atmospheric corrosion products under a high concentration of chlorides.27 The crystal cells of corrosion products are shown in Fig. 15.
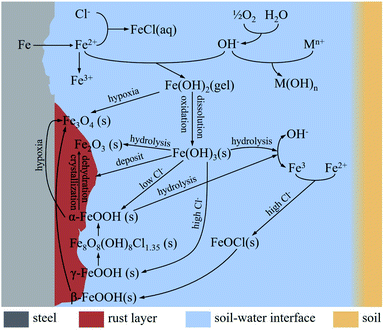
Fig. 16 show the corrosion reactions of steels in saline soil. In water and oxygen-containing environments, iron at the anode dissolves and releases Fe2+ to the phase boundary reaction zone (earth-water-gas):
| Fe → Fe2+ + 2e− | (4) |
Oxygen is reduced to OH− at the cathode:
| O2 + 2H2O + 4e− → 4OH− | (5) |
Fe2+ reacts with OH− to form unstable ferrous hydroxide:
| Fe2+ + 2OH− → Fe(OH)2 (s) | (6) |
Cl− and cations generated by chloride hydrolysis react with Fe2+ and OH− to form FeCl2 (anode) and hydroxide (cathode), respectively. Therefore, Cl− can consume Fe2+ to accelerate the dissolution of iron, which accelerates the corrosion rate:
| Anode: Fe2+ + 2Cl− → FeCl2 (aq) | (7) |
| Cathode: Mn+ + nOH− → M(OH)n | (8) |
Fe(OH)2 (s) is easily soluble and can be oxidised to Fe(OH)3, and some of the Fe(OH)3 (s) is deposited on the corrosion products:
| 4Fe(OH)2 + O2 + 2H2O → 4Fe(OH)3 (s) | (9) |
The partial hydrolysis of Fe(OH)3 (s) leads to the production of Fe3+ and OH−:
| Fe(OH)3 (s) → Fe3+ + 3OH− | (10) |
Some of the Fe(OH)3 is hydrolysed to form hematite (Fe2O3):
| 2Fe(OH)3 → Fe2O3 + 3H2O | (11) |
And some of the Fe(OH)3 (s) is dehydrated to produce FeOOH:
| Fe(OH)3 (s) → FeOOH (s) + H2O | (12) |
The soil used in this work was alkaline soil with a pH value of 8.4, and γ-FeOOH and α-FeOOH were generated in this alkaline soil.43 Moreover, γ-FeOOH appeared earlier than α-FeOOH during the corrosion process. α-FeOOH was considered to be the stable form of γ-FeOOH, which was transformed into α-FeOOH with further corrosion. When the Cl− concentration in the environment was high, the conversion process of γ-FeOOH to α-FeOOH also involved the intermediate product β-Fe8O8(OH)8Cl1.35. α-FeOOH has a more compact crystal structure than γ-FeOOH.42
α-FeOOH is hydrolysed to Fe3+ and OH− in humid environments:
| α-FeOOH + H2O → Fe3+ + 3OH− | (13) |
When the oxygen in soil is insufficient, Fe(OH)2 reacts with oxygen to generate magnetite (Fe3O4):38,44
| 3Fe(OH)2 (s) + (1/2)O2 → Fe3O4 + 3H2O | (14) |
The formation of β-FeOOH requires relatively harsh conditions, with a high concentration of Cl−. Moreover, the corrosion reaction zone needs to undergo a dry–wet cycle. These conditions are generally generated in atmospheric corrosion environments:27
In wet cycle:
| (Fe2+, Fe3+) + Cl− + OH− → FeOCl + h + HCl | (15) |
In dry cycle:
| FeOCl → β-FeOOH | (16) |
Magnetite (Fe3O4) can also be produced by the reaction of β-FeOOH with Fe2+ ions:45
| 8β-FeOOH + Fe2+ + 2e− → 3Fe3O4 + H2O | (17) |
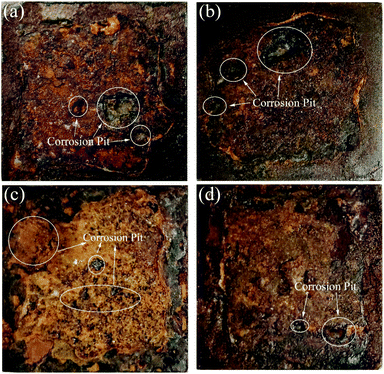 | ||
| Fig. 17 Macroscopic corrosion morphology of the low-carbon steels after 360 days of corrosion: (a) Q235; (b) X65; (c) X70; (d) X80. | ||
The microscopic images shown in Fig. 18 show the significant accumulation of corrosion products on the surfaces of the steel sheets. Differences in corrosion product thickness indicated different corrosion reaction rates at the corrosion interface. The corrosion products exhibited obvious porous, fractured, and delaminated features, and surface corrosion was extremely uneven. Obvious corrosion pits (Fig. 18b, d and f) and corrosion cracks (Fig. 18a, c, e and g) confirmed the occurrence of localised corrosion. The α-FeOOH crystals had a fine granular morphology (Fig. 18a, c, e and g) and γ-FeOOH was present as mica flakes (Fig. 18e). The presence of some fine spherical crystals observed around the γ-FeOOH flakes confirmed the transformation process of γ-FeOOH to α-FeOOH.
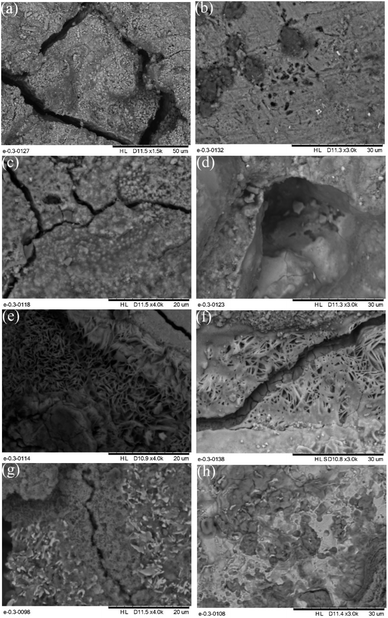 | ||
| Fig. 18 Microscopic corrosion morphology of the low-carbon steels after 360 days of corrosion: (a), (b) Q235; (c), (d) X65; (e), (f) X70; (g), (h) X80. | ||
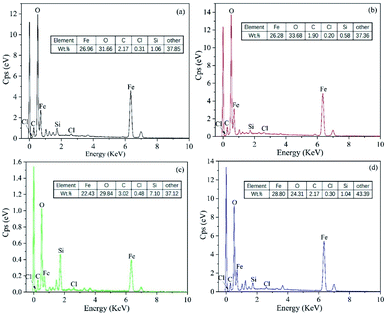
The EDS spectra shown in Fig. 19 indicate the high O and Fe content of these sample surfaces. This was due to the iron oxide and iron matrix in the corrosion products. The presence of Cl was due to the chloride in the saline soil, which was the main source of Cl− in the soil. The small radius of Cl− means that it is very destructive to passivation films.46
3.5 Analysis of corrosion resistance differences
The macroscopic sample images (Fig. 17) show that the corrosion products on the X80 steel were lighter than those of the other three steels. Combined with the EIS and polarisation curve results, it can be concluded that the corrosion resistance of these four steels follows the order X80 > X70 ≈ X65 > Q235. This varying corrosion resistance was related to the elemental composition and content of the four steels. The main elements affecting the corrosion resistance of steel are Cr, C, Si, Mn, P, S, Ti, Mo, Cu, and Nb. Cr is commonly used to improve the corrosion resistance of steel. Moreover, Cr can improve the compactness of the corrosion product film on steel surfaces and accelerate the repair process. M. Yamashita et al.53 found that Cr improved the compactness of α-FeOOH crystals. When the content of Cr in α-FeOOH exceeded 5%, the Cr effectively inhibited the diffusion of corrosive anions and improved the intergranular corrosion resistance of their steel. The presence of C usually reduces the corrosion resistance of steel. C can enhance the chemical corrosion of cathode and anode metals and accelerate the dissolution of anode metals. Moreover, C also reacts with Cr. The formation of C and Cr-containing compounds leads to a reduction of intergranular Cr in the steel, which enhances steel pitting corrosion. Si can be enriched on the surface of steel to enhance its corrosion resistance, and Si also promotes the accumulation of Cr, which accelerates the formation of a passivation film;54 J. Mejía Gómez et al.55 reported that Si pairs optimised the crystal structure of goethite and improved the pitting resistance of steel, while increasing the Si content (from 0.3% to 3%) was beneficial for enhancing the corrosion resistance of steel. Mn can enhance the corrosion resistance of steel in acid solution. Sathiyanarayanan et al.56 found that Mn inhibited metal corrosion in acid solution, and this was attributed to the blocking effect of Mn on iron dissolution. P can significantly improve the corrosion resistance of low-carbon steel. M. S. Walker et al.57 added phosphorus ions to the surface of low-carbon steel and found that the stability and thickness of the passivation film formed on the steel surface were significantly enhanced. Moreover, when the steel contained Cu, the composite effect of P and Cu enhanced the corrosion resistance of the steel. S negatively affects the corrosion resistance of steel. Therefore, the S content in steel usually needs to be controlled. Ti and Nb can react with C to form TiC and NbC. Reducing the content of C in steel inhibits the reaction of C and Cr and therefore reduces the negative effect of C on the corrosion resistance of steel. Moreover, stable TiC and NbC can fill the intergranular defects and improve the intergranular corrosion resistance of steel. The addition of Mo leads to the formation of insoluble MoO2 and hexavalent molybdate on the surface of steel, which can improve the properties of the rust layer and inhibit the pitting corrosion of Cl−. Cu can improve the corrosion resistance of steel, and the presence of Cu in the metal matrix can lead to the formation of a passivation film in advance. Furthermore, the enrichment of Cu2+ on the active surface of steel can inhibit the dissolution of anode metal.58 However, while Cu can effectively protect steel from atmospheric corrosion, the influence of Cu is very limited in saline soil environments.The presence of Cr, Si, Mn, P, Ti, Nb, Mo, and Cu was beneficial for enhancing the corrosion resistance of the four low-carbon steels investigated in this work, while C and S negatively affected corrosion resistance (Table 1). The C content of Q235 steel was more than twice that of X80 steel and higher than that of the other steels. Moreover, the S content of Q235 was also higher than that of the other three steels. X65 and X70 steel had similar C, Si, Mn, and other elemental content. Therefore, these two steels exhibited similar corrosion resistance in saline soil. This was confirmed by EIS and potentiodynamic scanning. In addition, compared with Q235 steel, X65 and X70 steel contained lower harmful element content and higher beneficial element content. Thus, X65 and X70 exhibited stronger corrosion resistance than Q235 steel. X80 steel has the lowest C and S content in addition to the highest Mn, P, Nb, and Ti content. X80 also contained Cr and Mo. Therefore, the X80 steel showed excellent corrosion resistance. This analysis and the obtained test results demonstrate that the corrosion resistance of X80 steel was the best among the four steels.
4. Conclusions
In this paper, electrochemical corrosion tests were performed on Q235, X65, X70, and X80 steels embedded in natural saline soil. EIS, PC, SEM, EDS, and XRD were used to investigate the steel corrosion process under laboratory conditions. The main conclusions are as follows:(1) The electrochemical corrosion rate of these four low-carbon steels in saline soil was determined by the rate-controlling step, which varied with the electrode surface state and the surrounding environment. During the corrosion test period, Q235 steel was mainly controlled by mass transfer, while the corrosion of X65 shifted from charge transfer control to mass transfer, co-control, and finally charge transfer control. The corrosion of X70 and X80 shifted from charge transfer control to mass transfer control and then charge transfer control. This indicated that Q235 steel was not able to self-suppress corrosion in the saline soil environment of this experiment. In contrast, the formed corrosion product films on X65, X70, and X80 steel slowed down the corrosion rate to a certain extent.
(2) The corrosion rates of the four low-carbon steels showed an overall decreasing trend with increasing corrosion time. The corrosion rates in the middle and late stages of corrosion were much lower than that in the initial stage, and the corrosion rates fluctuated during the test period. This fluctuation was caused by the repeated formation and destruction of the corrosion product film. The general corrosion rate order of the four low-carbon steels was: Q235 > X65 ≈ X70 > X80.
(3) Oxygen absorption corrosion occurred in the saline soil for all four low-carbon steels, and the corrosion type was localised corrosion. Obvious corrosion pits, porosity, and cracking were visible on the surface of the steel sheet samples. The corrosion product accumulation on the steel surfaces exhibited poor uniformity and compactness. The adsorption of Cl− from the saline soil to the electrode surface caused pitting corrosion. Cl− also destroyed the corrosion product film on the electrode surface.
(4) The elemental compositions of the four low-carbon steels were quite different. This was mainly why the four steels exhibited different corrosion behaviour and different corrosion resistance properties in the same saline soil environment. In combination with the EIS and dynamic potential polarisation test results, this showed that among the four steels, X80 steel exhibited the best corrosion resistance, X65 and X70 steel had similar corrosion resistance, and Q235 steel had the lowest corrosion resistance.
Conflicts of interest
There are no conflicts to declare.Acknowledgements
This work was supported by the National Natural Science Foundation of China (No. 41807256), the Applied Basic Research Program in Shanxi Province (No. 20210302123139).References
- J. Yang, Acta Pedol. Sin., 2008, 837–845 Search PubMed.
- M. Orazem, Underground Pipeline Corrosion, Elsevier, 2014 Search PubMed.
- H. R. Vanaei, A. Eslami and A. Egbewande, Int. J. Pressure Vessels Piping, 2017, 149, 43–54 CrossRef CAS.
- L. Xu and Y. Cheng, Corros. Sci., 2013, 73, 150–160 CrossRef CAS.
- X. Su, Z. Yin and Y. F. Cheng, J. Mater. Eng. Perform., 2013, 22, 498–504 CrossRef CAS.
- C. Hai, Z. Wang, F. Lu, S. Zhang, C. Du, X. Cheng and X. Li, J. Mater. Eng. Perform., 2021, 30, 8014–8022 CrossRef CAS.
- M. H. Nazari, S. Allahkaram and M. Kermani, Mater. Des., 2010, 31, 3559–3563 CrossRef CAS.
- X. Bai, B. He, P. Han, R. Xie, F. Sun, Z. Chen, X. Liu and Y. Wang, J. Mater. Eng. Perform., 2021, 1–16 Search PubMed.
- X. Nie, X. Li, C. Du and Y. Cheng, J. Appl. Electrochem., 2009, 39, 277–282 CrossRef CAS.
- K. Gong, M. Wu, F. Xie and G. Liu, J. Nat. Gas Sci. Eng., 2020, 77, 103264 CrossRef CAS.
- B. He, P. Han, C. Lu and X. Bai, Materialwiss. Werkstofftech., 2015, 46, 1077–1087 CrossRef CAS.
- H. Zhang, X. He, Y. Hua, X. Bai and C. Yuan, Mater. Corros., 2021, 72, 1065–1075 CrossRef CAS.
- S. Suganya and R. Jeyalakshmi, J. Mater. Eng. Perform., 2019, 28, 863–875 CrossRef CAS.
- E. A. Noor and A. H. Al-Moubaraki, Arabian J. Sci. Eng., 2014, 39, 5421–5435 CrossRef CAS.
- X. Bai, B. He, P. Han, R. Xie, F. Sun, Z. Chen, Y. Wang and X. Liu, RSC Adv., 2022, 12, 129–147 RSC.
- C. Du, X. Li, P. Liang, Z. Liu, G. Jia and Y. Cheng, J. Mater. Eng. Perform., 2009, 18, 216–220 CrossRef CAS.
- B. He, C.-h. Lu, P.-j. Han and X.-h. Bai, Eng. Failure Anal., 2016, 59, 410–418 CrossRef CAS.
- Q. Qin, B. Wei, Y. Bai, Q. Fu, J. Xu, C. Sun, C. Wang and Z. Wang, Eng. Failure Anal., 2021, 120, 105065 CrossRef CAS.
- M. Yan, C. Sun, J. Xu and W. Ke, Ind. Eng. Chem. Res., 2014, 53, 17615–17624 CrossRef CAS.
- L. Quej-Ake, A. Contreras, H. Liu, J. Alamilla and E. Sosa, Anti-Corrosion Methods and Materials, 2018 Search PubMed.
- M. Sancy, Y. Gourbeyre, E. Sutter and B. Tribollet, Corros. Sci., 2010, 52, 1222–1227 CrossRef CAS.
- X. Zhang, Z. H. Jiang, Z. P. Yao, Y. Song and Z. D. Wu, Corros. Sci., 2009, 51, 581–587 CrossRef CAS.
- J. Boah, S. Somuah and P. LeBlanc, Corrosion, 1990, 46, 153–158 CrossRef CAS.
- Y. Lan, H. Chang, G. Qi, P. Han and B. He, Int. J. Electrochem. Sci., 2021, 16, 9 Search PubMed.
- S. Réguer, P. Dillmann and F. Mirambet, Corros. Sci., 2007, 49, 2726–2744 CrossRef.
- Y. Song, G. Jiang, Y. Chen, P. Zhao and Y. Tian, Sci. Rep., 2017, 7, 1–13 CrossRef PubMed.
- Y. Ma, Y. Li and F. Wang, Corros. Sci., 2009, 51, 997–1006 CrossRef CAS.
- A. Askey, S. Lyon, G. Thompson, J. Johnson, G. Wood, M. Cooke and P. Sage, Corros. Sci., 1993, 34, 233–247 CrossRef CAS.
- T. Chen, B. Yang, B. Li, J. Guo, P. Zhang and X. Cao, J. Mater. Process. Technol., 2020, 275, 116375 CrossRef CAS.
- M. Yan, C. Sun, J. Dong, J. Xu and W. Ke, Corros. Sci., 2015, 97, 62–73 CrossRef CAS.
- Y. Chen, Y. Liu, Y. Xie, H. Zhang and Z. Zhang, Surf. Coat. Technol., 2021, 423, 127622 CrossRef CAS.
- X. Du, Y. Liu, D. Chen, Z. Zhang and Y. Chen, Surf. Coat. Technol., 2022, 436, 128279 CrossRef CAS.
- Y. Chen, Y. Liu, Y. Xie, H. Zhang, X. Du and Z. Zhang, J. Alloys Compd., 2022, 893, 162305 CrossRef CAS.
- H. Tang, G. Song, C. Cao and H. Lin, Corros. Sci. Prot. Technol., 1995, 7, 285–292 CAS.
- F. Sun, R. Xie, B. He, Z. Chen, X. Bai and P. Han, Int. J. Electrochem. Sci., 2021, 16, 150878 CrossRef CAS.
- N. S. Palsson, K. Wongpinkaew, P. Khamsuk, S. Sorachot and W. J. M. Pongsaksawad, Corrosion, 2020, 71, 1019–1034 CAS.
- J. Eid, H. Takenouti, B. A. Saadi and S. Taibi, Corros. Sci., 2020, 168, 108556 CrossRef CAS.
- U. Evans, Corros. Sci., 1969, 9, 813–821 CrossRef CAS.
- J. Jaén and B. Fernández, Electrochim. Acta, 1989, 34, 885–886 CrossRef.
- A. Kuch, Corros. Sci., 1988, 28, 221–231 CrossRef CAS.
- H. Tamura, Corros. Sci., 2008, 50, 1872–1883 CrossRef CAS.
- H. Katsuki and S. Komarneni, J. Am. Ceram. Soc., 2001, 84, 2313–2317 CrossRef CAS.
- R. M. Cornell and U. Schwertmann, The iron oxides: structure, properties, reactions, occurrences, and uses, Wiley-vch, Weinheim, 2003 Search PubMed.
- Y. H. Huang and T. C. Zhang, Water Res., 2005, 39, 1751–1760 CrossRef CAS PubMed.
- J. J. Perdomo-Diaz, Chemical and Electrochemical Conditions on Steel under Disbonded Coatings, Case Western Reserve University, 1996 Search PubMed.
- L. Quej-Aké, N. Nava, M. Espinosa-Medina, H. Liu, J. Alamilla and E. Sosa, Corros. Eng., Sci. Technol., 2015, 50, 311–319 CrossRef.
- R. Qin, Y. Du, Z. Xu and M. Lu, RSC Adv., 2019, 9, 7698–7704 RSC.
- X. Gong, S. Li and P. S. Lee, Nanoscale, 2017, 9, 10794–10801 RSC.
- N. Li, C. Zhi and H. Zhang, Electrochim. Acta, 2016, 220, 618–627 CrossRef CAS.
- J. Hu, S. Li, J. Chu, S. Niu, J. Wang, Y. Du, Z. Li, X. Han and P. Xu, ACS Catal., 2019, 9, 10705–10711 CrossRef CAS.
- B. Zhang, L. Wang, Y. Zhang, Y. Ding and Y. Bi, Angew. Chem., Int. Ed., 2018, 57, 2248–2252 CrossRef CAS PubMed.
- R. Barik, B. K. Jena, A. Dash and M. Mohapatra, RSC Adv., 2014, 4, 18827–18834 RSC.
- M. Yamashita, H. Miyuki, Y. Matsuda, H. Nagano and T. Misawa, Corros. Sci., 1994, 36, 283–299 CrossRef CAS.
- A. Hermas, K. Ogura, S. Takagi and T. Adachi, Corrosion, 1995, 51, 01 CrossRef.
- J. M. Gómez, J. Antonissen, C. Palacio and E. De Grave, Corros. Sci., 2012, 59, 198–203 CrossRef.
- S. Sathiyanarayanan, C. Jeyaprabha, S. Muralidharan and G. Venkatachari, Appl. Surf. Sci., 2006, 252, 8107–8112 CrossRef CAS.
- M. S. Walker and R. L. Chance, Corrosion, 1984, 40, 307–312 CrossRef CAS.
- E. E. Oguzie, J. Li, Y. Liu, D. Chen, Y. Li, K. Yang and F. Wang, Electrochim. Acta, 2010, 55, 5028–5035 CrossRef CAS.
| This journal is © The Royal Society of Chemistry 2022 |

