 Open Access Article
Construction of a non-enzymatic electrochemical sensor based on graphitic carbon nitride nanosheets for sensitive detection of procalcitonin†
Yushuang Liu *,
Furong Chen,
Layue Bao and
Wenfeng Hai
 *
*
Inner Mongolia Key Laboratory of Carbon Nanomaterials, Nano Innovation Institute (NII), College Chemistry and Materials Science, Inner Mongolia University for Nationalities, Tongliao 028000, People's Republic of China. E-mail: yushuangliu1989@163.com
First published on 11th August 2022
Abstract
In this study, we established a label free and ultrasensitive electrochemical sensor based on graphitic nitride nanosheets (g-C3N4 NS) for procalcitonin (PCT) detection. Firstly, an easy-to-prepare and well-conducting g-C3N4 NS was synthesized. Next the g-C3N4 NS was immobilized on the electrode surface by π–π stacking, and further used to anchor the specific recognition peptide (PP). The surface morphology and structure after g-C3N4 NS and PP modification was characterized by X-ray photoelectron spectroscopy (XPS), atomic force microscopy (AFM) and electrochemistry. The sensing property of this sensor was evaluated by differential pulse voltammetry (DPV) and showed a detection sensitivity with a dynamic range from 0.15 to 11.7 fg mL−1 with a low limit of detection (LOD) of 0.11 fg mL−1. Besides, the electrochemical biosensor was successfully used to detect PCT in human serum samples, and the results suggest its potential use in clinical application.
1 Introduction
Sepsis is a critical whole-body inflammatory response due to microbial pathogen infection including by viruses, bacteria and fungi.1,2 If sepsis is not treated carefully, it may cause a systemic inflammatory response, in severe cases leading to organ dysfunction and ultimately death.3 Currently, sepsis is the main cause of death in Intensive Care Units (ICU) and its incidence is increasing worldwide with a mortality rate between 40 and 50% in developed countries and is responsible for more deaths than lung, breast and colon cancer combined.2,4 Thus, there is an urgent need for rapid, reliable and simple methods for diagnosis of the origin of sepsis to enhance survival rate and patient outcomes.5Currently, some biomarkers such as C-reactive protein (CRP), serum decoy receptor3 (DCR3), interleykin-6 (IL-6), tumor necrosis factor-α (TNF-α) and procalcitontin (PCT) have been investigated for the rapid identification of the origin of sepsis,6,7 and these biomarkers have received the most attention in work focusing on sensor development. In comparison, PCT is generally accepted as the most promising biomarker because of its uniqueness and better sensitivity and selectivity.8–10 In general, all of the PCT formed in C-cells and no PCT can enters the circulation, so its level in healthy subjects is below the detection level. However, the PCT levels will be raised after the patients were infected with bacterial sepsis.11,12 So far, there are diverse screening methods available for identifying the presence of infections including enzyme-linked immunosorbent assays (ELISA), blood cultures (BC),13,14 molecular diagnostic techniques,15 chemiluminescence immunoassay,16 microfluidics immunoassays and fluorescence immunoassay. Due to the expensive and complicated instruments, tedious sample treatment, time-consuming in the detection system,17,18 these methods can't meet the current needs for efficient and rapid detection of PCT. Hence, developing a sensitive and reliable method for PCT detection are required. Electrochemical methods with high sensitivity, selective, rapid response and portability have recently become burgeoning and powerful analytical methods.19–21 The sensitivity of electrochemical sensor is mostly related to the choice of electrode materials. Thus, the researchers are focused on electrode modification and have studied a lot of materials for the electrochemical detection of biomaterials.22
Recently, graphitic carbon nitride (g-C3N4) with its graphite-like structure and commendable stability under ambient conditions, has received extensive attention due to its high stability, nontoxicity, facile and low-cost synthesis, appropriate band gap in the visible spectral.23–25 In addition, as the most stable allotrope of carbon nitride semiconductor, it has become a promising material in photocatalysis, gas and fluorescent sensors, field emitter, electrode for fuel cells, and hydrogen storage for its abundant nitrogen active sites and unique superior catalytic activity.26,27 However, it is worth mentioning that as synthesized bulk g-C3N4 has poor conductivity, large band gap and low specific area, so it is not suitable for direct use in electrochemical sensing applications.
To conquer this problem, researchers have proposed various approaches (including the design of nanostructure, semiconductor composite, metal and non-metal mixtures) to enhance the electrochemical performance of g-C3N4.28,29 Although modifying or doping methods have been proved effective on utilizing pure g-C3N4 for electrochemical sensing, new methods to change its own structural defects to enhance the electrochemical sensing are still necessary. Recently, g-C3N4 nanosheets (g-C3N4 NS) directly prepared by ultrasonication-assisted liquid exfoliation of bulk g-C3N4 provide an attractive option for bioprobes and bioimaging applications.30 Like graphic or its derivatives, the graphite layer structure of g-C3N4 NS has higher specific surface area and provide more active sites. More importantly, some studies have shown that compared with the bulk g-C3N4, the g-C3N4 NS have better electrochemical activity and stability, suggesting that exfoliated ultrathin g-C3N4 NS are a promising candidate material for sensing application.31–33
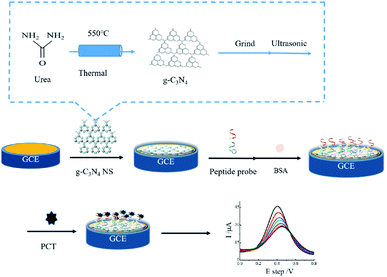
Therefore, in this work, a novel and highly sensitive electrochemical sensor based on a g-C3N4 NS modified glass carbon electrode for the detection of PCT has been developed. The fabricated process of the sensor was presented in Scheme 1. Firstly, the g-C3N4 was synthesized and exfoliated by the ultrasonication and then directly drop-casting on the electrode surfaces (g-C3N4 NS/GCE), which could effectively promote the electrochemical signal due to the increase in surface area and deduction of the surface activation energy after the g-C3N4 NS modification. Subsequently, the probe peptide (PP) was linked onto the electrode surface via the π–π stacking between the g-C3N4 NS and phenylalanine at the end of the polypeptide, providing an effective electrochemical strategy for the sensitive determination of PCT. Otherwise, this sensor also exhibits excellent detection performance of PCT in real samples, showing promising application in clinical test and disease diagnosis.
2 Experimental
2.1 Reagents and materials
Urea, sodium chloride (NaCl), potassium ferricyanide (K3Fe(CN)6) were obtained from Sinopharm Chemical Reagent Company (Shanghai, China). 1 M Tris–HCl, Bovine Serum Albumin (BSA) were supplied by Solarbio Company (Beijing, China). PCT, C-reaction protein and Interleukin-6 were purchased from Cusag Company (Wuhan, China). The capturing peptide powder was synthesized from Top-peptide Company (Shanghai, China), and the sequence of capturing peptide was displayed as follows:34PP: TSCNGHTCTRPNF.
All experimental water was ultrapure water by Mill-Q water purification (18.2 MΩ).
2.2 Instrumentations
The morphology of electrode surface and the surface potential were observed by atomic force microscope (AFM, Asylum MFP-3D origin+, Oxford). The function groups and the structure of the g-C3N4 NS was characterized by Fourier Transform Infrared Spectrometer (FI-RT, Nicolet Impact 400D spectrometer) and X-ray diffraction spectrometer (XRD, Malvern Panalytical). All electrochemical measurements were performed using a multi-channel potentiostat (interface 1010, Gamry) via EC-lab software version. X-ray photoelectron spectroscopy (XPS) was conducted on an ESCALAB 250 spectrometer using AlKα radiation as the X-ray source (1486.7 eV) with the pass energy of 30 eV.2.3 Preparation of ultrathin g-C3N4 nanosheets (NS)
The ultrathin g-C3N4 nanosheets (NS) were prepared with ultrasonication exfoliated method.35,36 The detailed procedure is summarized as follows. The g-C3N4 bulk was produced by heating urea at 550 °C with a ramp rate of 5 °C min−1 and maintained at this temperature for another 3 h in argon environment, the yellow-colored power g-C3N4 was obtained.To fabricate the g-C3N4 NS, 0.01 g bulk g-C3N4 power was added to 2 mL ethanol and ultrasonication for 1 h, afterward, the solution was allowed to stand undisturbed for overnight at room temperature to allow unexfoliated bulk g-C3N4 particles to settle at the bottom of the container.37 The supernatant liquid (a homogenized dispersion) of exfoliated g-C3N4 NS was collected and used for further studies.
2.4 Fabrication of electrochemical biosensor
Prior to modification, the bare GCE was polished with 0.3 μm alumina slurry, then washed with water and ethanol repetitiously under ultrasonic treatment and dried with nitrogen gas. Next, 20 μL g-C3N4 NS suspension was dropped on the GCE surface (0.3 cm) and incubated for 3 h. After washed with Milli-Q water, 50 μL of 500 μM PP was dripped onto the surface of the modified electrode at 4 °C for 5 h, rinsed with Tris–HCl buffer. The nonspecified binding sites were covered with 20 μL of BSA (2%, W/V).2.5 General characterization
All electrochemical testing measurements were performed in a Tris–HCl solution containing 5 mM K3Fe(CN)6/K4Fe(CN)6. Three electrode consist of a bare or a modified GCE was used as working electrode, an Ag/AgCl (in 3.3 M KCl) as reference electrode and a Pt wire as counter electrode. The function groups of bulk g-C3N4 NS were characterized by FT-IR in the wavenumber range of 2400–400 cm−1. The crystal structure of g-C3N4 NS were measured by using XRD in the 2θ range of 20° to 100° with CuKα radiation (λ = 0.15406). The surface morphologies of each fabrication steps were analysed by atomic force microscopy (AFM). All images were taken with a scan rate of 1 Hz at a scan range of 500 nm × 500 nm and XPS spectrometer which equipped with the AIKα radiation source and the takeoff angle of the photoelectron analyser was 90° respectively. The potential change of electrode surface was verified through AFM by the Scanning Kelvin Probe Microscopy (SKPM) mode.2.6 PCT sensing
The PCT in range from 1 ag mL−1 to 10 ng mL−1 in Tris–HCl (pH 7.0) was measured by DPV (pulse time = 1) at room temperature. For the detection in serum sample, the human blood serum samples from healthy individuals were supplied by Affiliated Hospital of Inner Mongolia Minzu University under permission of the ethical committee of the university. And Informed consents were obtained from human participants of this study. The samples were centrifuged at 5000 rpm for 20 min, then filtered with 0.22 membrane, and the supernatant was used for the subsequent tests. In the recovery test, the collected serum was diluted 100 times using Tris–HCl buffer, and then PCT was added to obtain the final concentration. The recoveries were calculated from three concentrations of PCT spiked human serum samples. The mean and standard deviation were obtained from three independent tests.3 Results and discussion
3.1 The morphology and structural information of the electrode surface
XPS was selected to identified the detail information of the g-C3N4 nanosheets. As shown in Fig. 1A, the peak for C, N, O can be seen. To locally enlarger view, the C1 peak can be deconvoluted to four peaks, which originate from the graphitic (284.3 eV), C–N/C–O bindings (285.2 eV), cyanide/cyanoquione (287.5 eV), and heptazine typed carbons (292.6 eV) respectively (Fig. 1B). For the N1s spectrum, the heptazine N (397.97 eV), pyrrolic N (399.3 eV), graphitic N (400.3 eV) and oxidic N (403.6 eV) can be deconvoluted respectively (Fig. 1C). All the characteristic peaks were in good agreement with the earlier reports of synthesized g-C3N4 NS.35 | ||
| Fig. 1 XPS survey spectrum of g-C3N4 (A) and the related high-resolution spectra of C1s (B) and N1s(C) binding energy regions. | ||
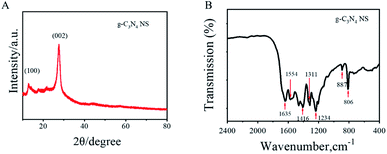
XRD patten and FT-IR spectrum were selected to determine the structure and the surface functional groups of the g-C3N4 nanosheets. For the XRD pattern, there were two distinct diffraction peaks can be found (Fig. 2A). The strongest peak at 27.62° is due to the stacking of the conjugated aromatic system, which is indexed for graphitic materials as the (002) peak and corresponding well to the interlayer d-spacing (0.336 nm) of the g-C3N4, indicating the formation of g-C3N4. The weak diffraction peak at 13.04° was assigned to the (100). The intensities of the diffraction peak at 13.04° become weaker with increasing heating temperatures, which indicate that the (100) crystal plane of g-C3N4 is slightly destroyed and the structure defects are formed when treated at high temperatures.38
Furthermore, for the FT-IR spectrum, the peaks at 1234 cm−1, 1311 cm−1, 1416 cm−1, 1554 cm−1 and 1635 cm−1 correspond to the typical stretching vibration modes of C![[double bond, length as m-dash]](https://www.rsc.org/images/entities/char_e001.gif) N and C–N heterocycles.39 The small peak located at 810 cm−1 is a signature of the characteristic breathing vibration mode of the triazine rings present in g-C3N4. The absorption feature at 889 cm−1 was associated to a deformation mode of cross-linked heptazine (Fig. 2B). All the characteristic peaks were good agreement with the prior reports on synthesized g-C3N4.
N and C–N heterocycles.39 The small peak located at 810 cm−1 is a signature of the characteristic breathing vibration mode of the triazine rings present in g-C3N4. The absorption feature at 889 cm−1 was associated to a deformation mode of cross-linked heptazine (Fig. 2B). All the characteristic peaks were good agreement with the prior reports on synthesized g-C3N4.
3.2 Characterization of the electrode
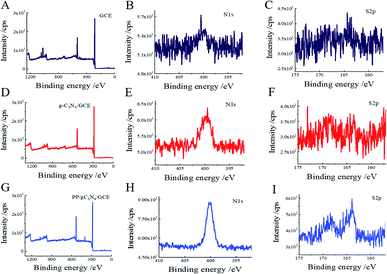
The morphological characterization of GCE surface was carried out by AFM. As shown in Fig. S1A,† the bare GCE surface was a relatively homogeneous flat structure, however, the electrode morphology changes significantly after the deposition of g-C3N4 NS and PP solution through the π–π stacking effect. The increased bright spots and the height indicate the successful modification of the electrode surface (Fig. S1B and C†).XPS was used to obtain the detail information on the elemental and structural composition of the modified electrode surface. Based on the XPS survey scan results, the narrow scan spectrum of bare GCE shows a strong carbon (C1s) signal and tiny nitrogen (N1s) and sulfur (S2p) contribution (Fig. 3A–C). The N contribution increased significantly, and the S remains unchanged after the g-C3N4 NS modified (Fig. 3D–F). The results indicate that the g-C3N4 NS has been stacked on the electrode surface. After drop-casting the PP, the narrow scan spectrum shows clear peaks of S2p compared to the bare GCE and g-C3N4 NS/GCE (Fig. 3G–I), indicating the probe peptide can successfully anchor on the electrode surface through the π–π stacking forces. Otherwise, the changes in the content of N and S elements on the electrode surface also further prove the success of the electrode modifications (Table S1†).
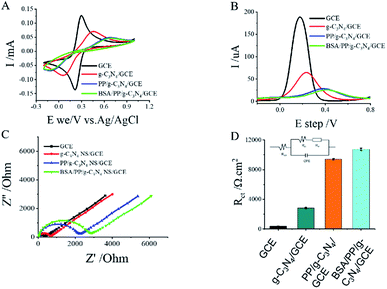
The cyclic voltammetry (CV), differential pulse voltammetry (DPV) and electrochemical impedance spectroscopy (EIS) were used to demonstrate the stepwise modification of the electrode surface. In the terms of EIS, [Fe(CN)6]3−/[Fe(CN)6]4− was utilized as the redox probe and the semicircle diameter was equal to electro-transfer resistance. In 5 mM [Fe(CN)6]3−/4−, bare electrode exhibited almost a straight line (Fig. 4C), which was characteristic of a mass diffusion limiting step of the electro-transfer process. When the g-C3N4 NS and PP was self-assembled on to the electrode through the π–π stacking, the impedance increased, this can be attributed to g-C3N4 NS and PP can blocked the diffusion of the redox probe of [Fe(CN)6]3−/4− and increased the interface electron transfer resistance.40 The charge transfer resistance of each electrode was shown in Fig. 4D. These results were in good agreement with the obtained from CV and DPV measurements (Fig. 4A and B). Those results demonstrated that the sensing interface has been successfully fabricated.
3.3 Effect of scan rate
To study the controlled factor of the electrochemical process on the electrode surface, the impact of scan rates on the electrochemical behavior of 1 mM PCT at PP/g-C3N4 NS/GCE in 20 mM Tris–HCl was explored through the CV methods. As shown in Fig. 5A, the reduction peak currents of the sensor were observed to increase in linear correlation to the scan rate in the range of 10–100 mV s−1. A linear dependency of the reduction peak currents on the scan rates was also obtained for the sensor in the presence of target PCT (Fig. 5B and C), which indicated that the electron transfer process of the modified electrode is diffusion-controlled.41 The equation expressing the relationship can be written as follows:| Ipa (μA) = 0.000004v1/2 + 7.5 × 10⁻⁶, R2 = 0.99 |
ln(Ipa) = 0.39![[thin space (1/6-em)]](https://www.rsc.org/images/entities/char_2009.gif) ln(v) − 2.12, R2 = 0.99 ln(v) − 2.12, R2 = 0.99 |
3.4 Detection performance of the electrochemical biosensor
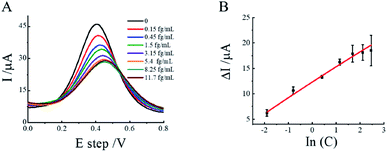
The performance of the PCT activity assay was carried out by exposing the substrate peptide probe on the biosensor to different concentrations of PCT under the same experimental conditions. Fig. 6A showed the DPV response of biosensor with different concentrations of PCT, the pulse time of DVP is 0.1 s (in Fig S2†). With increasing PCT concentration within the range of 0.15 fg mL−1 to 11.7 fg mL−1, the electrochemical oxidation peak current decreased gradually, which attributed to the larger size PP-PCT complex hindered the diffusion of redox probe towards electrode surface and increased the electrode transfer resistance. Moreover, there was a linear relationship between DPV signal and In(PCT) concentrations. The linear equation for PCT was described as I (μA) = 3.02![[thin space (1/6-em)]](https://www.rsc.org/images/entities/char_2009.gif) ln(C) + 12.88 (R2 = 0.99) and the detection limit were estimated to be 0.11 fg mL−1 (S/N = 3). Compared with other electrochemical methods, SPR biosensors and electrochemiluminescent immunosensor as list in Table S2,† our results present competitive detection limit. This result indicates that our devices can be used to detect the PCT and showed a better sensitivity compared with other reported methods.
ln(C) + 12.88 (R2 = 0.99) and the detection limit were estimated to be 0.11 fg mL−1 (S/N = 3). Compared with other electrochemical methods, SPR biosensors and electrochemiluminescent immunosensor as list in Table S2,† our results present competitive detection limit. This result indicates that our devices can be used to detect the PCT and showed a better sensitivity compared with other reported methods.
For better understanding the mechanics of the higher detection sensitivity, SKPM measurements was performed. As shown in Fig. 7, the surface potential was increased about 0.3 V (from 0.9 V to 1.2 V) after the g-C3N4 NS was modified, which can promote the oxidation reaction due to the decrease in activation energy.42
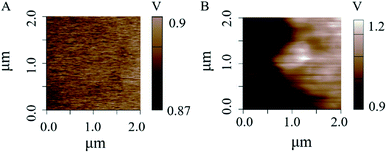 | ||
| Fig. 7 SKPM image of the GCE surfaces. (A) Surface potential of GCE. (B) Surface potential of g-C3N4 NS/GCE. | ||
In addition, we also calculated the electrode surface area after g-C3N4 NS modified. To calculated the electrochemically active surface areas, the CV of K3Fe(CN)6/K4Fe(CN)6 was analyzed by the Randles–Sevcik equation (eqn (1)):43–45
| Ip = (2.69 × 10⁵)n3/2AC*D1/2ν1/2 | (1) |
3.5 Sensor specificity and real samples test
To evaluate the selectivity of the fabricated biosensor, several kinds of interference biomarkers were selected, including C-reaction protein (CRP), Interleukin-6 (IL-6). CRP is a biomarker of inflammation for the tissue damage and the IL-6 is related to multiple diseases such as diabetes osteoarthrosis, asthma and inflammatory bowel disease.48 The concentration of PCT was 1 pg mL−1, and the concentration of each interference biomarker was 10 fg mL−1. Fig. 7 shows the DPV value for the samples spiked with each interference biomarker, PCT and the mixture with or without PCT individually. As shown in Fig. 8, the DPV value for each interference biomarker was very weak and similar to that of the control sample, however, the DPV value response of this sensor for the mixture of the PCT and each interference biomarker was same with that of PCT, this result demonstrate that the interference biomarker has no effect on the detection of the PCT, and inferred that the electrochemical sensor has highly specificity and selectivity.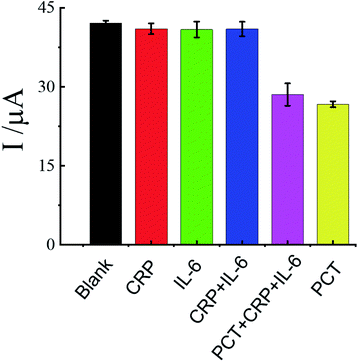 | ||
| Fig. 8 The specificity and selectivity of the PP/g-C3N4 NS/GCE biosensor. The data are shown as the mean ± SD (n = 3). | ||
To evaluate the practical application of PP/g-C3N4 NS electrochemical biosensors in blood sample, the concentration of PCT in human blood serum sample was analysed. Through the linear relationship established for the PP/g-C3N4/CGE PCT sensor, the recovery of the spiked PCT (1 fg mL−1, 5 fg mL−1, 10 fg mL−1) range from 94 to 101.3% (in Table 1), indicating that the immune sensor based on PP/g-C3N4 NS/CGE had great potential for the analysis of PCT in real clinical samples.
4 Conclusions
A novel and sample electrochemical biosensor based on PP/g-C3N4 NS/GCE was developed and successfully used to detect the PCT. The larger surface area and lower active energy after g-C3N4 NS modified giving the electrochemical biosensor higher sensing capability. XPS, FT-IT, XRD were used to identified the structure and function groups of the g-C3N4 NS. AFM, CV, DPV and EIS measurements were used to identified the modification steps and the electrochemical performance. After that, a linear current response of PCT in the concentration range of 0.15 fg mL−1 to 11.7 fg mL−1 (R2 = 0.99) and the LOD of 0.11 fg mL−1 (S/N = 3) could be obtained. This sensitivity of our system was found to be comparable to that existing detection methods. Furthermore, PP/g-C3N4 NS/GCE produce good selectivity and better recovery in the real clinic samples. Those results indicated that the PCT biosensor designed by this work has the potential to solve the clinical rapid diagnosis and treatment of sepsis diseases worldwide.Author contributions
Yushuag Liu: conceptualization, data curation, formal analysis, investigation, supervision writing. Furong Chen: resources. Layue Bao: resources. Wenfeng Hai: writing – Review.Conflicts of interest
There are no conflicts to declare.Acknowledgements
We thank funding support from the National Natural Science Foundation of China (22104066 and 22164016), Inner Mongolia Natural Science Foundation (2020BS08007, 2020BS02007). Supported by grants from PhD Start-up Fund of Inner Mongolia Minzu University (BS515, BS453).Notes and references
- G. Sener, E. Ozgur, A. Y. Rad, L. Uzun, R. Say and A. Denizli, Rapid real-time detection of procalcitonin using a microcontact imprinted surface plasmon resonance biosensor, Analyst, 2013, 138(21), 6422–6428 RSC.
- N. Fabri-Faja, O. Calvo-Lozano, P. Dey, R. A. Terborg, M. C. Estevez, A. Belushkin, F. Yesilköy, L. Duempelmann, H. Altug, V. Pruneri and L. M. Lechuga, Early sepsis diagnosis via protein and miRNA biomarkers using a novel point-of-care photonic biosensor, Anal. Chim. Acta, 2019, 1077, 232–242 CrossRef CAS.
- K. Essandoh and G.-C. Fan, Role of extracellular and intracellular microRNAs in sepsis, Biochim. Biophys. Acta, Mol. Basis Dis., 2014, 1842(11), 2155–2162 CrossRef CAS PubMed.
- C. Russell, A. C. Ward, V. Vezza, P. Hoskisson, D. Alcorn, D. P. Steenson and D. K. Corrigan, Development of a needle shaped microelectrode for electrochemical detection of the sepsis biomarker interleukin-6 (IL-6) in real time, Biosens. Bioelectron., 2019, 126, 806–814 CrossRef CAS.
- B. Pejcic, R. De Marco and G. Parkinson, The role of biosensors in the detection of emerging infectious diseases, Analyst, 2006, 131(10), 1079–1090 RSC.
- T. J. Durkin, B. Barua and S. Savagatrup, Rapid Detection of Sepsis: Recent Advances in Biomarker Sensing Platforms, ACS Omega, 2021, 6(47), 31390–31395 CrossRef CAS.
- C. Pierrakos, D. Velissaris, M. Bisdorff, J. C. Marshall and J.-L. Vincent, Biomarkers of sepsis: time for a reappraisal, Crit. Care, 2020, 24(1), 287 CrossRef.
- H. El Haddad, A.-M. Chaftari, R. Hachem, P. Chaftari and I. I. Raad, Biomarkers of Sepsis and Bloodstream Infections: The Role of Procalcitonin and Proadrenomedullin With Emphasis in Patients With Cancer, Clin. Infect. Dis., 2018, 67(6), 971–977 CrossRef CAS.
- H. Medetalibeyoglu, M. Beytur, O. Akyıldırım, N. Atar and M. L. Yola, Validated electrochemical immunosensor for ultra-sensitive procalcitonin detection: carbon electrode modified with gold nanoparticles functionalized sulfur doped MXene as sensor platform and carboxylated graphitic carbon nitride as signal amplification, Sens. Actuators, B, 2020, 319, 128195 CrossRef CAS.
- C. Pierrakos and J.-L. Vincent, Sepsis biomarkers: a review, Crit. Care, 2010, 14(1), 1–18 CrossRef PubMed.
- N. G. Morgenthaler, J. Struck, Y. Chancerelle, W. Weglöhner, D. Agay, C. Bohuon, V. Suarez-Domenech, A. Bergmann and B. Müller, Production of procalcitonin (PCT) in non-thyroidal tissue after LPS injection, Horm. Metab. Res., 2003, 35(5), 290–295 CrossRef CAS PubMed.
- W.-J. Shen, Y. Zhuo, Y.-Q. Chai, Z.-H. Yang, J. Han and R. Yuan, Enzyme-Free Electrochemical Immunosensor Based on Host–Guest Nanonets Catalyzing Amplification for Procalcitonin Detection, ACS Appl. Mater. Interfaces, 2015, 7(7), 4127–4134 CrossRef CAS.
- N. Mancini, R. Burioni, M. Clementi, Microbiological Diagnosis of Sepsis: the Confounding Effects of a “Gold Standard”, in Sepsis: Diagnostic Methods and Protocols, ed. N. Mancini, Springer New York, New York, NY, 2015, pp. 1–4 Search PubMed.
- J. AlvArez, J. Mar, E. Varela-Ledo, M. Garea, L. Matinez-lamas, J. Rodriguez and B. Regueiro, Cost analysis of real-time polymerase chain reaction microbiological diagnosis in patients with septic shock, Anaesth. Intensive Care, 2012, 40, 958–963 CrossRef CAS PubMed.
- A. M. Caliendo, D. N. Gilbert, C. C. Ginocchio, K. E. Hanson, L. May, T. C. Quinn, F. C. Tenover, D. Alland, A. J. Blaschke, R. A. Bonomo, K. C. Carroll, M. J. Ferraro, L. R. Hirschhorn, W. P. Joseph, T. Karchmer, A. T. MacIntyre, L. B. Reller, A. F. Jackson and America f. t. I. D. S. o., Better Tests, Better Care: Improved Diagnostics for Infectious Diseases, Clin. Infect. Dis., 2013, 57(suppl. 3), S139–S170 CrossRef PubMed.
- N. G. Morgenthaler, J. Struck, C. Fischer-Schulz and A. Bergmann, Sensitive immunoluminometric assay for the detection of procalcitonin, Clin. Chem., 2002, 48(5), 788–790 CrossRef CAS.
- G. Li, Y. Wu, Y. Li, Y. Hong, X. Zhao, P. I. Reyes and Y. Lu, Early stage detection of Staphylococcus epidermidis biofilm formation using MgZnO dual-gate TFT biosensor, Biosens. Bioelectron., 2020, 151, 111993 CrossRef CAS PubMed.
- H. Yin, M. Wang, B. Li, Z. Yang, Y. Zhou and S. Ai, A sensitive electrochemical biosensor for detection of protein kinase A activity and inhibitors based on Phos-tag and enzymatic signal amplification, Biosens. Bioelectron., 2015, 63, 26–32 CrossRef CAS.
- M. La, Electrochemical, Electrochemiluminescent and Photoelectrochemical Immunosensors for Procalcitonin Detection: A Review, Int. J. Electrochem. Sci., 2020, 15, 6436–6447 CrossRef CAS.
- A. R. Correia, I. Sampaio, E. J. Comparetti, N. C. S. Vieira and V. Zucolotto, Optimized PAH/Folic acid layer-by-layer films as an electrochemical biosensor for the detection of folate receptors, Bioelectrochemistry, 2021, 137, 107685 CrossRef CAS PubMed.
- Y. Liu, H. Li, S. Gong, Y. Chen, R. Xie, Q. Wu, J. Tao, F. Meng and Z. Peng, A novel non-enzymatic electrochemical biosensor based on the nanohybrid of bimetallic PdCu nanoparticles/carbon black for highly sensitive detection of H2O2 released from living cells, Sens. Actuators, B, 2019, 290, 249–257 CrossRef CAS.
- K. Atacan and M. Özacar, Construction of a non-enzymatic electrochemical sensor based on CuO/g-C3N4 composite for selective detection of hydrogen peroxide, Mater. Chem. Phys., 2021, 266, 124527 CrossRef CAS.
- K. Dhara and D. R. Mahapatra, Recent advances in electrochemical nonenzymatic hydrogen peroxide sensors based on nanomaterials: a review, J. Mater. Sci., 2019, 54(19), 12319–12357 CrossRef CAS.
- G. Liao, F. He, Q. Li, L. Zhong, R. Zhao, H. Che, H. Gao and B. Fang, Emerging graphitic carbon nitride-based materials for biomedical applications, Prog. Mater. Sci., 2020, 112, 100666 CrossRef CAS.
- J. Zhu, W. Nie, Q. Wang, J. Li, H. Li, W. Wen, T. Bao, H. Xiong, X. Zhang and S. Wang, In situ growth of copper oxide-graphite carbon nitride nanocomposites with peroxidase-mimicking activity for electrocatalytic and colorimetric detection of hydrogen peroxide, Carbon, 2018, 129, 29–37 CrossRef CAS.
- X. Li, J. Zhang, L. Shen, Y. Ma, W. Lei, Q. Cui and G. Zou, Preparation and characterization of graphitic carbon nitride through pyrolysis of melamine, Appl. Phys. A, 2009, 94(2), 387–392 CrossRef CAS.
- T. Jiang, G. Jiang, Q. Huang and H. Zhou, High-sensitive detection of dopamine using graphitic carbon nitride by electrochemical method, Mater. Res. Bull., 2016, 74, 271–277 CrossRef CAS.
- Y. Cao, L. Wang, C. Wang, X. Hu, Y. Liu and G. Wang, Sensitive detection of glyphosate based on a Cu-BTC MOF/g-C3N4 nanosheet photoelectrochemical sensor, Electrochim. Acta, 2019, 317, 341–347 CrossRef CAS.
- L. F. Gao, T. Wen, J. Y. Xu, X. P. Zhai, M. Zhao, G. W. Hu, P. Chen, Q. Wang and H. L. Zhang, Iron-Doped Carbon Nitride-Type Polymers as Homogeneous Organocatalysts for Visible Light-Driven Hydrogen Evolution, ACS Appl. Mater. Interfaces, 2016, 8(1), 617–624 CrossRef CAS.
- J. Tian, Q. Liu, C. Ge, Z. Xing, A. M. Asiri, A. O. Al-Youbi and X. Sun, Ultrathin graphitic carbon nitride nanosheets: a low-cost, green, and highly efficient electrocatalyst toward the reduction of hydrogen peroxide and its glucose biosensing application, Nanoscale, 2013, 5(19), 8921–8924 RSC.
- X. Zhang, X. Xie, H. Wang, J. Zhang, B. Pan and Y. Xie, Enhanced Photoresponsive Ultrathin Graphitic-Phase C3N4 Nanosheets for Bioimaging, J. Am. Chem. Soc., 2013, 135(1), 18–21 CrossRef CAS PubMed.
- P. Niu, L. Zhang, G. Liu and H. M. Cheng, Graphene-like carbon nitride nanosheets for improved photocatalytic activities, Adv. Funct. Mater., 2012, 22(22), 4763–4770 CrossRef CAS.
- J. Tian, Q. Liu, A. M. Asiri, A. H. Qusti, A. O. Al-Youbi and X. Sun, Ultrathin graphitic carbon nitride nanosheets: a novel peroxidase mimetic, Fe doping-mediated catalytic performance enhancement and application to rapid, highly sensitive optical detection of glucose, Nanoscale, 2013, 5(23), 11604–11609 RSC.
- J. M. Lim, M. Y. Ryu, J. H. Kim, C. H. Cho, T. J. Park and J. P. Park, An electrochemical biosensor for detection of the sepsis-related biomarker procalcitonin, RSC Adv., 2017, 7(58), 36562–36565 RSC.
- J. Liu, S. Xie, Z. Geng, K. Huang, L. Fan, W. Zhou, L. Qiu, D. Gao, L. Ji, L. Duan, L. Lu, W. Li, S. Bai, Z. Liu, W. Chen, S. Feng and Y. Zhang, Carbon Nitride Supramolecular Hybrid Material Enabled High-Efficiency Photocatalytic Water Treatments, Nano Lett., 2016, 16(10), 6568–6575 CrossRef CAS.
- F. Yang, X. Wang, Q. Hu, D. Jiang, Y. Lu, Y. Wang, J. Wang and J. Liu, Carbon nitride initiated photopolymerization into a luminescent elastomer hydrogel, Mater. Chem. Front., 2021, 5(17), 6491–6501 RSC.
- N. Murugan, M. B. Chan-Park and A. K. Sundramoorthy, Electrochemical Detection of Uric Acid on Exfoliated Nanosheets of Graphitic-Like Carbon Nitride (g-C3N4) Based Sensor, J. Electrochem. Soc., 2019, 166(9), B3163–B3170 CrossRef CAS.
- L. Ge, Synthesis and photocatalytic performance of novel metal-free g-C3N4 photocatalysts, Mater. Lett., 2011, 65(17), 2652–2654 CrossRef CAS.
- T. Di, B. Zhu, B. Cheng and J. Yu, A direct Z-scheme g-C3N4/SnS2 photocatalyst with superior visible-light CO2 reduction performance, J. Catal., 2017, 352, 532–541 CrossRef CAS.
- A. S. Tanak, B. Jagannath, Y. Tamrakar, S. Muthukumar and S. J. A. c. a. X. Prasad, Non-faradaic electrochemical impedimetric profiling of procalcitonin and C-reactive protein as a dual marker biosensor for early sepsis detection, Anal. Chim. Acta: X, 2019, 3, 100029 CAS.
- X. Tian, C. Cheng, H. Yuan, J. Du, D. Xiao, S. Xie and M. M. Choi, Simultaneous determination of L-ascorbic acid, dopamine and uric acid with gold nanoparticles-β-cyclodextrin-graphene-modified electrode by square wave voltammetry, Talanta, 2012, 93, 79–85 CrossRef CAS.
- J. O. M. Bockris and A. K. Reddy, Ion—Solvent Interactions, in Modern electrochemistry, Springer, 1970, pp. 45–174 Search PubMed.
- K. J. J. o. A. Atacan, Compounds, CuFe2O4/reduced graphene oxide nanocomposite decorated with gold nanoparticles as a new electrochemical sensor material for ʟ-cysteine detection, J. Alloys Compd., 2019, 791, 391–401 CrossRef CAS.
- N. Demir, K. Atacan, M. Ozmen and S. Z. Bas, Design of a new electrochemical sensing system based on MoS2–TiO2/reduced graphene oxide nanocomposite for the detection of paracetamol, New J. Chem., 2020, 44(27), 11759–11767 RSC.
- A. Jirjees Dhulkefl, K. Atacan, S. Z. Bas and M. Ozmen, An Ag–TiO2–reduced graphene oxide hybrid film for electrochemical detection of 8-hydroxy-2′-deoxyguanosine as an oxidative DNA damage biomarker, Anal. Methods, 2020, 12(4), 499–506 RSC.
- T. Kamata, D. Kato and O. Niwa, Electrochemical performance at sputter-deposited nanocarbon film with different surface nitrogen-containing groups, Nanoscale, 2019, 11(21), 10239–10246 RSC.
- Y. Li, J. Zhou, J. Song, X. Liang, Z. Zhang, D. Men, D. Wang and X.-E. Zhang, Chemical nature of electrochemical activation of carbon electrodes, Biosens. Bioelectron., 2019, 144, 111534 CrossRef CAS PubMed.
- J. Wu, Y. Xianyu, X. Wang, D. Hu, Z. Zhao, N. Lu, M. Xie, H. Lei and Y. Chen, Enzyme-Free Amplification Strategy for Biosensing Using Fe3+–Poly(glutamic acid) Coordination Chemistry, Anal. Chem., 2018, 90(7), 4725–4732 CrossRef CAS PubMed.
Footnote |
| † Electronic supplementary information (ESI) available. See https://doi.org/10.1039/d2ra03650a |
| This journal is © The Royal Society of Chemistry 2022 |

