 Open Access Article
An efficient and stable iodine-doped nickel hydroxide electrocatalyst for water oxidation: synthesis, electrochemical performance, and stability†
Sheraz Yousafa,
Sonia Zulfiqarb,
H. H. Somailycd,
Muhammad Farooq Warsi *a,
Aamir Rasheeda,
Muhammad Shahide and
Iqbal Ahmad
 *f
*f
aInstitute of Chemistry, The Islamia University of Bahawalpur, Baghdad-ul-Jadeed Campus, Bahawalpur-63100, Pakistan. E-mail: Farooq.warsi@iub.edu.pk
bDepartment of Chemistry, School of Sciences & Engineering, The American University in Cairo, New Cairo, 11835, Egypt
cResearch Center for Advanced Materials Science (RCAMS), King Khalid University, P.O. Box 9004, Abha 61413, Saudi Arabia
dDepartment of Physics, Faculty of Science, King Khalid University, P.O. Box 9004, Abha, Saudi Arabia
eDepartment of Chemistry, College of Science, University of Hafr Al Batin, P.O. Box 1803, Hafr Al Batin, 31991, Saudi Arabia
fDepartment of Chemistry, Allama Iqbal Open University, Islamabad, 44000, Pakistan. E-mail: Iqbal.ahmad@aiou.edu.pk
First published on 18th August 2022
Abstract
The design of oxygen evolution reaction (OER) catalysts with higher stability and activity by economical and convenient methods is considered particularly important for the energy conversion technology. Herein, a simple hydrothermal method was adopted for the synthesis of iodine-doped nickel hydroxide nanoparticles and their OER performance was explored. The electrocatalysts were structurally characterized by powder X-ray diffraction analysis (P-XRD), Fourier transform infrared spectroscopy (FTIR), field emission scanning electron microscopy (FESEM), energy dispersive X-ray spectroscopy (EDX), and BET analysis. The electrochemical performance of the electrocatalysts was assessed by cyclic voltammetry, linear sweep voltammetry, and electrochemical impedance spectroscopy. The abundant catalytic active sites, oxygen vacancies, low charge-transfer resistance, and a high pore diameter to pore size ratio of iodine-doped Ni(OH)2 were responsible for its excellent catalytic activity, whereby OER was initiated even at 1.52 V (vs. RHE) and a 330 mV overpotential was needed to reach a 40 mV cm−2 current density in 1 M KOH solution. The material also exhibited a low Tafel slope (46 mV dec−1), which suggests faster charge-transfer kinetics as compared to its counterparts tested under the same electrochemical environment. It is worth noting that this facile and effective approach suggests a new way for the fabrication of metal hydroxides rich in oxygen vacancies, thus with the potential to boost the electrochemical performance of energy-related systems.
1 Introduction
The overdependence of people on fossil fuels is causing serious environmental problems. Therefore, it is an urgent need to find sustainable and clean energy sources.1 Among these, hydrogen (H2), due to its high combustion value and zero percent environmental pollution, is an ideal source of clean renewable energy.2,3 Mostly, hydrogen is produced at the industrial level by the stream cracking method, which consumes a huge amount of fossil fuels and thus causes environmental pollution.4 Among all the reported methods, the production of H2 gas via the electrolysis of water is considered the simplest and most practical.5,6 This approach produces H2 gas at its maximum purity.7 The water-splitting techniques include the oxygen evolution reaction (OER) and the hydrogen evolution reaction (HER). However, the OER discourages the water-splitting process owing to its sluggish OER kinetics and high overpotential requirements for accelerating the reaction.8 Therefore, there is an essential need to design electrocatalysts that can accelerate the kinetics and reduce the required activation energy for the OER, thus improving the proficiency of the water-splitting reaction.9To date, iridium- and ruthenium-based materials are considered the most active electrocatalysts for OER processes.10 However, the scarcity, higher cost, and instability of these precious metal-based oxides impede their applications in commercial-scale applications. Therefore, it is highly desirable to design a low cost, easily available, stable, and highly active precious-metal-free electrocatalyst for the OER. In this regard, a lot of researchers have developed earth-abundant electrocatalysts, such as transition metal oxides,11 their hydroxides,12 layered double hydroxides13 and carbon-based nanomaterials.14 Among these substitutes, transition metal oxides (and hydroxides), owing to their excellent catalytic properties, have been attracting incredible research interest in the last few years.15
Particularly, the cobalt-based alternatives have been developed and are considered as excellent electrocatalysts due to their remarkable performance.16 However, Ni-based electrocatalysts exhibit lower OER performance than those of Co-based electrocatalysts. On the other hand, they are cheaper, possess greater water oxidation potential, and have abundant reserves.17 Akbari et al. studied the OER activity of Ni/NiO material under alkaline conditions using ferrite ions as an impurity.18 Hand et al. synthesized nickel boride hydroxide-based nanoparticles by a chemical method. The material required an overpotential of 340 mV to deliver a 10 mA cm−2 current density under alkaline conditions.19 Similarly, Liu et al. developed a sheet-like Ni(OH)2 nanomaterial by a hydrothermal method. The material required 308 mV overpotential to yield 10 mA cm−2 current density.20 Kim et al. designed a β-Ni(OH)2 nanoplate-like electrocatalyst for OER applications. The β-Ni(OH)2 prepared under a hydrogen atmosphere and atmospheric air required 340 and 369 mV overpotentials to achieve a 10 mA cm−2 current density under alkaline conditions.21 Therefore, from commercialization point of view, the performance of Ni-based electrocatalysts needs to be significantly improved.
Nickel hydroxide has advantages over other Ni-based electrocatalysts, such as NiO, NiCoOx, and NiFeOx, due to its polymorph structure with several disorders that act as active sites for electrochemical processes. These structural disorders include stacking faults-type crystal defects, variable hydration, and the effective incorporation of foreign ions.22 β-Ni(OH)2 is its fully hydrated polymorph form and hydrated water molecules are weakly associated with Ni cations and are unable to form hydrogen bonds with lattice hydroxides.23 This in turn enhances the water reservoir associated with the conducting centers and hence enhances the electrochemical water-splitting process. Moreover, the strong ionic bonds between Ni2+, O2−, and H+ within each layer result in weak interaction among the adjacent layers. Therefore, it contains several stacked layers and will result in the effective incorporation of foreign species.24
Various strategies have been adopted to improve the electrocatalytic activity of materials based on earth-abundant nickel, including doping with metallic or non-metallic ions, creating binary or ternary composites, forming a hybrid with other conducting materials.25,26 The addition of foreign non-metal heteroatoms or their anions to improve the OER activity of Ni-based catalysts can have a considerable effect. The doping with halogens is another important strategy to boost the electrocatalytic performance of materials. The electron-acceptor nature of halogen atoms is most important in enhancing the conductivity of materials.27 Rich oxygen vacancies and lattice defects were introduced in β-FeOOH by means of doping with fluorine. The F-doped samples demonstrated a higher electrochemical active surface area (ECSA) and OER activity.28 Similarly, Hussain et al. synthesized ‘F’-doped Ni(OH)2 nanoparticles for water-splitting applications. A lower overpotential of 325 mV was required for achieving a current density of 10 mA cm−2.29 Furthermore, the incorporation of both cationic and anionic species was possible at lattice points or within the interlayer region. However, the anionic species were located at the lattice hydroxide sites or in between the interlayer region.22
Among all the halogen atoms, iodine is the most popular as its doping causes fundamental changes in the molecular orientation and stacking, which can change the electrochemical properties of a material.30 Moreover, the larger size of iodine causes an increase in the intercalation region, which increases the water reserves among them and increases the ionic mobility. Iodine-doped TiO2 was fabricated by Li and collaborators following a hydrothermal method. The material was tested for visible-light photocatalysis, and a relative increase in degradation efficiency was observed, which was attributed to the formation of oxygen vacancies by multivalent iodine in the material.31 Similarly, iodine-doped Bi2WO6 nanoplates were also synthesized by Zhang et al. following a hydrothermal approach. The material was also tested for the photocatalytic degradation of pollutants. A noticeable improvement in degradation efficiency was observed as a result of the formation of oxygen vacancies and defects in the crystal lattice due to the presence of both I0 and I− species.32 Furthermore, non-metal (N, B, and I)-doped TiO2 nanotubes were also synthesized following an anodization method. The doped samples demonstrated better efficiency, whereupon the order of the observed efficiency was B:TiO2 > I:TiO2 > N:TiO2 > pure TiO2. The significant increase in efficiency was attributed to the formation of lattice defects, and changes in the orientation of the electronic cloud and oxygen vacancies. Additionally, the designed materials were not only suggested as suitable for water splitting but also applicable for supercapacitor applications.33
Here, we report the synthesis and characterization of an iodine-doped Ni(OH)2-based electrocatalyst for OER. The synthesized I-doped nickel hydroxide electrocatalyst required an overpotential of 330 mV for OER to attain a 40 mA cm−2 current density using 1 M KOH solution, which showed it could outperform its counterparts under identical electrochemical tests. The results demonstrate that the efficiency of the catalyst was significantly superior and offers prospects in the fabrication of non-metal-doped materials as an effective electrocatalyst for energy-related applications.
2 Results and discussion
2.1 Structural analysis
The crystalline nature assessment and structural phase analysis of the synthesized electrocatalysts were analyzed by X-ray diffraction analysis. The XRD patterns of the pure Ni(OH)2, I-doped Ni(OH)2, and I2-loaded Ni(OH)2 are presented in Fig. 1(a). The diffraction pattern of pure nickel hydroxides showed the diffraction peaks at 2θ values of 19.08°, 32.80°, 38.28°, 51.93°, 58.71°, 62.39°, 69.24°, 70.11°, 72.44° corresponding to (001), (199), (101), (102), (110), (111), (200), (103), and (201) planes, respectively. The diffraction profile was characteristic of the pure hexagonal phase of Ni(OH)2 and was in agreement with the JCPD number 01-074-2075. Moreover, the formation of new crystalline orientations in the case of both I-doped Ni(OH)2 and I2-loaded Ni(OH)2 were not observed. However, Fig. 1(b) shows the shift of the diffraction peak index for (001) toward lower 2θ values with the increase in peak broadening in the case of I-doped Ni(OH)2 and I2-loaded Ni(OH)2 compared to their pristine nickel hydroxide. This suggested the successful doping of iodine anions in Ni(OH)2.34,35 Furthermore, the unit cell parameters of Ni(OH)2, I-doped Ni(OH)2, and I2-loaded Ni(OH)2 electrocatalysts were calculated using unit cell software and the results are presented in Table 1. Increases in both the unit cell constants and volume were observed, suggesting the doping of iodine in the Ni(OH)2 crystal lattice.36 The crystallite size was also calculated by the modified Scherrer equation and the results are presented in Table 1. A graph was plotted between vs. ln
![[thin space (1/6-em)]](https://www.rsc.org/images/entities/char_2009.gif) β and is shown in Fig. S1.† The crystallite sizes of Ni(OH)2, I-doped Ni(OH)2, and I2-loaded Ni(OH)2 were 28, 22, and 26 nm, respectively. A decrease in the crystalline size upon the addition of iodine components to the matrix was observed. This decrease in crystallite size was due to the inhibition of the crystallite growth upon the addition of iodine. The crystallite growth was suppressed due to the increment in the energy barrier for the mutual diffusion of grains with a distinct size and orientation caused by the adsorbed iodine species in the presence of KI. Therefore, it could be concluded that the iodine ions were doped in the Ni(OH)2 and occupied the apical sites or surface defect sites of the material.37,38
β and is shown in Fig. S1.† The crystallite sizes of Ni(OH)2, I-doped Ni(OH)2, and I2-loaded Ni(OH)2 were 28, 22, and 26 nm, respectively. A decrease in the crystalline size upon the addition of iodine components to the matrix was observed. This decrease in crystallite size was due to the inhibition of the crystallite growth upon the addition of iodine. The crystallite growth was suppressed due to the increment in the energy barrier for the mutual diffusion of grains with a distinct size and orientation caused by the adsorbed iodine species in the presence of KI. Therefore, it could be concluded that the iodine ions were doped in the Ni(OH)2 and occupied the apical sites or surface defect sites of the material.37,38
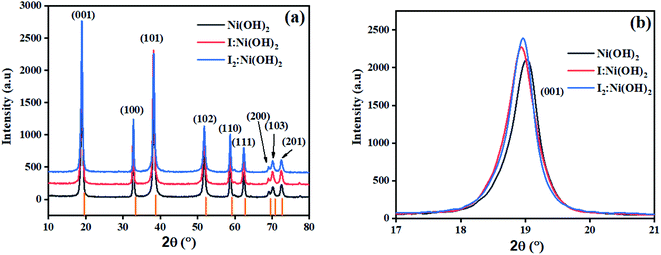 | ||
| Fig. 1 (a) XRD patterns of Ni(OH)2, I-doped Ni(OH)2, and I2-loaded Ni(OH)2 electrocatalysts, and (b) the (001) peak shift and broadening in I-doped Ni(OH)2 and I2-loaded Ni(OH)2 electrocatalysts. | ||
| S. no. | Material | Crystal system | Cell constants (Å) | Volume (Å)3 | Crystallite size (nm) | |
|---|---|---|---|---|---|---|
| a | c | |||||
| 1 | Ni(OH)2 | Hexagonal | 3.13 | 4.62 | 39.42 | 28 |
| 2 | I:Ni(OH)2 | Hexagonal | 3.14 | 4.63 | 39.64 | 22 |
| 3 | I2:Ni(OH)2 | Hexagonal | 3.14 | 4.62 | 39.49 | 26 |
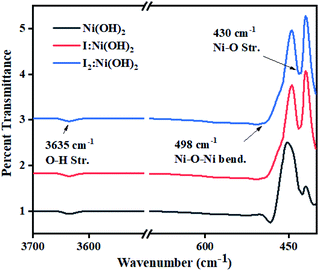
Surface functional groups analysis was carried out by FTIR spectroscopy. The FTIR spectra of nickel hydroxide, I-doped nickel hydroxide, and I2 loaded nickel electrocatalysts are displayed in Fig. 2. The sharp band around 3635 cm−1 corresponded to O–H stretching vibrations of the non-hydrogen bonded hydroxyl group in all the prepared samples.39 The sharp iR band around 498 cm−1 corresponded to Ni–O–Ni bending vibrations, whereas the band around 430 cm−1 was considered due to Ni–O stretching vibrations.40 No extra absorption band was observed in the iodine-doped and -loaded Ni(OH)2 electrocatalysts. However, the relative shift of the bands corresponded to a wider range of interactions among the functional groups and these are presented in Table S1.† The narrowing and broadening of absorption bands in the I-doped Ni(OH)2 and I2-loaded Ni(OH)2 electrocatalysts was attributed to the incorporation of a dopant to the apical or surface defect sites of the material.41
As the electrocatalytic activity of the materials was linked to their surface morphology, FESEM analysis was performed to analyze the surface morphology. The FESEM images of the nickel hydroxide, I-doped nickel hydroxide, and I2-loaded hydroxide electrocatalysts are presented in Fig. 3. It was found that Ni(OH)2 was a bouquet-like material composed of circular and spherical units distributed randomly. However, the random distribution of these units for both I-doped Ni(OH)2 and I2-loaded Ni(OH)2 electrocatalysts was comparably higher with apparently smaller size. Consequently, the distribution in the case of the doped and loaded samples was increased because of the increase in the energy barrier for the mutual diffusion of grains induced by the adsorbed iodine species in the presence of KI. This apparent morphology with random distribution of units was responsible for the larger interconnected porous cavities. These porous cavities were then responsible for electrolyte reservoirs, which in turn resulted in the enhanced electrocatalytic activity.5
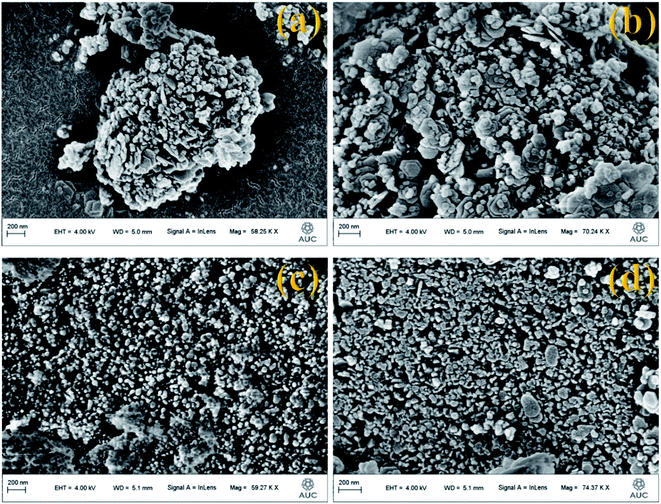 | ||
| Fig. 3 FESEM images of (a and b) pure Ni(OH)2, (c) I-doped Ni(OH)2, and (d) I2-loaded Ni(OH)2 electrocatalysts. | ||
The electrochemical performance for the OER is also related to a material's surface area. Here, adsorption–desorption studies were performed using N2 gas as an adsorbate on the surface of the catalysts. The resultant BET isotherm is presented in the inset of Fig. S2,† which shows a type IV isotherm with an H3 form of hysteresis loops, indicating the microporous and mesoporous characteristics of the material. The experimental calculated BET surface areas of the Ni(OH)2, I-doped Ni(OH)2, and I2-loaded Ni(OH)2 electrocatalysts were 36.0, 35.86, and 28.96 m2 g−1. This decrease in surface area was again due to the increase in the energy barrier as a result of the iodine species. Fig. S2† shows bar-graphs of the pore diameter and area. It was found that with the increase in pore diameter, the pore area also increased. However, the increase in pore area as a function of pore diameter was greater for I-doped Ni(OH)2, which thus had greater porous cavities, thus providing a greater reservoir for electrolyte species, thus resulting in an increase in the OER activity.
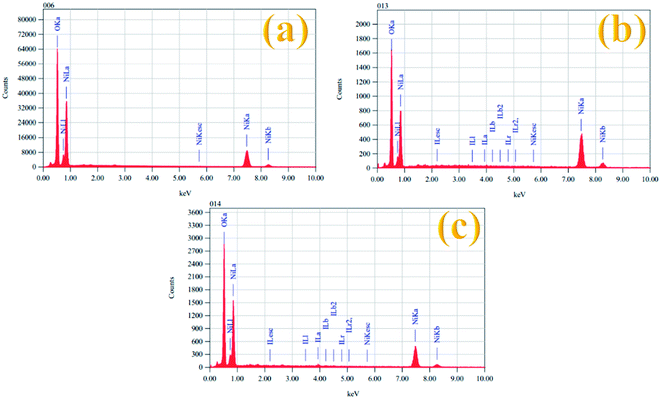
The elemental composition of all the prepared electrocatalysts was also examined by EDX spectroscopy and the results are given in Table 2. Fig. 4 shows the EDX spectra of the Ni(OH)2, I-doped Ni(OH)2, and I2-loaded Ni(OH)2 electrocatalysts. The EDX measurements confirmed the existence of both Ni and O elements in all the synthesized electrocatalysts. However, the presence of iodine could also be recognized in the EDX measurements of the I-doped Ni(OH)2 and I2-loaded Ni(OH)2 electrocatalysts.34
| S. no. | Sample | Nickel | Oxygen | Iodine |
|---|---|---|---|---|
| 1 | Ni(OH)2 | 59.57 | 40.43 | — |
| 2 | I-doped Ni(OH)2 | 75.42 | 24.54 | 0.04 |
| 3 | I2-loaded Ni(OH)2 | 61.65 | 35.06 | 3.93 |
2.2 Preliminary electrochemical investigations
The initial electrochemical characterizations were performed before testing the OER activity of the electrocatalysts. For this, the accessibility of the potential active sites, the active surface area of the electrocatalysts, and their stability before the OER performance evaluation were considered following standard electrochemical methods.42,43 Cyclic voltammetry (CV) measurements were performed and the results are shown in Fig. S3.† The CV measurements of the bare carbon fiber cloth (CFC) exhibited no redox reactions. However, broad redox peaks were prominent in the case of Ni(OH)2, I-doped Ni(OH)2, and I2-loaded Ni(OH)2 electrocatalysts. These apparent redox peaks were due to Ni2+/Ni3+ formation, which was responsible for the promising electrochemical activity.44 The electrocatalyst's aging, stability, and activity were investigated by means of measuring consecutive 200 CV cycles at a 100 mV s−1 scan rate. It was noted that the shape of the voltammogram changed slightly from the first cycle to the 200th one. However, the current density remained unaffected and did not change drastically. No more extra peaks appeared during the concurrent 200 cycles. These results revealed that the electrodes had attained their highest stability and could be subjected to OER analysis.Furthermore, the loss in catalytically active sites and their degradation were tested by finding the charge (q*) associated with these different cycles. Fig. 5(a) shows that the charge under the CV loop remained almost constant with the increase in the number of cycles. This constant charge under the CV loop suggests that the catalytic behavior of the electrocatalyst was stable and consistent. Fig. 5(b) shows the plot for  vs. cycle number. As the charges have a direct relation with the electroactive sites, accordingly, the fraction
  demonstrates the activity of the electrocatalyst throughout the stability test. The active sites were found to be stable and remained uniform within 200 concurrent cycles. Therefore, it is proposed that the catalysts were stable with no significant loss or degradation of their active sites.
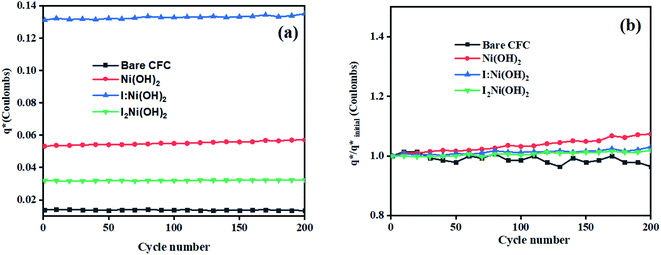 | ||
Fig. 5 Electrochemical characterization: (a) charge (q*) evaluation and (b)  fractions throughout the stability tests. fractions throughout the stability tests. | ||
The electrochemically active surface area (ECSA) of the Ni(OH)2, I-doped Ni(OH)2, and I2-loaded Ni(OH)2 electrocatalysts was also calculated in terms of the double-layer capacitance using a CV approach. As the ECSA is related to the electroactive sites of the electrocatalysts between the solid–liquid interphase, therefore, its measurements is critical to evaluate the catalyst performance. Fig. S4† represents the CV of bare CFC, pure Ni(OH)2, I-doped Ni(OH)2, and I2-loaded Ni(OH)2 electrocatalysts in the non-faradaic region, where the current was supposed to involve an electrical double-layer charging current. The graph between the scan rate vs. current density (Fig. 6) displayed a straight line and the slope of this linear graph was considered to be Cdl. The corresponding ECSA was calculated by dividing Cdl with the specific capacitance (0.040 cm−2).45 A relatively higher ECSA was found in the case of I-doped Ni(OH)2 than pristine Ni(OH)2 and I2-loaded Ni(OH)2 electrocatalysts, as tabulated in Table 3. This high ECSA revealed the greater electrochemical surface area with greater exposed active sites, which in return was responsible for the superior electrocatalytic performance.
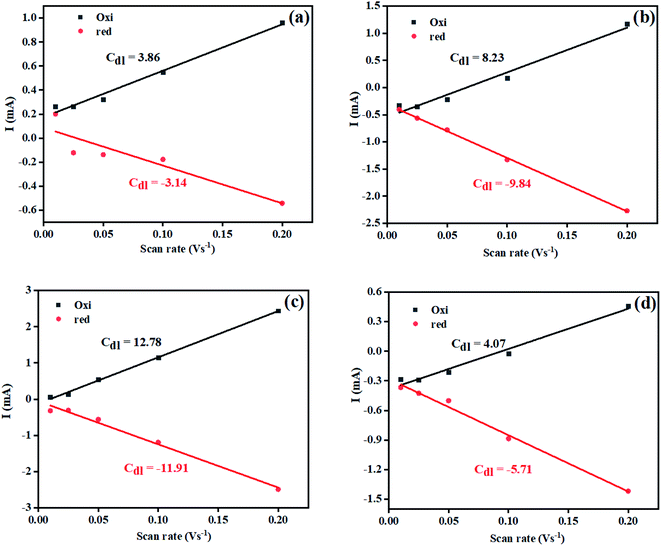 | ||
| Fig. 6 Plot for calculation of the electrochemical active surface area for (a) bare CFC, (b) Ni(OH)2, (c) I-doped Ni(OH)2, and (d) I2-loaded Ni(OH)2 electrocatalysts. | ||
| S. no. | Material | Average CdL (cm−2) | ECSA (cm2) | Onset potential (V vs. RHE) | Overpotential (V) | Tafel slope (mV dec−1) | Rct (Ω) | Surface concentration of atoms (×1016) | Exchange current density (mA cm−2) | |||
|---|---|---|---|---|---|---|---|---|---|---|---|---|
| η40 | η100 | η350 | Lower OP | Higher OP | ||||||||
| a This suggests that I:Ni(OH)2 had a greater OER efficiency than Ni(OH)2. | ||||||||||||
| 1 | Ni(OH)2 | 9.04 | 226.04 | 1.53 | 440 | 680 | — | 66 | 268 | 8.8 | 2.52 | 0.7 |
| 2 | I:Ni(OH)2 | 12.34 | 308.72 | 1.52 | 330 | 390 | 630 | 46 | 104 | 2.3 | 15.94 | 2.79 |
| 3 | I2:Ni(OH)2 | 4.89 | 122.35 | 1.62 | 720 | — | — | 60 | 275 | 4.0 | 4.27 | 1.60 |
The electrochemical accessibility is another parameter to judge the performance of an electrocatalyst. For this, the integrated charge under the reduction peak of the cyclic voltammograms taken at a 20 mV s−1 scan rate was considered. Further, it was considered that a single oxygen atom was chemisorbed on one nickel atom. Therefore, the charge under the reduction peak was linked to the redox couple Ni2+/Ni3+ and is given in Table 3. A higher value of the integrated area was found for I-doped Ni(OH)2 electrocatalyst. Furthermore, the surface concentration of atoms was also calculated using the area under the reduction curve, again for I-doped Ni(OH)2.46 Conclusively, the measurements performed in the preliminary examinations suggested that the I-doped Ni(OH)2 electrocatalyst had significant electrochemical stability, a high ECSA, and greater electroactive sites exposed to the surface of the prepared electrode. These results are key factors for enhancing the OER response of iodine-doped nickel hydroxide electrocatalysts.
Investigations into the electrical features and oxygen vacancies were done by the Mott–Schottky approach. This approach is considered an excellent tool to understand the electrical properties across the electrolyte–semiconductor interface.47 Huang et al. analyzed the Mott–Schottky plots of WO and OVs rich WO3−x and WO3.48 They noted a relative increase in the carrier density as a result of the OVs. Similarly, in order to confirm the OVs in iodine-doped Ni(OH)2, Mott–Schottky analysis was also performed and the results are shown in Fig. S6.† The flat-band potential of Ni(OH)2 was 0.03 and that of I-Ni(OH)2 was −0.064 V. However, the Mott–Schottky plot of Ni(OH)2 displayed a negative slope and behaved like a p-type material. Whereas, the Mott–Schottky plot of I-Ni(OH)2 exhibited a positive slope and transformed to an n-type semiconductor material. This transformation of material from p-type to n-type was attributed to the iodine doping, which created OVs as a result of the iodine doping. Moreover, the charge-carrier density of iodine-doped nickel hydroxide was greater than that of pure nickel hydroxide, which again suggested the formation of OVs in the material. The Mott–Schottky results are tabulated in Table S1.† This improvement in carrier density in iodine-doped Ni(OH)2 was attributed to the oxygen vacancies, which in turn acted as electron donors.49
2.3 OER activity
Owing to the exclusive structural and electrochemical redox competences, the electrochemical water oxidation-related performances of the pure Ni(OH)2, I-doped Ni(OH)2, and I2-doped Ni(OH)2 electrocatalysts were investigated using 1 M aqueous KOH solution. The anodic polarization measurements were performed by linear sweep voltammetry at a 5 mV s−1 scan rate with iR compensation, and the results are shown in Fig. 7(a). The Ni/Ni(OH)2 oxidation peak appeared in the LSV of all the electrocatalysts. The oxidation peak started from 1.36 V to 1.48 V (vs. RHE). The onset potentials were found to be 1.53, 1.52, and 1.62 V (vs. RHE) for the Ni(OH)2, I-doped Ni(OH)2, and I2-loaded Ni(OH)2 electrocatalysts, respectively. After this potential regime, the current density increased sharply, which originated from the contribution of the catalytic current generated as a result of the water oxidation reaction. We were not able to report the overpotential at 10 mA cm−2 (η10) current density due to the presence of an oxidation peak in that region. Therefore, the overpotentials for all the electrocatalysts were reported at 40 mA cm−2 (η40). The values of the overpotential at the 40 mA cm−2 current density were 440, 330, and 720 mV for the pure Ni(OH)2, I-doped Ni(OH)2, and I2-loaded Ni(OH)2 electrocatalysts respectively. The increase in current density was very sharp in the case of I-doped Ni(OH)2. At an overpotential of 390 mV, the current density was 100 mA cm−2 and at 630 mV, it was 350 mA cm−2. However, at an overpotential of 630 mV, the Ni(OH)2 electrocatalyst reached a current density of 144 mA cm−2.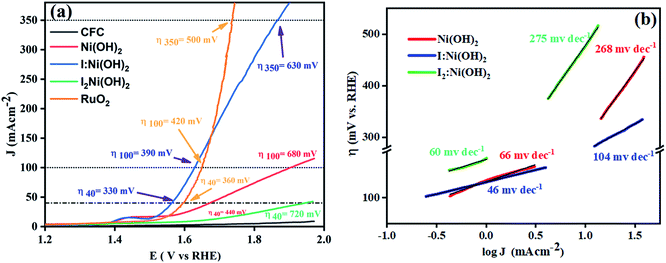 | ||
| Fig. 7 OER electrocatalysis results: (a) LSV curve of the electrocatalysts taken at 5 mV s−1 and (b) corresponding Tafel plots in the low and high overpotential regions. | ||
Additionally, the OER kinetics of the electrocatalysts was explored by constructing Tafel plots both in the lower and higher potential regions, as shown in Fig. 7(b).50 At lower overpotential, the Tafel slopes for the Ni(OH)2, I:Ni(OH)2, and I2:Ni(OH)2 electrocatalysts were 66, 46, and 60 mV dec−1, respectively. The Tafel slop of I:Ni(OH)2 was lesser than that of the pure Ni(OH)2 and I2:Ni(OH)2 electrocatalysts, which suggests the faster OER kinetics of the I:Ni(OH)2 electrocatalyst. The Tafel slope for the I:Ni(OH)2 electrocatalyst was nearly close to the value of 40 mV dec−1 that is characteristic for a single-electron electrochemical step as the rate-determining step.51 However, at a higher overpotential, larger values of the Tafel slops were found, as given in Table 3, suggesting a greater polarization with the higher current density. Similarly, a lower Tafel slope suggests efficient electrocatalytic activity. At a higher overpotential, the I:Ni(OH)2 electrocatalyst exhibited a Tafel slope of 104 mV dec−1, which was nearly half that of the Ni(OH)2 and I2:Ni(OH)2 electrocatalysts.
The changes in the Tafel slope from lower overpotential to higher overpotential were considered to be due to the change in the rate-determining step (RDS) or variations in the adsorption of intermediates resulting from the potential variations or the reduction in the electrode's effective surface area with the increasing gas evolution.52 As the Tafel slope is inversely related with the charge-transfer coefficient, which is an experimental quantity, the greater the Tafel slope, the lower the charge-transfer coefficient and vice versa.53 By considering the relation between the charge-transfer coefficient and Tafel slope, it was confirmed that I:Ni(OH)2 exhibited better OER activity than the Ni(OH)2 and I2:Ni(OH)2 electrocatalysts.
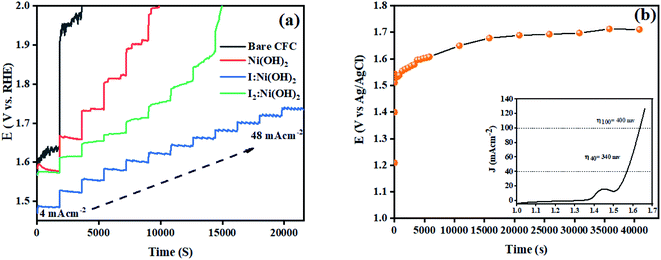
The stability of a catalyst is another important parameter for its potential applications. In this regard, multistep chronopotentiometry measurements without iR compensation were considered and the results are depicted in Fig. 8. The current density was increased from 4 to 48 mA cm−2 within 6 h of analysis. Among all 3 prepared electrocatalysts, I:Ni(OH)2 exhibited the most stable current and potential, thus suggesting its long-term stability. An analogous trend was experienced during all the measured steps till it achieved a current density of 48 mA cm−2.46 These features demonstrated the steadiness of the material toward catalytic activity for OER catalysis and confirmed the relatively higher conductivity and superficial charge-transfer process on the exposed surface of the prepared electrode.54 However, the multistep chronopotentiometry measurements of the nickel hydroxide and I2-loaded nickel hydroxide electrocatalyst were not uniform throughout the experiment and the materials failed to attain the required current density. This suggests that the Ni(OH)2 and I2-loaded Ni(OH)2 electrocatalysts were not consistent during the catalytic process. Similarly, chronopotentiometry tests were also conducted at a 40 mA cm−2 current density for 12 h to check the materials' stability over an extended period of time. The results revealed little fluctuation in the overpotential with the passage of time. The inset of Fig. 8(b) shows the LSV curve of 1-Ni(OH)2 after 12 h stability test. Similar to the extended period chronopotentiometry results, there was about a 10 mV increment in overpotential noticed.
Electrochemical impedance spectroscopy (EIS) was also considered to analyze the intrinsic OER kinetics of the Ni(OH)2, I-doped Ni(OH)2, and I2-loaded Ni(OH)2 electrocatalysts and the results are shown in Fig. 9. A modified Randles circuit was fitted to the experimental EIS data.† The inset of Fig. 9 shows the fitted circuit diagram. In this circuit, ‘R1’ shows the solution resistance, ‘Rct’ shows the charge-transfer resistance at the electrochemical double-layer, and ‘Rf’ is the resistance of a thin film of the material deposited on CFC.55 The Nyquist plot of iodine-doped Ni(OH)2 showed a smaller arc radius than the other materials tested. This was due to the faster kinetics of the electrode with efficient OER activity.56 The calculated Rct values for the bare CFC, Ni(OH)2, I-doped Ni(OH)2, and I2-loaded Ni(OH)2 electrocatalysts were 16.4, 8.8, 2.3, and 4.0 ohm, respectively. The lesser Rct of the I-doped Ni(OH)2 electrocatalysts suggested the faster electron-transfer process at their surfaces. This decrease in charge-transfer resistance was governed by the charge-trapping effect, reduction in flat-band protectional, and increase in charge-carrier density induced by iodine doping. This effect unblocked the transfer of charge at the I-Ni(OH)2/electrolyte interfaces.57,58
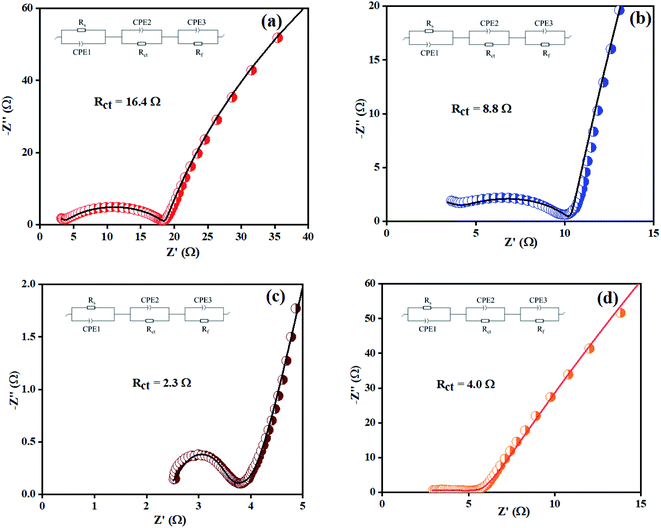 | ||
| Fig. 9 EIS spectra of: (a) bare CFC, (b) Ni(OH)2, (c) I-doped Ni(OH)2, and (d) I2-loaded Ni(OH)2 electrocatalysts. | ||
The fundamental activity of the OER reaction and consequences of charge-transfer resistance were further analyzed in terms of the exchange current density (J°). The calculations of the exchange current density were done using  , where R = general gas constant, T = absolute temperature, A = geometric area of electrode, F = Faraday's constant, n = number of electrons, and θ = charge-transfer resistance.59 The resultant exchange current densities for the CFC, Ni(OH)2, I-doped Ni(OH)2, and I2-loaded Ni(OH)2 electrocatalysts were 0.3, 0.7, 2.79, and 1.6 mA cm−2, respectively. The higher value of exchange current density of the I-doped Ni(OH)2 electrocatalyst showed its high intrinsic activity with quicker charge transfer across the electrode interphase.
The OER mechanism over the surface of hydroxides is considered to follow 4 crucial steps. The reaction mechanism is graphically illustrated in the graphical abstract and presented in eqn (1)–(4). The first step during this pathway involves the attachment of water molecules on active sites to give hydroxyl radicals. The prepared hydroxyl radicals dissociate to reactive oxygen species. This generated reactive oxygen species react with water and are converted to peroxyl radicals. These peroxyl radicals leave the active sites followed by disintegration to oxygen molecules.60
| H2O + * ↔ OH* + H+ + e− | (1) |
| OH* ↔ O* + H+ + e− | (2) |
| H2O + O* ↔ OOH* + H+ + e− | (3) |
| OOH* ↔ * + O2 + H+ + e− | (4) |
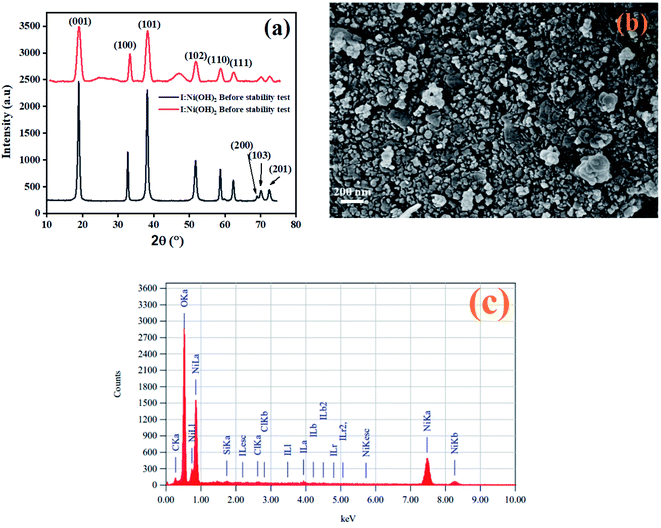
After the completion of the catalysis experiments, XRD, FESEM, and EDX analyses of the catalysts were conducted and the results are shown in Fig. 10. The XRD pattern of I-Ni(OH)2 after the stability test showed all the characteristics peaks of the material but with additional broad bands, marked by *, which were confirmed to be for the carbon fiber cloth.61 However, the peaks became broadened and their intensity dropped compared to the original ones. This drop in intensity might be due to the poisoning of the catalyst with the reaction intermediates, sample handling, and during its preparation for the XRD analysis. Moreover, the washing and drying of the samples also causes catalyst to loosen, which results in a decrease in the active parts of the catalyst. The FESEM analysis of the material after the stability test is also shown in Fig. 10(b). The FESEM results showed a little bit of aggregation of the material.62 However, the material remained in its circular form. The EDX analysis of the material after the stability test confirmed the presence of all the constituents in the material. The two extra elements found, carbon and silicon, might have originated from current collector (CFC) and washing process.
Consequently, the lower onset and overpotential, Tafel slope, multistep chronopotentiometric, EIS, and exchange current-density measurements suggest that the I-doped Ni(OH)2 electrocatalyst exhibited better OER activity than the pure nickel hydroxide and I2-loaded nickel hydroxide electrocatalysts. Owing to the following characteristics, the I-doped Ni(OH)2 displayed a significantly improved alkaline OER process: (1) the nanostructured morphology with a greater pore diameter to size ratio, (2) the surface defects structure rich in oxygen vacancies, (3) the availability of more active sites and greater ECSA, (4) the lower charge-transfer resistance with a higher exchange current density, and (5) finally, the relatively lower Tafel slope. Moreover, the I2-loaded Ni(OH)2 electrocatalyst, due to its lower BET surface area, lower pore diameter to size ratio, and least stability, failed to perform similar to the I-doped Ni(OH)2 electrocatalysts. Table 4 shows the benchmarking parameters for the previously reported electrocatalysts and a comparison with the current study.
| Electrocatalysts | Electrolyte | Method of synthesis | Onset potential (V vs. RHE) | Overpotential (mV) η40 | Tafel slope (mV dec−1) | Ref. |
|---|---|---|---|---|---|---|
| I:Ni(OH)2 | 1 M KOH | Hydrothermal | 1.52 | 330 | 104 | This work |
| β-Ni(OH)2 NPs | 1 M KOH | Precipitation | 1.57 | ∼470 | 186 | 21 |
| NiO-500 | 1 M KOH | Thermally oxidized | 1.55 | ∼370 | 70 | 63 |
| NiCo2O4 | 1 M NaOH | Solvothermal | 1.53 | ∼310 | 53 | 64 |
| NiMnOx-B | 6 M KOH | Annealing | 1.60 | ∼400 | 69 | 65 |
| NiMnLDH | 6 M KOH | Annealing | 1.63 | ∼440 | 83 | 65 |
| NiOx | 0.1 M KOH | Thin-film deposition | 1.52 | 390 | 65 | 66 |
3 Conclusion
In this report, we developed I-doped Ni(OH)2 electrocatalysts through a hydrothermal method. Interestingly, the CFC-supported I-doped Ni(OH)2 electrocatalyst exhibited greater electrocatalytic activity toward OER, requiring a lower overpotential of 330 mV to reach a current density of 40 mA cm−2 in 1 M aqueous KOH solution. Moreover, the I-doped Ni(OH)2 electrocatalysts showed excellent longer term stability as tested from 4 to 48 mV cm−2. The material exhibited a high electrochemical active surface area (308.72 cm−2) and lower (2.3 ohm) charge-transfer resistance. The kinetic insights showed a lower Tafel slope of the materials as compared to their counterparts under identical conditions. The experienced superior electrocatalytic activity was considered to be due to the abundant oxygen vacancies, more exposed catalytic active sites at the surface, low charge-transfer resistance, and higher pore diameter to pore size ratio.Conflicts of interest
There are no conflicts to declare.Acknowledgements
Authors from the Islamia University of Bahawalpur highly acknowledge the Institute of Chemistry, BJ-Campus, The Islamia University of Bahawalpur-Pakistan and HEC-Islamabad (Pakistan). Dr Hamoud H. Somaily sincerely appreciates the King Khalid University for the research grant (KKU/RCAMS/22) under the Research Center for Advanced Materials Science (RCAMS) at King Khalid University, Saudi Arabia. Prof. Dr Sonia Zulfiqar is highly thankful to the American University in Cairo for financial support through STRC mini-grant and research project no. SSE-CHEM-S. Z.- FY19-FY20-FY21-RG(1-19)-2018-Oct-01-17-53-22.References
- R. S. Gohar, I. Ahmad, A. Shah, S. Majeed, M. Najam-ul-Haq and M. N. Ashiq, Journal of Energy Storage, 2020, 31, 101621 CrossRef.
- P. Moriarty and D. Honnery, in Clean Energy for Sustainable Development, ed. M. G. Rasul, A. k. Azad and S. C. Sharma, Academic Press, 2017, pp. 3–27 Search PubMed.
- I. Ahmad, J. Ahmed, S. Batool, M. N. Zafar, A. Hanif, Zahidullah, M. F. Nazar, A. Ul-Hamid, U. Jabeen, A. Dahshan, M. Idrees and S. A. Shehzadi, J. Alloys Compd., 2022, 894, 162409 CrossRef CAS.
- R. G. Jadhav, D. Singh, P. V. Krivoshapkin and A. K. Das, Inorg. Chem., 2020, 59, 7469–7478 CrossRef CAS PubMed.
- J. Liu, J. Wang, B. Zhang, Y. Ruan, H. Wan, X. Ji, K. Xu, D. Zha, L. Miao and J. Jiang, J. Mater. Chem. A, 2018, 6(5), 2067–2072 RSC.
- N. A. Khan, N. Rashid, M. Junaid, M. N. Zafar, M. Faheem and I. Ahmad, ACS Appl. Energy Mater., 2019, 2(5), 3587–3594 CrossRef CAS.
- C. Wu, Y. Du, Y. Fu, W. Wang, T. Zhan, Y. Liu, Y. Yang and L. Wang, Composites, Part B, 2019, 177, 107252 CrossRef CAS.
- J. Guan, X. Bai and T. Tang, Nano Res., 2022, 15, 818–837 CrossRef CAS.
- Z. Gao, L. L. Gong, X. Q. He, X. M. Su, L. H. Xiao and F. Luo, Inorg. Chem., 2020, 59, 4995–5003 CrossRef CAS PubMed.
- Y. Lee, J. Suntivich, K. J. May, E. E. Perry and Y. Shao-Horn, J. Phys. Chem. Lett., 2012, 3, 399–404 CrossRef CAS PubMed.
- F. Song, L. Bai, A. Moysiadou, S. Lee, C. Hu, L. Liardet and X. Hu, J. Am. Chem. Soc., 2018, 140, 7748–7759 CrossRef CAS PubMed.
- S. Kumaravel, K. Karthick, S. S. Sankar, A. Karmakar, R. Madhu, K. Bera and S. Kundu, Sustainable Energy Fuels, 2021, 5, 6215–6268 RSC.
- D. Zhou, P. Li, X. Lin, A. McKinley, Y. Kuang, W. Liu, W.-F. Lin, X. Sun and X. Duan, Chem. Soc. Rev., 2021, 50, 8790–8817 RSC.
- C. Hu, Q. Dai and L. Dai, Cell Rep. Phys. Sci., 2021, 2, 100328 CrossRef CAS.
- M. Gao, W. Sheng, Z. Zhuang, Q. Fang, S. Gu, J. Jiang and Y. Yan, J. Am. Chem. Soc., 2014, 136, 7077–7084 CrossRef CAS PubMed.
- M.-R. Gao, X. Cao, Q. Gao, Y.-F. Xu, Y.-R. Zheng, J. Jiang and S.-H. Yu, ACS Nano, 2014, 8, 3970–3978 CrossRef CAS.
- V. Vij, S. Sultan, A. M. Harzandi, A. Meena, J. N. Tiwari, W.-G. Lee, T. Yoon and K. S. Kim, ACS Catal., 2017, 7, 7196–7225 CrossRef CAS.
- M. S. Ali Akbari, R. Bagheri, Z. Song and M. M. Najafpour, Sci. Rep., 2020, 10, 8757 CrossRef CAS PubMed.
- Y. R. Hong, K. Kim, J. H. Ryu, S. Mhin, J. Kim, G. Ali, K. Y. Chung, S. Kang and H. Han, Adv. Funct. Mater., 2020, 30, 2004330 CrossRef CAS.
- D. Xiong, W. Li and L. Liu, Chem.–Asian J., 2017, 12, 543–551 CrossRef CAS PubMed.
- N. Kim, D. Lim, Y. Choi, S. E. Shim and S.-H. Baeck, Electrochim. Acta, 2019, 324, 134868 CrossRef CAS.
- D. S. Hall, D. J. Lockwood, S. Poirier, C. Bock and B. R. MacDougall, J. Phys. Chem. A, 2012, 116, 6771–6784 CrossRef CAS PubMed.
- T. N. Ramesh, Mater. Chem. Phys., 2009, 114, 618–623 CrossRef CAS.
- D. Hall, D. Lockwood, C. Bock and B. MacDougall, Proc. R. Soc. A, 2015, 471, 1–65 CrossRef PubMed.
- A. Vazhayil, L. Vazhayal, J. Thomas, S. Ashok and N. Thomas, Appl. Surf. Sci., 2021, 6, 100184 CrossRef.
- Z. Angeles-Olvera, A. Crespo-Yapur, O. Rodríguez, J. L. Cholula-Díaz, L. M. Martínez and M. Videa, Energies, 2022, 15, 1609 CrossRef CAS.
- K. P. Madhuri, N. S. John, S. Angappane, P. K. Santra and F. Bertram, J. Phys. Chem. C, 2018, 122, 28075–28084 CrossRef CAS.
- L.-F. Chen, Z.-Y. Yu, J.-J. Wang, Q.-X. Li, Z.-Q. Tan, Y.-W. Zhu and S.-H. Yu, Nano Energy, 2015, 11, 119–128 CrossRef CAS.
- N. Hussain, W. Yang, J. Dou, Y. Chen, Y. Qian and L. Xu, J. Mater. Chem. A, 2019, 7, 9656–9664 RSC.
- K. P. Madhuri, P. Kaur, M. E. Ali and N. S. John, J. Phys. Chem. C, 2017, 121, 9249–9259 CrossRef CAS.
- W. Li, R. Liang, A. Hu, Z. Huang and Y. N. Zhou, RSC Adv., 2014, 4, 36959–36966 RSC.
- J. Zhang, Z.-H. Huang, Y. Xu and F. Kang, Int. J. Photoenergy, 2012, 2012, 915386 Search PubMed.
- M. Szkoda, K. Siuzdak and A. Lisowska-Oleksiak, Phys. E, 2016, 84, 141–145 CrossRef CAS.
- Y.-Z. Zheng, X. Tao, Q. Hou, D.-T. Wang, W.-L. Zhou and J.-F. Chen, Chem. Mater., 2011, 23, 3–5 CrossRef CAS.
- H. Lee, X. Zhang, B. Kim, J.-H. Bae and J. Park, Materials, 2021, 14, 6118 CrossRef CAS PubMed.
- V. Štengl and T. M. Grygar, Int. J. Photoenergy, 2011, 2011, 685935 Search PubMed.
- W. Su, Y. Zhang, Z. Li, L. Wu, X. Wang, J. Li and X. Fu, Langmuir, 2008, 24, 3422–3428 CrossRef CAS PubMed.
- Z. He, C. Wang, H. Wang, F. Hong, X. Xu, J. Chen and S. Song, J. Hazard. Mater., 2011, 189, 595–602 CrossRef CAS PubMed.
- A. Umar, V. Mohammad and Y.-B. Hahn, Metal Oxide Nanostructures and Their Applications, American Scientific Publishers, 2010, ch. 2, pp. 1–39 Search PubMed.
- S. Vidhya, Nickel–cobalt hydroxide: a positive electrode for supercapacitor applications, 2020 Search PubMed.
- C. Krishnan, P. Selvarajan, T. H. Freeda and C. K. Mahadevan, Phys. B, 2009, 404, 289–294 CrossRef CAS.
- T. Audichon, T. W. Napporn, C. Canaff, C. Morais, C. Comminges and K. B. Kokoh, J. Phys. Chem. C, 2016, 120, 2562–2573 CrossRef CAS.
- K. S. Joya, M. A. Ehsan, N.-U.-A. Babar, M. Sohail and Z. H. Yamani, J. Mater. Chem. A, 2019, 7, 9137–9144 RSC.
- K. Joya, N. Babar, S. Gilani, F. Yasmeen, M. Sarfaraz, S. Ikram, S. Colak, K. Ocakoglu and M. Ince, ChemistrySelect, 2018, 3, 11357–11366 CrossRef CAS.
- C. C. L. McCrory, S. Jung, J. C. Peters and T. F. Jaramillo, J. Am. Chem. Soc., 2013, 135, 16977–16987 CrossRef CAS PubMed.
- N.-U.-A. Babar and K. S. Joya, ACS Omega, 2020, 5, 10641–10650 CrossRef CAS PubMed.
- Y. Yang, H. Wang, L. Wang, Y. Ge, K. Kan, K. Shi and J. Chen, New J. Chem., 2016, 40, 4678–4686 RSC.
- Z.-H. Huang, H. Li, W.-H. Li, G. Henkelman, B. Jia and T. Ma, Small, 2020, 16, 2004709 CrossRef CAS PubMed.
- L. Mentar, H. Lahmar, K. mohamed redha and A. Amor, J. New Technol. Mater., 2014, 4, 41–45 CrossRef CAS.
- S. Anantharaj, S. Noda, M. Driess and P. W. Menezes, ACS Energy Lett., 2021, 6, 1607–1611 CrossRef CAS.
- Z. Lu, W. Xu, W. Zhu, Q. Yang, X. Lei, J. Liu, Y. Li, X. Sun and X. Duan, Chem. Commun., 2014, 50, 6479–6482 RSC.
- T. Shinagawa, A. T. Garcia-Esparza and K. Takanabe, Sci. Rep., 2015, 5, 13801 CrossRef PubMed.
- L. Negahdar, F. Zeng, S. Palkovits, C. Broicher and R. Palkovits, ChemElectroChem, 2019, 6, 5588–5595 CrossRef CAS.
- M. A. Ghanem, M. S. Amer, A. M. Al-Mayouf, P. Arunachalam and M. T. Weller, Catalysts, 2021, 11, 1408 CrossRef CAS.
- K. Feng, F. Wang, X. Yang, H. Zhang, X. Li and H. Zhang, J. Mater. Chem. A, 2019, 7, 567–573 RSC.
- K.-B. Pu, C.-X. Lu, K. Zhang, H. Zhang, Q.-Y. Chen and Y.-H. Wang, Bioprocess Biosyst. Eng., 2020, 43, 429–437 CrossRef CAS PubMed.
- J. X. Zhao, Y. Z. Zheng, X. H. Lu, J. F. Chen, X. Tao and W. Zhou, ChemPhysChem, 2013, 14, 1977–1984 CrossRef CAS PubMed.
- W.-H. Yang, W.-T. Yang and X.-Y. Lin, Acta Phys.-Chim. Sin., 2012, 28, 831–836 CAS.
- S. Anantharaj, S. R. Ede, K. Sakthikumar, K. Karthick, S. Mishra and S. Kundu, ACS Catal., 2016, 6, 8069–8097 CrossRef CAS.
- X. Bai, Z. Duan, B. Nan, L. Wang, T. Tang and J. Guan, Chin. J. Catal., 2022, 43, 2240–2248 CrossRef.
- T. Yu, H. L. Liu, M. Huang, J. Zhang, D. Su, Z. Tang, J. Xie, Y. Liu, A. Yuan and Q. Kong, RSC Adv., 2017, 7, 51807–51813 RSC.
- J. Li, P. Li, J. Li, Z. Tian and F. Yu, Catalysts, 2019, 9, 506 CrossRef CAS.
- P. T. Babar, A. C. Lokhande, M. G. Gang, B. S. Pawar, S. M. Pawar and J. H. Kim, J. Ind. Eng. Chem., 2018, 60, 493–497 CrossRef CAS.
- X. Gao, H. Zhang, Q. Li, X. Yu, Z. Hong, X. Zhang, C. Liang and Z. Lin, Angew. Chem., 2016, 55, 6290–6294 CrossRef CAS PubMed.
- Z. Chen, Z. Wang, R. Cai, Y. Xie, J. Yu, X. Long, B. Yang and S. Yang, Nanoscale, 2020, 12, 2472–2478 RSC.
- H. Radinger, P. Connor, S. Tengeler, R. W. Stark, W. Jaegermann and B. Kaiser, Chem. Mater., 2021, 33, 8259–8266 CrossRef CAS.
Footnote |
| † Electronic supplementary information (ESI) available. See https://doi.org/10.1039/d2ra03873k |
| This journal is © The Royal Society of Chemistry 2022 |

