 Open Access Article
Simultaneous detection of acetaminophen, catechol and hydroquinone using a graphene-assisted electrochemical sensor†
Guofang Wang‡
a,
Siyi Zhang‡a,
Qinyu Wu‡a,
Jingzhi Zhua,
Suhua Chenc,
Yuanyuan Leia,
Yanmei Lia,
Haomin Yia,
Liyin Chend,
Zi-Qi Shi*b and
Yi Xiao *ad
*ad
aKey Laboratory of Study and Discovery of Small Targeted Molecules of Hunan Province, Department of Pharmacy, School of Medicine, Hunan Normal University, Changsha 410013, Hunan, China. E-mail: njcpuxy4936@163.com
bAffiliated Hospital of Integrated Traditional Chinese and Western Medicine, Nanjing University of Chinese Medicine, Nanjing 210028, Jiangsu, China. E-mail: shiziqi47@126.com
cHunan Provincial Maternal and Child Health Care Hospital, Changsha 410008, Hunan, China
dJohn A. Paulson School of Engineering and Applied Sciences, Harvard University, Cambridge, MA 02138, USA
First published on 22nd August 2022
Abstract
Simple, rapid and sensitive analysis of drug-derived pollutants is critically valuable for environmental monitoring. Here, taking acetaminophen, hydroquinone and catechol as a study example, a sensor based on an ITO/APTES/r-GO@Au electrode was developed for separate and simultaneous determination of phenolic pollutants. ITO electrodes that are modified with 3-aminopropyltriethoxysilane (APTES), graphene (GO) and Au nanoparticles (Au NPs) can significantly enhance the electronic transport of phenolic pollutants at the electrode surface. The redox mechanisms of phenolic pollutants include the electron transfer with the enhancement of r-GO@Au. The modified ITO electrode exhibits excellent electrical properties to phenolic pollutants and a good linear relationship between ECL intensity and the concentration of phenolic pollutants, with a limit of detection of 0.82, 1.41 and 1.95 μM, respectively. The separate and simultaneous determination of AP, CC and HQ is feasible with the ITO/APTES/r-GO@Au electrode. The sensor shows great promise as a low-lost, sensitive, and rapid method for simultaneous determination of drug-derived pollutants.
1 Introduction
Simple, rapid and sensitive analysis of drug-derived pollutants is critically valuable for environmental monitoring.1,2 Phenolic pollutants, which are hypertoxic and non-degradable pollutants, lead to severe damage to the environment and human health.3,4 Acetaminophen (AP) is widely used as an over-the-counter drug to relieve pain, fever and headaches.5,6 However, AP poisoning is currently the leading cause of acute liver failure in United States and Europe.7–9 According to the International Agency for Research on Cancer, catechol (CC) and hydroquinone (HQ) are both listed as the possible human carcinogens.10 The exposure of AP, HQ, and CC to humans may lead to toxic effects on the lung, heart, liver and central nervous system. Therefore, it is highly necessary and urgent to develop a simple, rapid, and real-time method for the determination of phenolic pollutants for environment pollution and monitoring.Several analytical techniques have been developed to phenolic pollutants analysis, including capillary electrophoresis, chromatography, colorimetry,11,12 spectrometry, spectrophotometry, and chemiluminescence.13,14 These methods are with high sensitivity, high selectivity, and high resolution.15–17 However, they are laborious, high-cost, time-consuming, and need skilled personnel to manipulate.18 Electrochemical (EC) technique has attracted enormous attention due to its simplicity, low-cost, and ease of operation, and offers a portable for phenolic pollutants detection.19–21
Graphene (GO) is composed of layers of sp2-hybridized carbon atoms, with high mechanical strength, extraordinary electron transfer capability and excellent thermal conductivity.22 GO-based nanomaterials (e.g., metals, metal oxides, and quantum dots) could improve the electron transfer rate and electrical properties,23–26 which have been applied to improve EC performances.27,28 Since AP, CC and HQ exhibit similar structures and properties, they usually coexist in the environment. Simultaneous detection of these compounds is rather challenging, and no EC method exists for the simultaneous detection of AP, HQ, and CC.
Here, an ITO electrode modified with 3-aminopropyltriethoxysilane (APTES), graphene (GO) and Au NPs (ITO/APTES/r-GO@Au), was developed for phenolic pollutants analysis.29 We characterized ITO/APTES/r-GO@Au by cyclic voltammetry (CV) and scanning electron microscopy (SEM). We investigate EC behaviors and redox mechanisms of phenolic pollutants at ITO/APTES/r-GO@Au electrode by CVs and differential pulse voltammograms (DPVs). ITO/APTES/r-GO@Au electrode has excellent electrocatalytic activity to phenolic pollutants, and enables simultaneous determination of commercial tablets. The sensor shows great promise for low-lost, sensitive, and rapid method for simultaneous determination of phenolic pollutants.
2 Materials and methods
2.1 Chemicals and materials
All reagents and materials were purchased and used as received without further purification. Potassium ferricyanide (K3[Fe(CN)6]), acetaminophen (AP, 99.0%), hydroquinone (HQ), catechol (CC, 99%) are from Sigma-Aldrich Inc. (St. Louis, MO, U.S.A.). HAuCl4 is purchased from Shanghai Sybridge Chemical reagent Company. Sodium hydroxide (NaOH), ferrocene methanol, acetone, methanol, and ethanol are from Sinopharm Chemical Reagent Co. Ltd. The indium tin oxide glass (ITO, <17 ohm per square) is from Kaivo Electronic Components Co. Ltd. 3-Aminopropyltriethoxysilane (APTES) is purchased from Shanghai Aladdin Biochemical Technology Co., Ltd. GO powder was purchased from Jiangsu XFNANO Materials Tech. Co., Ltd. ITO was immersed in 1 M NaOH and methanol (1![[thin space (1/6-em)]](https://www.rsc.org/images/entities/char_2009.gif) :
:![[thin space (1/6-em)]](https://www.rsc.org/images/entities/char_2009.gif) 1) overnight, followed by sonication in acetone, ethanol, and water, sequentially. Then ITO was washed with water and dried under an argon stream.
1) overnight, followed by sonication in acetone, ethanol, and water, sequentially. Then ITO was washed with water and dried under an argon stream.
2.2 Fabrication of ITO/APTES electrode
The photolithographic technique and chemical etching were used to pattern the ITO glass. ITO glass was cut into 1.25 cm × 5 cm pieces. It was sonicated in 1 M NaOH and methanol (1![[thin space (1/6-em)]](https://www.rsc.org/images/entities/char_2009.gif) :
:![[thin space (1/6-em)]](https://www.rsc.org/images/entities/char_2009.gif) 1) for 20 min, MiliQ water for 10 min and dried at 60 °C. ITO electrodes were immersed in 5% APTES solution (26.3 mL of APTES in 500 mL of ethanol) for 12 h. Then electrodes were washed with ethanol and distilled water, and heated to 100 °C for 6 h. Fig. 1A shows the fabrication of APTES modified ITO electrode.
1) for 20 min, MiliQ water for 10 min and dried at 60 °C. ITO electrodes were immersed in 5% APTES solution (26.3 mL of APTES in 500 mL of ethanol) for 12 h. Then electrodes were washed with ethanol and distilled water, and heated to 100 °C for 6 h. Fig. 1A shows the fabrication of APTES modified ITO electrode.
 | ||
| Fig. 1 (A) Scheme of the silanization reaction on ITO electrode. (B) Fabrication of ITO/r-GO@Au electrode. | ||
2.3 Preparation of ITO/APTES/r-GO electrode
GO powder was exfoliated in distilled water (50 mL) by sonication (2 h) to form a 2.4 mg mL−1 GO dispersion. CVs and DPVs were performed with a CHI 660 C electrochemical station (CH Instrument, Shanghai). CV was conducted in the GO dispersion (scan rate, 0.02 V s−1) and 10 cycles were applied for the electrode modification. Then the electrode was washed with ultrapure water, and baked at 40 °C for 30 min. The electrode was kept at room temperature before use.2.4 Preparation of ITO/APTES/r-GO@Au electrode
A conventional three electrode system was used for the experiment, where ITO, Pt wire and Ag/AgCl were used as working electrode, counter electrode and reference electrodes, respectively. The deposition potential of −1 to 1 V and the scan rate of 0.1 V s−1 were selected for the experiment, and the oxidized graphene solution was electrolytically reduced for 30 min. The oxygen-containing functional groups of GO get electrons at the cathode and are reduced to ITO/r-GO. In the three-electrode system, ITO/r-GO glass was exfoliated in 1 mM HAuCl4. The electrochemical behaviours of Au on ITO/r-GO electrode were studied by CV. CV curves were recorded in the potential range from 0.1 V to 0.5 V, with scan rate of 0.1 V s−1. Finally, the prepared ITO/r-GO@Au electrode was baked at 40 °C for 30 min. The tape is used to fix the deposition area, and the tape does not need to be removed during the experiment. Fig. 1B shows the fabrication of ITO/APTES/r-GO@Au electrode. Scanning electron microscopy (SEM) images with Hitachi-SU8010 electron microscope, respectively.2.5 Phenolic compounds analysis
EC measurements were performed in a three-electrode system with a modified electrode, a Pt wire and Ag/AgCl electrode. A series of acetic-acid solutions (0.1 M, pH 4.5) containing different concentrations of AP, HQ and CC were measured with the modified electrodes.HPLC analysis was conducted on Agilent 1260 equipped with a VWD detector. Chromatographic separation was performed with Agilent 5 TC-C18 (250 × 4.6 mm) at 30 °C. The mobile phase was methanol: water (20![[thin space (1/6-em)]](https://www.rsc.org/images/entities/char_2009.gif) :
:![[thin space (1/6-em)]](https://www.rsc.org/images/entities/char_2009.gif) 80, v/v). The flow rate was 1.0 μL min−1, and the injection volume was 10 μL.
80, v/v). The flow rate was 1.0 μL min−1, and the injection volume was 10 μL.
3 Results and discussion
3.1 Characterization of modified electrodes
The surface morphology of electrodes was characterized by SEM. As shown in Fig. 2, SEM image of ITO electrode exhibits a smooth surface. ITO/r-GO electrode image reveals the typical crumple and wrinkled GO sheet structure on the rough surface of the film. AuNPs spots was observed in image of ITO/APTES/r-GO@Au electrode.Fig. S2† shows the Raman spectra of ITO glass, ITO/r-GO glass, ITO/r-GO@Au glass, ITO/APTES/r-GO glass and ITO/APTES/r-GO@Au glass electrodes. The red curve exhibits obvious characteristic peaks at 1597 cm−1 and 1350 cm−1, which can be assigned to G band and D band of r-GO. When Au nanoparticles were modified, the D and G peaks of the ITO/r-GO electrode were significantly enhanced as shown in Fig. S2c.† Comparing Fig. S2b and e, Fig. S2e† has an additional peak at 1500 cm−1, which corresponds to the vibration mode of NH2. As shown in Fig. S2d,† three main peaks (1597 cm−1, 1350 cm−1 and 1500 cm−1) are enhanced, due to the surface enhancement effect of gold nanoparticles.
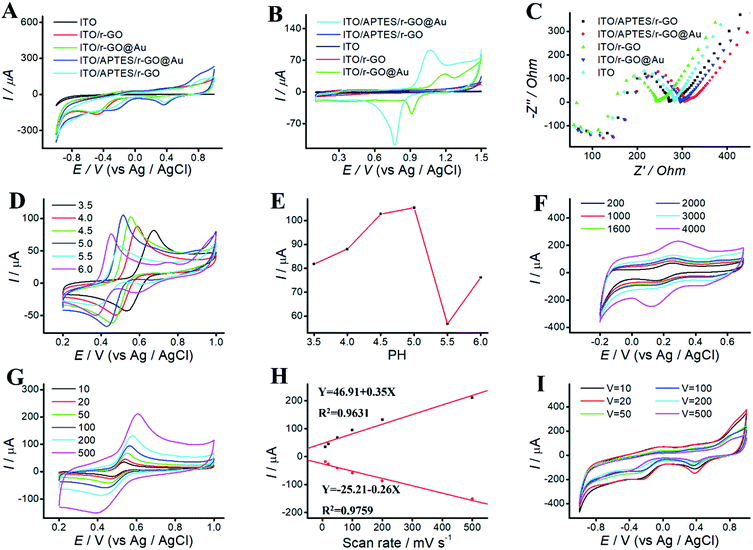
ITO/APTES/r-GO@Au electrode was characterized by CV and EC impedance spectroscopy. Fig. 3 shows EC behaviors of ITO, ITO-rGO, ITO/r-GO@Au, ITO/APTES/rGO and ITO/APTES/r-GO@Au electrode in PBS (pH 9.18) and 0.05 M H2SO4, respectively. No current peak was observed for ITO electrode in the swept voltage range. However, after the electrode deposition of rGO on ITO, a rising oxidation peak was observed, indicating that the electrode area increased and the electrode surface properties changed. After the deposition of Au NPs on ITO/r-GO electrode, the current continued to increase. It indicates that phenolic pollutants analysis at ITO/APTES/r-GO@Au electrode is possible.
We study the electrical properties of the modified ITO electrode with EC impedance spectroscopy (EIS). Fig. 3C shows the impedance spectra of ITO, ITO-rGO, ITO/r-GO@Au, ITO/APTES/rGO and ITO/APTES/r-GO@Au electrode. The electron-transfer resistance of modified ITO electrode was significantly decreased, which indicates an enhanced electron transport after ITO modification. Compared with ITO, the slope of the curve decreases at ITO/APTES/r-GO@Au electrode. According to the nature of the curve of the impedance detection spectrum, the slope of the curve is directly proportional to the magnitude of the impedance. The impedance decreases after coating GO and AuNPs on bare ITO, which indicates that GO and AuNP increase the conductivity of ITO electrode, and promote the electronic transport. It consists with the results of CVs, further confirming the formation of ITO/APTES/r-GO@Au.30
3.2 Influence of pH
EC behaviors of phenolic pollutants at different pH was investigated by CVs. Solution pH affects not only the peak shape and peak potential, but also the peak current. CVs were performed in acetate solutions ranging from pH 3.5 to 6.0 (Fig. 3D). As shown in Fig. 3E, AP is used as the model drug, and the peak current of AP increases first and then decreases with the increasing pH. The maximum peak was observed at pH 4.5. Thus, solution pH 4.5 was selected for further experiments.3.3 Influence of deposition time
The effect of deposition time was investigated at ITO/APTES/r-GO@Au electrode in 0.5 mM ferrocene methanol solution. As shown in Fig. 3F, deposition time exhibit a significant effect on peak current, which increased with the increasing deposition time and reached a maximum at 4000 s. At higher deposition time, the peaks became progressively broader, and the GO film was too thick and easy to fall off. To save time and get a better oxidative peak current, 2000 s was chosen for the subsequent experiments.3.4 Influence of scan rate
To study the effect of scan rates on ITO/r-GO@Au electrode, we investigate the scan rate in the range of 10–500 mV s−1 in PBS (pH 9.18). As shown in Fig. 3I, upon increasing the scan rate, the current increases first, and then decrease. The maximum was observed at 20 mV s−1, and 20 mV s−1 was selected for further experiments.The effect of scan rates on the redox peak currents was investigated in the range of 10–500 mV s−1. Fig. 3G shows CVs of AP on ITO/APTES/r-GO@Au electrode at different scan rates. The results indicated that the redox peak currents increased with the increase of scan rate from 10 to 500 mV s−1. Fig. 3H shows that both the oxidation and reduction peak currents were linearly proportional to the scan rates in the range of 10–500 mV s−1. The linear regression equations are Y = 46.91 + 0.35X (R2 = 0.9631) and Y = −25.21 to 0.26X (R2 = 0.9759).
3.5 The redox mechanisms of phenolic pollutants
The redox mechanisms of AP, HQ and CC were investigated at ITO/APTES/r-GO@Au electrode in 0.10 M acetate solution (pH 4.5) by CVs. With the addition of 0.2 M AP, the anodic and cathodic peaks of AP are observed at 554 and 450 mV at ITO/APTES/r-GO@Au electrode, respectively (Fig. 4A). The peak potential separation (DEp) (104 mV) indicates that AP exhibits an irreversible EC behavior at ITO/APTES/r-GO@Au electrode. The redox of AP belongs to a two-electron and one-proton process,31 and the possible redox mechanism of AP on the modified electrode was shown in Fig. 4B. AP was oxidized to generate the product, which is stable because of the π–π interaction between the product and the graphene sheets. And GO and AuNPs help to provide electrons for the redox process of the redox of AP.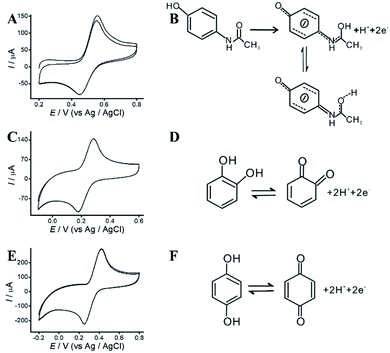 | ||
| Fig. 4 (A) CVs of AP. (B) The redox mechanism of AP. (C) CVs of CC. (D) The redox mechanism of CC. (E) CVs of HQ. (F) The redox mechanism of HQ. | ||
As shown in Fig. 4C and E, CVs of CC and HQ were investigated at ITO/APTES/r-GO@Au electrode. It is generally believed that the oxidation mechanism of HQ and CC is a heterogeneous electronic oxidation process. The anodic and cathodic peak potential of CC are at 423 and 251 mV, respectively, with a DEp of 171 mV. The anodic and cathodic peak potential of HQ are at 285 and 178 mV with a DEp of 107 mV. Fig. 4D and F show the possible redox mechanisms, and CC and HQ electrooxidation were mediated by the electron transfer.32
As shown in Table S5,† we compare the ITO/APTES/r-GO@Au sensor with other methods.33–38 Comparing with other methods, the detection of AP, CC and HQ with our sensor is accurate, and exhibit wide dynamic ranges and low LODs.
3.6 Separate determination of phenolic pollutants
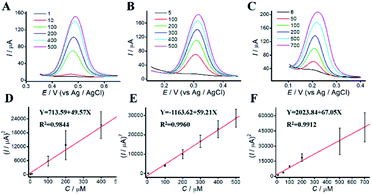
The dependence of the oxidation peak current of phenolic compounds on their concentrations were investigated in acetic-acid solution (0.1 M, pH 4.5) by DPV. DPVs at different concentrations of phenolic pollutants were shown in Fig. 5. The linear dynamic ranges for AP, CC, and HQ were 1 to 500 μM, 5 to 500 μM and 8 to 700 μM, respectively. The concentrations of phenolic pollutants showed a good linear relationship with the oxidation peak current. The linear equations were Y = 713.59 + 49.57X (R2 = 0.9844), Y = −1163.62 + 59.21X (R2 = 0.9960), and Y = 2023.84 + 67.05X (R2 = 0.9912), respectively. The limits of detection (LODs) were 0.82, 1.41 and 1.95 μM, respectively. As shown in Table S1,† the limits of quantitation (LOQs) were 2.73, 4.71 and 6.51 μM, respectively.3.7 Simultaneous determination of phenolic pollutants
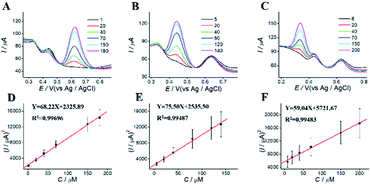
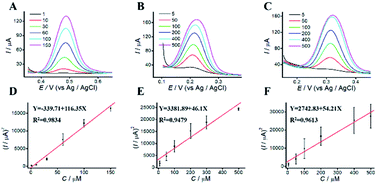
For simultaneous determination of phenolic pollutants, firstly, the concentration of AP varied from 1 to 180 μM with the fixed HQ and CC concentrations. As shown in Fig. 6A and D and Table S2,† the peak current of AP shows a good linear relationship with AP concentration with the regression equations of Y = 68.22X + 2325.89 (R2 = 0.997, LOD = 0.12 μM). Secondly, the concentration of CC varied from 5 to 140 μM with the fixed AP and HQ concentrations. Fig. 6B shows an increase in peak current with CC concentration with the regression equation of Y = 75.50X + 2535.50 (R2 = 0.9949, LOD = 0.13 μM). Thirdly, the concentration of HQ varied from 8 to 200 μM with the fixed AP and CC concentrations. Fig. 6C shows a potential change. Fig. 6 F shows the linear relationships with the regression equation of Y = 59.04X + 5721.67 (R2 = 0.9948, LOD = 0.11 μM).We also performed the simultaneous determination of AP, CC, and HQ Fig. 7A shows the simultaneous determination of AP, CC, and HQ within the measurable range. As shown in Fig. 7B–D, the linear relationships are observed between peak current and AP, CC, HQ concentration in the range of 20–130 μM, 20–120 μM, and 40–150 μM, respectively. Three oxidation peaks were observed at 0.332, 0.44, and 0.616 V, corresponding to AP, CC, and HQ, respectively. Hence, the simultaneous determination of AP, CC, HQ is feasible with ITO/APTES/r-GO@Au electrode.
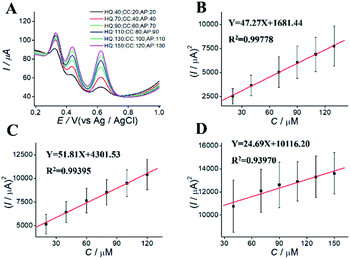 | ||
| Fig. 7 DPVs for simultaneous determination of (A) different concentration of AP, CC, and HQ at ITO/APTES/r-GO@Au electrode, and (B–D) their plots of concentration vs. square of current. | ||
3.8 Analytical applications
To investigate the application potential of ITO/APTES/r-GO@Au sensor, we perform the recovery experiments for the samples spiked with known added concentration of phenolic pollutants.30 The results were shown in Fig. 8 and Table S3.† The recoveries were 106.43%, 105.94% and 108.57%, with relative standard deviations (RSDs) of 0.63%, 0.10% and 0.31%. Hence, the modified electrode could be used for phenolic pollutants analysis in practical applications.The stock solution contains 250 μg mL−1 of AP, 67 μg mL−1 of Compound Paracetamol and Amantadine Hydrochloride tablets and 20% of methanol in mobile phase. The AP stock solution was diluted with mobile phase into a series of different concentrations solution (2.5, 12.5, 25, 50, 100, 150, and 250 μg mL−1, respectively). HPLC was performed with a flow rate of 1.0 mL min−1. The retention time of AP was approximately 7.87 min. We compared the results obtained by our sensor with HPLC. As shown in Fig. S1, and Table S4,† the regression equations are Y = −27.70 + 39.09X (R2 = 0.99996) for HPLC, and Y = −325.52 + 91.27X (R2 = 0.99390) for EC, respectively. Satisfactory results were obtained with our sensor.
4 Conclusion
We have developed a rapid, low-cost, and sensitive EC sensor for simultaneous determination of phenolic pollutants analysis, based on an ITO/APTES/r-GO@Au electrode. The decrease of electron-transfer resistance of the ITO/APTES/r-GO@Au electrode indicates an enhanced electronic transport after ITO modification. The concentrations of phenolic pollutants showed a good linear relationship with the oxidation peak current. Wider concentration ranges and lower LODs were obtained with ITO/APTES/r-GO@Au electrode, indicating that the modified ITO electrode is a promising platform for drug-derived pollutants analysis. To realize the simultaneous detection of multiple samples, other EC methods need to use multi-channel EC workstation or multi-stage parallel mode. Our method can be applied to multi-component detection and drug-derived pollutants monitoring.Author contributions
Guofang Wang: conceptualization, methodology, data curation. Siyi Zhang: conceptualization, methodology, data curation. Qinyu Wu: conceptualization, methodology, data curation. Jingzhi Zhu: visualization, software. Suhua Chen: conceptualization, methodology, resources, data curation, writing – review & editing. Yuanyuan Lei: visualization, software. Yanmei Li: visualization, software. Haomin Yi: software. Liyin Chen: writing – review & editing. Zi-Qi Shi: conceptualization, writing – review & editing. Yi Xiao: conceptualization, methodology, investigation, writing – original draft, review & editing, funding acquisition, supervision.Conflicts of interest
The authors declare that they have no known competing financial interests or personal relationships that could have appeared to influence the work reported in this paper.Acknowledgements
This work was supported by National Natural Science Foundation of China (81803720), Natural Science Foundation of Hunan Province (2019JJ50383), Natural Science Foundation of Changsha (kq2202256), Huxiang High-Level Talent Innovation Team (2018RS3072), Scientific and Technological Projects for Collaborative Prevention and Control of Birth Defect in Hunan Province (2019SK1012), and Key Grant of Research and Development in Hunan Province (2020DK2002).Notes and references
- R. S. J. Alkasir, M. Ornatska and S. Andreescu, Anal. Chem., 2012, 84, 9729–9737 CrossRef CAS PubMed.
- E. Murugan and K. Kumar, Anal. Chem., 2019, 91, 5667–5676 CrossRef CAS PubMed.
- S. Shi, S. Reisberg, G. Anquetin, V. Noel, M. C. Pham and B. Piro, Biosens. Bioelectron., 2015, 72, 205–210 CrossRef CAS PubMed.
- A. Maikap, K. Mukherjee, B. Mondal, N. Mandal and A. K. Meikap, Biosens. Bioelectron., 2019, 128, 32–36 CrossRef CAS PubMed.
- Z. Xu, F. Liu, T. Zhang, Y. Gu, N. Lu, H. Xu, X. Yan, Y. Song, Y. Xing, D. Yu, Z. Zhang and P. Lu, Anal. Chem., 2020, 92, 15297–15305 CrossRef CAS PubMed.
- C. Su, Z. Li, D. Zhang, Z. Wang, X. Zhou, L. Liao and X. Xiao, Biosens. Bioelectron., 2020, 148, 111819 CrossRef CAS PubMed.
- N. Wester, B. F. Mikladal, I. Varjos, A. Peltonen, E. Kalso, T. Lilius, T. Laurila and J. Koskinen, Anal. Chem., 2020, 92, 13017–13024 CrossRef CAS PubMed.
- S. Shi, S. Reisberg, G. Anquetin, V. Noël, M. C. Pham and B. Piro, Biosens. Bioelectron., 2015, 72, 205–210 CrossRef CAS PubMed.
- G. Zhao, L. Yang, S. Wu, H. Zhao, E. Tang and C.-P. Li, Biosens. Bioelectron., 2017, 91, 863–869 CrossRef CAS PubMed.
- Y. Zhou, L. Tang, G. Zeng, J. Chen, Y. Cai, Y. Zhang, G. Yang, Y. Liu, C. Zhang and W. Tang, Biosens. Bioelectron., 2014, 61, 519–525 CrossRef CAS PubMed.
- T. D. Tran, P. T. Nguyen, T. N. Le and M. I. Kim, Biosens. Bioelectron., 2021, 182, 113187 CrossRef CAS PubMed.
- S. W. Wu, D. Z. Guo, X. C. Xu, J. M. Pan and X. H. Niu, Sens. Actuators, B, 2020, 303, 127225 CrossRef CAS.
- Y. Zhang, Z. Y. Huang, L. T. Wang, C. M. Wang, C. D. Zhang, T. Wiese, G. D. Wang, K. Riley and Z. Wang, Anal. Chem., 2018, 90, 4733–4740 CrossRef CAS PubMed.
- X. F. Zheng, Z. Q. Liu, Q. Lian, H. Liu, L. Chen, L. Y. Zhou, Y. J. Jiang and J. Gao, ACS Sustainable Chem. Eng., 2021, 9, 12766–12778 CrossRef CAS.
- Y. Zhang, X. T. Jiang, J. J. Zhang, H. Zhang and Y. C. Li, Biosens. Bioelectron., 2019, 130, 315–321 CrossRef CAS PubMed.
- C. L. Su, Z. Y. Li, D. Zhang, Z. M. Wang, X. Zhou, L. F. Liao and X. L. Xiao, Biosens. Bioelectron., 2020, 148, 111819 CrossRef CAS PubMed.
- Z. Liu, Y. C. Zhang, C. C. Bian, T. Xia, Y. Gao, X. L. Zhang, H. M. Wang, H. Y. Ma, Y. Hu and X. Wang, Biosens. Bioelectron., 2019, 126, 51–58 CrossRef CAS PubMed.
- C. Ding, Q. Liu, P. Li, Y. S. Pei, T. T. Tao, Y. Wang, W. Yan, G. F. Yang and X. L. Shao, Food Chem., 2019, 274, 384–391 CrossRef CAS PubMed.
- K. Yan, A. M. J. Haque, P. Nandhakumar, A. Bhatia, N. S. Lee, Y. H. Yoon and H. Yang, Biosens. Bioelectron., 2020, 165, 112337 CrossRef CAS PubMed.
- J. F. Hernandez-Rodriguez, D. Rojas and A. Escarpa, Anal. Chem., 2021, 93, 167–183 CrossRef CAS PubMed.
- W. Q. Zhang, L. K. Zong, S. Q. Liu, S. Pei, Y. S. Zhang, X. M. Ding, B. Jiang and Y. P. Zhang, Biosens. Bioelectron., 2019, 131, 200–206 CrossRef CAS PubMed.
- G. F. Zhao, L. Yang, S. L. Wu, H. Zhao, E. Tang and C. P. Li, Biosens. Bioelectron., 2017, 91, 863–869 CrossRef CAS PubMed.
- Y. Song, Y. N. Luo, C. Z. Zhu, H. Li, D. Du and Y. H. Lin, Biosens. Bioelectron., 2016, 76, 195–212 CrossRef CAS PubMed.
- A. Ambrosi, C. K. Chua, A. Bonanni and M. Pumera, Chem. Rev., 2014, 114, 7150–7188 CrossRef CAS PubMed.
- H. B. Rao, Y. T. Liu, J. Zhong, Z. Y. Zhang, X. Zhao, X. Liu, Y. Y. Jiang, P. Zou, X. X. Wang and Y. Y. Wang, ACS Sustainable Chem. Eng., 2017, 5, 10926–10939 CrossRef CAS.
- L. Wang, T. J. Meng, G. S. Yu, S. S. Wu, J. J. Sun, H. X. Jia, H. Wang, X. J. Yang and Y. F. Zhang, Biosens. Bioelectron., 2019, 124, 53–58 CrossRef PubMed.
- S. N. Alam, N. Sharma and L. Kumar, Graphene, 2017, 06, 1–18 CrossRef CAS.
- Y. Z. He, J. Sun, D. X. Feng, H. Q. Chen, F. Gao and L. Wang, Biosens. Bioelectron., 2015, 74, 418–422 CrossRef CAS PubMed.
- G. T. Liu, H. F. Chen, G. M. Lin, P. P. Ye, X. P. Wang, Y. Z. Jiao, X. Y. Guo, Y. Wen and H. F. Yang, Biosens. Bioelectron., 2014, 56, 26–32 CrossRef CAS PubMed.
- M. Buleandra, A. A. Rabinca, C. Mihailciuc, A. Balan, C. Nichita, I. Stamatin and A. A. Ciucu, Sens. Actuators, B, 2014, 203, 824–832 CrossRef CAS.
- X. Kang, J. Wang, H. Wu, J. Liu, I. A. Aksay and Y. Lin, Talanta, 2010, 81, 754–759 CrossRef CAS PubMed.
- H. Du, J. Ye, J. Zhang, X. Huang and C. Yu, J. Electroanal. Chem., 2011, 650, 209–213 CrossRef CAS.
- B. Hossein, Afr. J. Pharm. Pharmacol., 2012, 6, 1298–1305 Search PubMed.
- B. Huang, C. Yao, J. Yang, S. Du and X. Lu, RSC Adv., 2020, 10, 43834–43839 RSC.
- Y. Kong, Y. Xu, H. Mao, C. Yao and X. Ding, J. Electroanal. Chem., 2012, 669, 1–5 CrossRef CAS.
- C. Salvo-Comino, I. Rassas, S. Minot, F. Bessueille, M. L. Rodriguez-Mendez, A. Errachid and N. Jaffrezic-Renault, Mater. Sci. Eng., C, 2020, 110, 110667 CrossRef CAS PubMed.
- H. Wang, Q. Hu, Y. Meng, Z. Jin, Z. Fang, Q. Fu, W. Gao, L. Xu, Y. Song and F. Lu, J. Hazard. Mater., 2018, 353, 151–157 CrossRef CAS PubMed.
- X. Wang, J. Luo, C. Yi and X. Liu, Electroanalysis, 2013, 25, 1907–1916 CrossRef CAS.
Footnotes |
| † Electronic supplementary information (ESI) available. See https://doi.org/10.1039/d2ra03900a |
| ‡ These authors contributed equally to this work. |
| This journal is © The Royal Society of Chemistry 2022 |


