 Open Access Article
A nitroreductase responsive and photoactivated fluorescent probe for dual-controlled tumor hypoxia imaging†
Jialong Xu‡
a,
Wenjing Zai‡a,
Qingsong Yea,
Qingqing Zhanga,
Wenqian Yia and
Jinhui Wu *abcd
*abcd
aState Key Laboratory of Pharmaceutical Biotechnology, Medical School, School of Life Sciences, Nanjing University, Nanjing 210093, China. E-mail: wuj@nju.edu.cn
bJiangsu Provincial Key Laboratory for Nano Technology, Nanjing University, Nanjing 210093, China
cJiangsu R&D Platform for Controlled & Targeted Drug Delivery, Nanjing University, Nanjing 210093, China
dInstitute of Drug R&D, Nanjing University, Nanjing 210093, China
First published on 23rd August 2022
Abstract
Tumor hypoxia has great importance in tumor progression and resistance to antitumor therapies. To precisely monitor tumor hypoxia, a controllable hypoxia imaging method is meaningful but still lacking. Herein, we develop a dual-controlled tumor hypoxia probe (TNB) by introducing a nitrophenol group and methyltetrazine group to the boron-dipyrromethene (BODIPY) dye. The fluorescence-quenching group nitrophenol is reduced to aminophenol by upregulated nitroreductase in hypoxic tumors, and the photocage methyltetrazine is cleaved by light irradiation. Hence the fluorescence of TNB is dual-controlled by hypoxia and photoactivation. We first evaluated TNB's potential for controllable hypoxia imaging in solution and tumor cells. The fluorescence of TNB under nitroreductase incubation and photoactivation increased more than 60 fold over that which was untreated or only treated with nitroreductase. Furthermore, results validate that TNB possesses photo-controllable activation features in tumor sections. We believe that the probe design based on enzyme and photoactivation responsiveness provides potential for spatiotemporal detection of other biomarkers.
Introduction
Due to rapid cell proliferation, increased metabolic activity and abnormal blood vessels, hypoxia is one of the most common features in tumors.1 Hypoxia has great importance in tumor progression and resistance to representative tumor therapies,2 such as chemotherapy,3 radiotherapy,4 sonodynamic therapy5 and photodynamic therapy.6 Therefore, it is meaningful to precisely monitor tumor hypoxia for identification of hypoxic tumors and prediction of tumor therapies.Tumor hypoxia is accompanied by increased levels of reductases such as nitroreductase (NTR),7 azoreductase and so on. A number of fluorophores responsive to these reductases have been reported for hypoxia imaging due to their non-invasiveness, high sensitivity and selectivity.7–9 Fluorescent molecules linked to nitro group are widely reported, their fluorescence is activated when nitro group is reduced to amine group by nitroreductase.8,10 Besides, fluorescent probes containing azo bond have attracted more and more attention as well, with azo bond broken into aniline derivatives by azoreductase for oxygen level detection.11 Nevertheless, precise control over these reductase-responsive probes in living cells is still lacking, limiting their dynamic imaging and tracking in complex biological systems.
Photocaging technology provides a promising strategy for well-controlled imaging with high spatial and temporal resolution.12 Photocages are light-responsive moieties and used to quench fluorescence in imaging processes.13 Upon light induced removal of the photolabile moieties, fluorescence is restored. Photocages have been reported for imaging in some molecular and cellular studies. For example, Yang14 and co-workers reported a sequential activated probe for light-controllable imaging of intracellular tyrosinase. Xiao and co-workers utilized tetrazine as the photocage for a boron-dipyrromethene (BODIPY) dye,13 quenching the fluorescence through bond energy transfer through-bond energy transfer (TBET) mechanism.15 Due to their potential to turn on the target with high temporal and spatial resolution, we suppose that photocaging technology might provide a precisely-controlled strategy in hypoxia detection as well.
Herein, we developed a nitroreductase responsive and photoactivated probe TNB for dual-controlled hypoxia imaging. TNB was designed by linking a BODIPY dye with a methyltetrazine group and a styryl substituent with nitro and hydroxyl group. Both methyltetrazine and nitrophenol are effective quenching groups in fluorophore designs. m-Nitrophenol could quench the fluorescence through the mechanism of photoinduced electron transfer (PET),16 and methyltetrazine could be used as a photocage to block fluorescence by the mechanism of TBET.13,17 In the presence of nicotinamide adenine dinucleotide (NADH), m-nitrophenol was reduced to m-aminophenol by upregulated nitroreductase (NTR) in hypoxic tumors, and then PET process was destructed. Methyltetrazine was photolyzed under blue light irradiation to produce nitrile, resulting in fluorescence light-on. In this way, we successfully realized dual-controlled fluorescence turn on by nitroreductase and visible light irradiation reduction for the detection of hypoxic tumors.
Results and discussion
Design and synthesis of probe TNB
The design of TNB was shown in Scheme S1.† We chose BODIPY as the fluorescence reporting unit because of its excellent photophysical and chemical stability, large molar absorption coefficient, and multiple easily modified chemical sites in the core.18 m-Nitrophenol was used as the response unit to NTR upregulated in hypoxic tumors, which would be reduced to aminophenol group by NTR and thus the PET process would be inhibited. Methyltetrazine unit was introduced into the molecule as the photocage, which could response to light activation.13,19 Hence the fluorescence would be blocked until the m-nitrophenol group was reduced and the methyltetrazine unit was cleaved, thus dual-controlled imaging by NTR in hypoxia and light activation was obtained. Detailed synthetic procedures and data of probe TNB were provided in Fig. S1–S9.† It was worth mentioning that we replaced anhydrous hydrazine with hydrazine hydrate to synthesize methyltetrazine BODIPY by optimizing the reaction conditions, and the column chromatography yield reached 28.7%. To the best of our knowledge, this is the highest yield for the synthesis of methyltetrazine BODIPY by replacing anhydrous hydrazine with safer hydrazine hydrate.13,15 The expected products TNN (product of TNB by nitroreductase induced nitro group reduction) (Scheme S2†) and CNN (product of TNN by light induced methyltetrazine cleavage) (Scheme S3†) were also synthesized and characterized by 1H NMR, 13C NMR and HR-MS spectra (Fig. S10–S18†).Characterizations of TNB and its products in solution under NTR and blue light activation
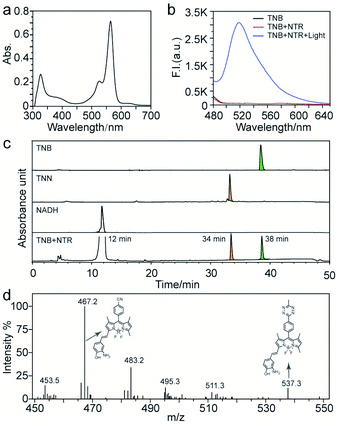
Probe TNB had a narrow absorption peak in the visible light range, and the maximum absorption wavelength was 572 nm (Fig. 1a). The absorbance of CNN at 400 nm is obviously higher than that of TNB and TNN (Fig. S19a†). Fluorescence emission spectroscopy was used to study the response of TNB to nitroreductase and blue light. TNB alone displayed almost no fluorescence (Fig. 1b, black). When NTR was added in the presence of NADH, the fluorescence had little change (Fig. 1b, red). Subsequently, under blue light irradiation, a new fluorescence peak appeared at 518 nm, which was consistent with the peak position of CNN in buffer solution (Fig. S20†), and the fluorescence intensity increased significantly by 66 times (Fig. 1b blue). The above experimental results showed that the fluorescence of probe TNB failed to recover in the sole presence of NTR, but it was significantly enhanced in the presence of both NTR-induced reduction and blue light irradiation.To demonstrate the reaction process of TNB activated by nitroreductase and blue light, we proposed a possible mechanism (as shown in Scheme 1) and verified it with below experiments. Photophysical images of compounds TNB, TNN, and CNN were shown in Fig. S19 and Table S1.† The fluorescence quantum yield of TNB (Φ = 0.0004) in ethanol was much lower than that of TNN (Φ = 0.004) and CNN (Φ = 0.035) (Table S1†), demonstrating that CNN has the best fluorescence potential among these three compounds. We then utilized high-performance liquid chromatography (HPLC) and mass spectrometry (MS) to analyse the products and expected products (TNN, CNN), HPLC analysis conditions as shown in Table S2.† The standard compounds NADH, TNB, and TNN had distinctly different retention time of 12, 38, and 34 min, respectively, as shown in Fig. 1c, while NTR did not show a peak under this condition. After TNB and NTR were mixed in the presence of NADH solution for 30 min, a new peak corresponding to that of TNN appeared at 34 min, indicating that TNN might be the exact downstream product of TNB after reduced with NTR. The photolysis product of TNN was further analysed by ESI-MS analysis. After blue light irradiation, the reaction product yielded an observed mass of 467.2, in agreement with the calculated mass of CNN ([M − H+] = 467.2, Fig. 1d), suggesting that CNN was truly the downstream product of TNN after photoactivation. All these experimental results demonstrated that TNB could be reduced to TNN by NTR, and TNN photoactivated to form CNN with blue light irradiation. m-Nitrophenol in TNB quenched the fluorescence through the mechanism of photoinduced electron transfer (PET),14–16 when m-nitrophenol was reduced to m-aminophenol by NTR, then PET process was destructed. While the fluorescence was still quenched until tetrazine was further photolyzed under blue light irradiation to destroy the TBET process for final fluorescence turn on.
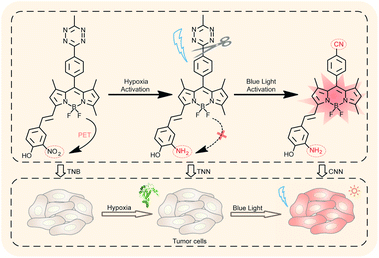 | ||
| Scheme 1 Illustrations for nitroreductase and photoactivatable responsive hypoxic tumor cell imaging. | ||
Kinetics response of TNB to NTR and blue light activation
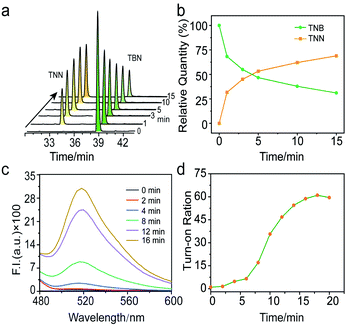
Since TNB has turned out to be a response fluorescent probe to NTR and blue light, the kinetics response between TNB, NTR and blue light were further investigated by HPLC and fluorescence emission spectroscopy. As shown in Fig. 2a, HPLC investigations exhibited that the reaction gradually reached equilibrium within 10 minutes after adding NTR in the presence of NADH, and the conversion yield was as high as 68% (Fig. 2b). After that, reaction solution was further irradiated with blue light, the fluorescence increased significantly and reached equilibrium within 15 minutes (Fig. 2c), with a maximum fluorescence increase of 66 folds compared to the original reaction solution (Fig. 2d).Cytocompatibility and fluorescence turn on of TNB in living tumor cells
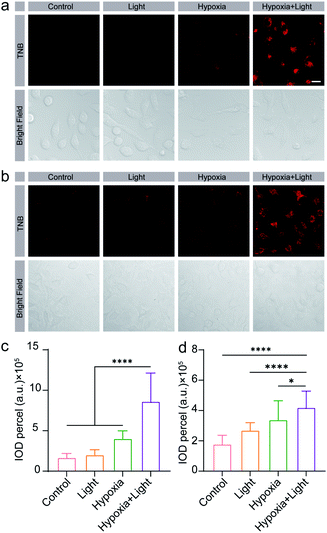
Due to the outstanding performance in dual-controlled fluorescence turn-on by nitroreductase reduction and light irradiation in vitro, we then examined the potential of TNB for controlled hypoxic tumor imaging in living cells.Firstly, we studied the cytocompatibility of TNB. TNB was incubated with HeLa cells and A549 cells under normoxia (20% O2), hypoxia (1% O2), and hypoxia (1% O2) plus illumination environments, respectively. Cell viabilities were detected through CCK-8 assays after 12 hours incubation with TNB (Fig. S21†). It was found that TNB treatment with 2–10 μM caused little damage to both cells (with viability >80% compared with control treatment in HeLa cells and A549 cells), demonstrating the reliable safety of TNB in living cells. After that, we evaluated the feasibility of TNB for fluorescence imaging in HeLa and A549 cells under hypoxia environments and blue light irradiation. HeLa and A549 cells were incubated with 5 μM TNB for 6 h at 37 °C under normoxia (20% O2), hypoxia (1% O2) or hypoxia (1% O2) combined with blue light irradiation. It was found that HeLa cells incubated with probe TNB under normoxia displayed no fluorescence, and very faint fluorescence signals were shown only with hypoxia treatment (Fig. 3a). In stark contrast, dramatically noticeable fluorescence was acquired with both hypoxia treatment and light irradiation. Similar fluorescence performance was also observed in A549 cells (Fig. 3b). To quantitatively assess the fluorescence intensity in HeLa cells, IOD (integral optical density) in the confocal microscopy images of HeLa cells was further analysed using Imagine J software (Fig. 3c). The IOD analysis of hypoxia group and hypoxia plus illumination group was approximately 1.7 times and 5.2 times of that of normoxia group. The IOD analysis results in A549 cells were similar to that in HeLa cells (Fig. 3d). It was found that the TNB probe could not achieve dual-response fluorescence light-on in normal HSF (human skin fibroblasts) and HUVEC (human umbilical vein endothelial) cell lines, Fig. S22.† The probe response required cells to overexpress nitroreductase. These results indicate that the fluorescence of TNB is dual-controlled by hypoxia and photoactivation. TNB is practical and useful for dual-controlled hypoxia imaging in living tumor cells.
Fluorescent imaging of hypoxia in vivo via intratumoral injection of probe TNB
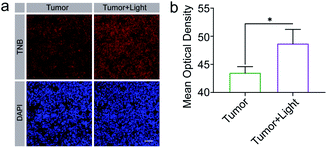
To test the capability of TNB for responsive fluorescent imaging of hypoxia tumor sections, we injected TNB into the 4T1 tumor-bearing mice intratumorally and performed the fluorescent imaging. Tumor tissue was collected one hour later, and 4T1 tumors were embedded with an cold cutting temperature compound (OCT) for the frozen section. All animal procedures were performed in compliance with the guidelines approved by the Institutional Animal Care and Use Committee of Nanjing University (IACUC-D2103041).As shown in Fig. 4a, it is obvious that, when TNB was injected intratumorally, shows only weak fluorescence in tumor sections; while after blue light irradiation, the fluorescence signal of the tumor section was enhanced, indicating that the probe could respond to light irradiation. Mean optical density statistical analysis further verified that there was a statistical difference between probe TNB before and after light response (Fig. 4b). Illumination did not induce fluorescence intensity changes in DAPI compared with TNB (Fig. S22†). Tumor cryosection results show that TNB also has the characteristics of responding to imaging hypoxia tumor sections.
Conclusions
In summary, we have developed a novel dual controlled fluorescent probe TNB for tumor hypoxia imaging. Turn-on of TNB was induced by both nitroreductase reduction and blue light irradiation. The fluorescence of TNB under nitroreductase incubation and photoactivation increased more than 60 folds than that untreated or only treated with nitroreductase. Moreover, cytotoxicity experiments confirmed the safety of TNB in living tumors and confocal fluorescence microscopy experiments showed that TNB co-incubated HeLa cells and A549 cells emitted remarkable fluorescence in hypoxia environment plus blue light irradiation. Moreover, we successfully observed fluorescence turn on in living hypoxic tumors under blue light irradiation. Thus, our probe TNB might provide potential for practical application in well-controlled tumor hypoxia imaging. Although the concept of dual response fluorescence light-on was confirmed in this study, the imaging ability in living life needs to be further optimized. In the future, we plan to use nano-emulsification techniques to better disperse probe molecules and improve imaging at the cell and tissue levels. It is worth mentioning that we also using a more safer method to synthesize methyltetrazine BODIPY. We believe that this strategy will break a new path for photoactivated fluorescence imaging.Conflicts of interest
There are no conflicts to declare.Author contributions
Jialong Xu designed the research. Jialong Xu, Qingsong Ye and Wenqian Yi performed the research. Jialong Xu, Qingqing Zhang analyzed the data. Wenjing Zai, Jialong Xu and Jinhui Wu wrote the paper.Acknowledgements
This work was supported by National Key R&D Program of China (2017YFA0205400); National Natural Science Foundation of China (No. 32171372, 31872755, 81872811); Jiangsu Outstanding Youth Funding (BK20190007). This paper was also supported by the Central Fundamental Research Funds for the Central Universities (021414380513), and the program A for Outstanding PhD candidate of Nanjing University (202102A004).Notes and references
- (a) C. Shao, F. Yang, S. Miao, W. Liu, C. Wang, Y. Shu and H. Shen, Mol. Cancer, 2018, 17, 120 CrossRef PubMed; (b) J. M. Brown and A. J. Giaccia, Cancer Res., 1998, 58, 1408–1416 CAS; (c) P. Xiao, C. Liu, T. Ma, X. Lu, L. Jing, Y. Hou, P. Zhang, G. Huang and M. Gao, Adv. Sci., 2021, 8, 2004044 CrossRef CAS PubMed; (d) V. Bhandari, C. Hoey, L. Y. Liu, E. Lalonde, J. Ray, J. Livingstone, R. Lesurf, Y. J. Shiah, T. Vujcic, X. Huang, S. M. G. Espiritu, L. E. Heisler, F. Yousif, V. Huang, T. N. Yamaguchi, C. Q. Yao, V. Y. Sabelnykova, M. Fraser, M. L. K. Chua, T. van der Kwast, S. K. Liu, P. C. Boutros and R. G. Bristow, Nat. Genet., 2019, 51, 308–318 CrossRef CAS PubMed; (e) Y. Li, Y. Sun, J. Li, Q. Su, W. Yuan, Y. Dai, C. Han, Q. Wang, W. Feng and F. Li, J. Am. Chem. Soc., 2015, 137, 6407–6416 CrossRef CAS PubMed.
- W. R. Wilson and M. P. Hay, Nat. Rev. Cancer, 2011, 11, 393–410 CrossRef CAS PubMed.
- J. Tan, X. Duan, F. Zhang, X. Ban, J. Mao, M. Cao, S. Han, X. Shuai and J. Shen, Adv. Sci., 2020, 7, 2003036 CrossRef CAS PubMed.
- I. Telarovic, R. H. Wenger and M. Pruschy, J. Exp. Clin. Cancer Res., 2021, 40, 197 CrossRef PubMed.
- J. Chen, H. Luo, Y. Liu, W. Zhang, H. Li, T. Luo, K. Zhang, Y. Zhao and J. Liu, ACS Nano, 2017, 11, 12849–12862 CrossRef CAS PubMed.
- Y. He, C. Cong, Y. He, Z. Hao, C. Li, S. Wang, Q. Zhao, H. He, R. Zhu, X. Li and D. Gao, Chem. Eng. J., 2019, 375, 122097 CrossRef.
- F. Xu, H. Li, Q. Yao, H. Ge, J. Fan, W. Sun, J. Wang and X. Peng, Chem. Sci., 2019, 10, 10586–10594 RSC.
- (a) N. Zhu, G. Xu, R. Wang, T. Zhu, J. Tan, X. Gu and C. Zhao, Chem. Commun., 2020, 56, 7761–7764 RSC; (b) Y. Jiao, L. Zhang, X. Gao, W. Si and C. Duan, Angew. Chem., Int. Ed. Engl., 2020, 59, 6021–6027 CrossRef CAS PubMed.
- (a) R. Peng, J. Yuan, D. Cheng, T. Ren, F. Jin, R. Yang, L. Yuan and X. Zhang, Anal. Chem., 2019, 91, 15974–15981 CrossRef CAS PubMed; (b) A. Chevalier, Y. Zhang, O. M. Khdour, J. B. Kaye and S. M. Hecht, J. Am. Chem. Soc., 2016, 138, 12009–12012 CrossRef CAS PubMed.
- (a) Y. Ji, Y. Wang, N. Zhang, S. Xu, L. Zhang, Q. Wang, Q. Zhang and H. Y. Hu, J. Org. Chem., 2019, 84, 1299–1309 CrossRef CAS PubMed; (b) N. Zhu, G. Xu, R. Wang, T. Zhu, J. Tan, X. Gu and C. Zhao, Chem. Commun., 2020, 56, 7761–7764 RSC; (c) J. Huang, Y. Wu, F. Zeng and S. Wu, Theranostics, 2019, 9, 7313–7324 CrossRef CAS PubMed.
- (a) X. Zhang, M. Wu, J. Li, S. Lan, Y. Zeng, X. Liu and J. Liu, ACS Appl. Mater. Interfaces, 2018, 10, 21909–21919 CrossRef CAS PubMed; (b) W. C. Geng, S. Jia, Z. Zheng, Z. Li, D. Ding and D. S. Guo, Angew. Chem., Int. Ed. Engl., 2019, 58, 2377–2381 CrossRef CAS PubMed.
- (a) M. Bojtar, A. Kormos, K. Kis-Petik, M. Kellermayer and P. Kele, Org. Lett., 2019, 21, 9410–9414 CrossRef CAS PubMed; (b) J. A. Peterson, C. Wijesooriya, E. J. Gehrmann, K. M. Mahoney, P. P. Goswami, T. R. Albright, A. Syed, A. S. Dutton, E. A. Smith and A. H. Winter, J. Am. Chem. Soc., 2018, 140, 7343–7346 CrossRef CAS PubMed; (c) M. Bojtár, K. Németh, F. Domahidy, G. Knorr, A. Verkman, M. Kállay and P. Kele, J. Am. Chem. Soc., 2020, 142, 15164–15171 CrossRef PubMed.
- A. Loredo, J. Tang, L. Wang, K.-L. Wu, Z. Peng and H. Xiao, Chem. Sci., 2020, 11, 4410–4415 RSC.
- S. Yang, J. Jiang, A. Zhou, Y. Zhou, W. Ye, D. S. Cao and R. Yang, Anal. Chem., 2020, 92, 7194–7199 CrossRef CAS PubMed.
- J. C. Carlson, L. G. Meimetis, S. A. Hilderbrand and R. Weissleder, Angew. Chem., Int. Ed. Engl., 2013, 52, 6917–6920 CrossRef CAS PubMed.
- S. Wang, H. Liu, J. Mack, J. Tian, B. Zou, H. Lu, Z. Li, J. Jiang and Z. Shen, Chem. Commun., 2015, 51, 13389–13392 RSC.
- D. Cao, L. Zhu, Z. Liu and W. Lin, J. Photochem. Photobiol., C, 2020, 44, 100371 CrossRef CAS.
- (a) Q. Zhang, Y. Cai, X. J. Wang, J. L. Xu, Z. Ye, S. Wang, P. H. Seeberger and J. Yin, ACS Appl. Mater. Interfaces, 2016, 8, 33405–33411 CrossRef CAS PubMed; (b) M. Meazza, C. M. Cruz, A. M. Ortuño, J. M. Cuerva, L. Crovetto and R. Rios, Chem. Sci., 2021, 12, 4503–4508 RSC; (c) S. Qi, N. Kwon, Y. Yim, V.-N. Nguyen and J. Yoon, Chem. Sci., 2020, 11, 6479–6484 RSC; (d) J. M. Franke, B. K. Raliski, S. C. Boggess, D. V. Natesan, E. T. Koretsky, P. Zhang, R. U. Kulkarni, P. E. Deal and E. W. Miller, J. Am. Chem. Soc., 2019, 141, 12824–12831 CrossRef CAS PubMed; (e) T.-I. Kim, H. Kim, Y. Choi and Y. Kim, Sens. Actuators, B, 2017, 249, 229–234 CrossRef CAS.
- (a) C. Wang, C. Liu, Q. Wei, L. Yang, P. Yang, Y. Li and Y. Cheng, Research, 2020, 2020, 6563091 CAS; (b) R. M. Hochstrasser, D. S. King and A. B. Smith, J. Am. Chem. Soc., 1977, 99, 3923–3933 CrossRef CAS; (c) M. J. Tucker, J. R. Courter, J. Chen, O. Atasoylu, A. B. Smith and R. M. Hochstrasser, Angew. Chem., Int. Ed., 2010, 49, 3612–3616 CrossRef CAS PubMed.
Footnotes |
| † Electronic supplementary information (ESI) available. See https://doi.org/10.1039/d2ra04004b |
| ‡ Co-first authorship. |
| This journal is © The Royal Society of Chemistry 2022 |

