 Open Access Article
Fabrication of an anion exchange membrane with textured structure for enhanced performance of direct borohydride fuel cells
Jinyang Weia,
Xubin Hana,
Xingxing Lia,
Haiying Qin *a,
Haoyong Yina,
Wen Zhanga,
Hualiang Nia and
Xue Wangb
aCollege of Materials and Environmental Engineering, Hangzhou Dianzi University, Hangzhou 310018, P. R. China. E-mail: hyqin@hdu.edu.cn
bDaqing Oilfield Construction Group Co., Ltd, Daqing, 163453, P. R. China
First published on 10th October 2022
Abstract
Developing electrolyte membranes with a simple preparation process and high performance is a top priority for the commercialization of fuel cells. Inspired by solar cell texturing to improve its conversion efficiency, this study prepares a textured membrane by increasing the roughness of a glass plate. The structures of the textured membrane and the flat membrane are characterized and compared. The membranes are assembled in fuel cells for performance testing. The surface area of the textured membrane is 1.27 times that of the flat membrane, which increases the size of the three-phase boundary in fuel cells. The maximum power density of the fuel cell using the textured membrane is 1.17 times of the cell using the flat membrane at 60 °C. The excellent performance of the cell using the textured membrane profit from the enlargement of the three-phase boundary. This work offers a simple way to develop outstanding-performance membranes by changing their surface roughness.
Introduction
Direct borohydride fuel cells (DBFCs) are fueled by NaBH4 solution and have attracted widespread attention owing to their high theoretical capacity (5.67 A h g−1), high energy conversion efficiency (91%), and using non-precious catalyst.1–4 In DBFCs, the electrochemical reaction occurs on a well-defined three-phase boundary. Oxygen molecules react with water molecules and electrons to generate hydroxyl (eqn (1)) with the help of a catalyst on the cathode/membrane interface, which is also known as the three-phase boundary in DBFCs.5 Then, the hydroxyl is transferred to the anode via AEM and reacts with the borohydride to generate electrons, which transport to the cathode to continue the whole reaction (eqn (2)).5 The rate of oxygen reduction reaction (ORR) is highly dependent on the supply of oxygen and electron, the departing of hydroxyl and the activity of a catalyst. It is universally acknowledged that the rate of ORR is the controlling step of the whole reaction in fuel cells. Therefore, the performance of the cell mostly depends on the ORR on the three-phase boundary.| 2O2 + 4H2O + 8e− → 8OH− | (1) |
| BH4− + 8OH− → BO2− + 6H2O + 8e− | (2) |
Therefore, to improve the ORR on the three-phase boundary, numerous efforts have been carried out. In general, oxygen is always humidified before it is introduced into the cell. Therefore, there is no need to consider the insufficient supply of oxygen and water. The main concern is the activity of catalysts and the separation of hydroxyl. Besides commercial Pt/C catalysts, several non-precious metal catalysts have been developed that exhibit good catalytic activity in ORR. In previous studies, our team synthesized a series of Co/N/C cathode catalysts.6–8 DBFCs using these catalysts exhibited preferable electrochemical properties compared to those using commercial Pt/C catalysts. A MnO2/C catalyst was also prepared and tested as a cathode catalyst for DBFCs using an anion exchange membrane (AEM).9 DBFC using MnO2/C exhibited a higher open-circuit voltage (0.88 V) than that using Pt/C (0.84 V). Chronoamperometry tests showed that the DBFC using MnO2/C (57.4 mA cm−2) presented a higher current density than that using Pt/C (28.9 mA cm−2). A Fe/N/C catalyst was treated by CF4 plasma to change as super-hydrophobicity from C–F covalent bond, which optimized the three-phase boundary microenvironment.10 The maximum power density (Pmax) of the fuel cells using the CF4 plasma-treated catalyst (214 mW cm−2) was much higher than those using untreated catalysts (56 mW cm−2).
In addition to enhancing the catalyst activity, enhancing the membrane ionic conductivity to promote hydroxyl transfer is also a key to improving the performance of DBFCs.11 By synthesizing poly(arylene ether sulfone)s with different branching degrees, the free volume of the membranes was enlarged.12 As a result, the branched membrane showed significantly better ionic conductivity (126 mS cm−1) than the linear membrane (96 mS cm−1) at 80 °C. The Pmax of the fuel cells using the branched membrane reached 160 mW cm−2, which was superior to that of the fuel cells using a linear membrane (111 mW cm−2).
Compared to the elaborate treatment mentioned above, increasing the area of the three-phase boundary may be another direct and effective method to improve cell performance. Texturization on the reflection surface of solar cells could improve the light trapping capacity significantly, thus increasing the conversion efficiency of solar cells.13–16 Inspired by the success of surface texturization in solar cells, it is an interesting question what will happen if the membrane is textured in DBFCs.
In this study, a membrane with a textured structure is designed to increase the three-phase boundary to increase the effective area for ORR. The textured membrane was prepared with the help of a rough glass plate. DBFCs using the textured membrane appeared to have relatively excellent performances, and the underlying mechanism was analyzed.
Results and discussion
Fig. 1a and b present the cross-section SEM images of both membranes. The profile of the flat membrane is straight, while that of the textured membrane is uneven. Fig. 1c and d show the AFM images of the surface of both membranes. The flat membrane exhibits a smooth surface with a fluctuation of only 0.084 μm. In comparison, the textured membrane exhibits a rough surface with a fluctuation of about 1 μm. The surface roughness increased from 0.005 μm for the flat membrane to 0.13 μm for a textured membrane. The real surface area per projected area is 25.3 μm2/25 μm2 and 32 μm2/25 μm2 for the flat membrane and textured membrane, respectively.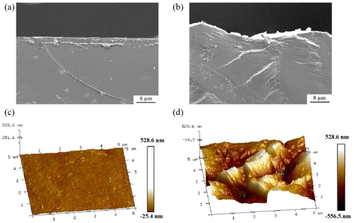 | ||
| Fig. 1 Cross-section SEM images of the (a) flat membrane and (b) textured membrane; AFM images of the (c) flat membrane and (d) textured membrane. | ||
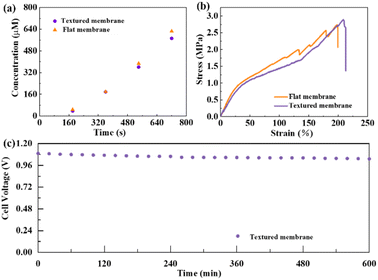
The borohydride ion concentration as a function of the time of the receiving compartment separated by the textured or flat membranes is shown in Fig. 2a. According to the slope, the fuel permeability of the textured membrane is calculated to be 2.01 × 10⁻⁶ cm2 s−1, which is a little lower than that of the flat membrane (2.18 × 10⁻⁶ cm2 s−1). Fig. 2b displays the tensile stress–strain curves of the textured and flat membranes. After soaking in 1 M KOH for 24 h, both membranes exhibit excellent plasticity and sufficient strength, confirming the good stability of membranes in sorbed conditions. The tensile strength of the textured membrane (2.89 MPa) is higher than that of the flat membrane (2.74 MPa), and the elongation of the textured membrane (209%) is also higher than that of the flat membrane (198%). The textured membrane exhibits better mechanical properties than the flat membrane in sorbed conditions. The stability of the DBFCs using the textured membrane is tested in the open circuit state (Fig. 2c). As shown in Fig. 2c, the degradation rate of the cell voltage is as low as ∼0.06% per hour. It demonstrates that the textured membrane possesses good stability.
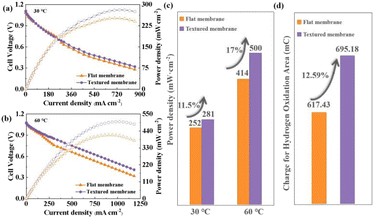
Fig. 3a–c shows the cell performances of DBFCs using different membranes at 30 °C and 60 °C. At 30 °C, the open circuit voltage (OCV) of the DBFC using the textured membrane (1.11 V) surpasses that of the DBFC using the flat membrane (1.09 V). When the temperature rises to 60 °C, the OCV of the DBFC using the textured membrane (1.08 V) still surpasses that of the DBFC using the flat membrane (1.07 V). The higher OCV resulted from the lower penetration of fuel, which suggests that the textured membrane should be more effective to inhibit fuel penetration. At 30 °C, the Pmax of the DBFCs using the textured membrane (281 mW cm−2) is better than that of the DBFC using the flat membrane (252 mW cm−2). When the operating temperature increases to 60 °C, the Pmax of the DBFCs using the textured membrane (500 mW cm−2) is still better than that of the DBFC using the flat membrane (414 mW cm−2). The DBFC using the textured membrane achieves greater performance. The improvement in Pmax is 11.5% at 30 °C and increases to 17% at 60 °C. In order to investigate the change in the three-phase boundary, the electrochemically active surface area (ECSA) of the cathode catalytic layer was measured by the hydrogen adsorption–desorption cyclic voltammetry (CV) test at room temperature.17 Fig. 3d shows that the charge for the hydrogen oxidation of the DBFC using the textured or flat membranes. The charge for the hydrogen oxidation of the DBFC using the textured membrane (695.18 mC) is 12.59% higher than that of the DBFC using the flat membrane (617.43 mC). Therefore, the ECSA of the DBFC using the textured membrane is also 1.13 times that of the DBFC using the flat membrane. This result is consistent with the improvement of the Pmax of the fuel cell using the textured membrane compared to that using a flat membrane. These results demonstrate that the improvement of cell performance benefits from the improvement of the three-phase boundary when the cell uses a textured membrane.
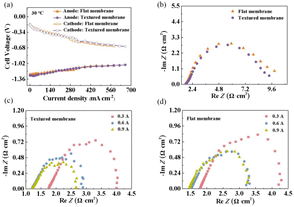
Polarization measurements (Fig. 4a) show that the DBFC using the textured membrane has smaller cathodic polarization than that using the flat membrane. The anodic polarization is almost the same for both DBFCs. The reason for this is that the textured structure appears only on one side, which fits with the cathode in the DBFC.
Fig. 4b–d shows the electrochemical impedance spectroscopy measurements of both DBFCs. Since the electrodes used in the DBFCs and the test conditions are identical, the different impedance results are mainly attributed to the difference in used membranes. The intersection of the Nyquist diagram with the real axis is the impedance loaded in the membranes of the DBFCs. In the open-circuit state (Fig. 4b), the DBFC using the textured membrane exhibits a smaller resistance (1.728 Ω) than that using the flat membrane (1.752 Ω). As the discharge current rises, the resistance of both tested DBFCs decreases. This phenomenon suggests that increasing the discharge current is beneficial to optimizing the reaction kinetics of the DBFCs. The DBFCs using textured membranes exhibit lower resistances than those using flat membranes at various discharging currents (Table 1).
| Membranes | Discharge current (A) | Rohm (Ω cm2) |
|---|---|---|
| a Data were obtained from the Nyquist plots of the DBFCs as shown in Fig. 4c and d. | ||
| Textured membrane | 0.3 | 1.752 |
| 0.6 | 1.206 | |
| 0.9 | 1.200 | |
| Flat membrane | 0.3 | 1.800 |
| 0.6 | 1.530 | |
| 0.9 | 1.458 | |
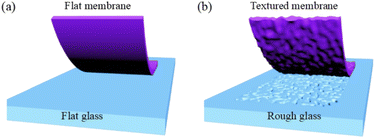
In this study, membranes are synthesized by casting a wet gel on the glass plates. Therefore, the final surface of the membrane facing the glass plates is determined by the plate surface. The flat glass plate results in the flat membrane and the rough glass plate results in the textured membrane. The real surface area of the textured membrane is 1.27 times of the flat membrane. The real surface area could be modulated flexibly by controlling the roughness of the glass plate. The increased real surface on the textured membrane produces more three-phase boundaries in the DBFC compared to the flat membrane. This advantage is shown in Fig. 5. Since the electrochemical reactions are carried on the three-phase boundary, the increased three-phase boundary is beneficial to increase the effective contact area to provide more reaction sites for electrochemical catalysis. That is why the DBFC using the textured membrane obtains better performance than that using the flat membrane. Similar situations were reported in other kinds of cells. The surface of an electrolyte was corroded with nitric acid, which increased the roughness from 0.28 μm to 0.77 μm.18 The protonic ceramic electrochemical cell using the corroded electrolyte got a Pmax value of 1.18 W cm−2 at 600 °C, which was 2.5-fold of the untreated electrolyte. An integrated stereo structure was designed to increase the three-phase boundary in the air electrode of zinc–air batteries.19 The batteries using the stereo electrode showed significantly improved bifunctional activity, smaller voltage changes, smaller polarization, and higher energy efficiency than the batteries using the planar electrodes. However, it is should be pointed out that the performance of DBFC could not be enhanced illimitably by continuously increasing plate roughness. The extreme rough surface may affect the mechanical properties of anion exchange membranes. Furthermore, it will lead to poor contact between the membrane and electrode when it is assembled in the fuel cell. The roughness of the substrate, the surface area of the membrane and its connection to the performance of DBFC need to be further explored.
 | ||
| Fig. 5 Schematic illustration of the ORR on the three-phase boundary of the (a) flat membrane and (b) textured membrane. | ||
Experimental
The anion exchange membranes were prepared as described in our previous work.20 CoCl2·6H2O and PVA (MW 57![[thin space (1/6-em)]](https://www.rsc.org/images/entities/char_2009.gif) 000–66
000–66![[thin space (1/6-em)]](https://www.rsc.org/images/entities/char_2009.gif) 000) was dissolved in de-ionized water at a weight ratio of 2
000) was dissolved in de-ionized water at a weight ratio of 2![[thin space (1/6-em)]](https://www.rsc.org/images/entities/char_2009.gif) :
:![[thin space (1/6-em)]](https://www.rsc.org/images/entities/char_2009.gif) 125. The mixture was stirred at 90 °C for 2 h to form a gel. When the temperature of the gel dropped to 40 °C, AER (Amberlite IRA-402(OH)) was added into the gel at a weight ratio of 1
125. The mixture was stirred at 90 °C for 2 h to form a gel. When the temperature of the gel dropped to 40 °C, AER (Amberlite IRA-402(OH)) was added into the gel at a weight ratio of 1![[thin space (1/6-em)]](https://www.rsc.org/images/entities/char_2009.gif) :
:![[thin space (1/6-em)]](https://www.rsc.org/images/entities/char_2009.gif) 2 with PVA and stirred evenly to form a composite polymer gel. The gel was then poured onto a smooth glass plate with a surface roughness of 0.005–0.006 μm (Fig. 6a). The flat membrane was formed by wet gels naturally drying at room temperature.
2 with PVA and stirred evenly to form a composite polymer gel. The gel was then poured onto a smooth glass plate with a surface roughness of 0.005–0.006 μm (Fig. 6a). The flat membrane was formed by wet gels naturally drying at room temperature.
The preparation method for the textured membrane differs from that used forthe flat membrane in that the wet gel was cast on a rough glass plate with a surface roughness of 2.3–3 μm (Fig. 6b). After drying, the thickness of the textured membrane and flat membrane were both 180–190 μm. The membranes were soaked in 1 M KOH solution for more than 24 h before being assembled in DBFCs, and the thickness of the membranes after immersing were both 200–210 μm.
A scanning electron microscope (SEM, Apreo S Hivac) was utilized to characterize the cross-section microstructure of the membranes. An atomic force microscope (AFM, Bruker Dimension Icon) was utilized to observe the surface microstructure of the membranes.
To test the electrochemical performance of the membranes, assembled a single cell that has an effective area of 6 cm2. The cathode and anode catalysts of the cell were Co(OH)2-PPy-BP, which had a load of 5 mg cm−2.21 The electrolytes within the cell were the textured membrane and flat membrane. The fuel flow rate was about 10 mL min−1, consisting of NaBH4 (5 wt%) and NaOH (10 wt%). The oxidizer was humidified oxygen, and the flow rate under 0.2 MPa was 100 mL min−1.
The fuel permeability of the as-prepared textured and flat membrane were tested in a side-by-side diffusion cell at room temperature, and the details regarding the measuring method could be found in our previous work.20 The tensile test was carried out on an electronic universal testing machine (CMTS5205) at room temperature to investigate the mechanical properties of the membranes.22 The utilized specimens were the membranes after soaking in 1 M KOH for 24 h. The strain speed was 25 mm min−1, and the gage length of specimens was approximately 55 mm.
The durability of the DBFCs using textured membrane was tested in the open circuit state for 10 h at 30 °C. Performances of the DBFCs using the textured membrane and the flat membrane were tested at 30 °C and 60 °C by a battery test system (Kikusui Electronics Corp.). The ECSA of the cathode catalyst layer was tested by hydrogen adsorption–desorption cyclic voltammetry (CV) through a CHI 733e station.23 The cathode was used as the working electrode, the anode as the reference and counter electrode. The cathode was purged with humidified argon at a flow rate of 100 mL min−1 for 1 h. Cathode voltammograms were measured in sequence within a scan rate of 100 mV s−1 at 30 °C.
Impedance tests were performed for the DBFCs by an electrochemical workstation (Zahner PP211) at room temperature at the frequency range of 0.01 Hz to 100 kHz and perturbing amplitude of 5 mV. The testing currents were 0.3, 0.6 and 0.9 A at ambient conditions.
Conclusions
A textured membrane was designed and synthesized by pouring a wet gel onto a rough-surfaced glass plate. The textured membrane has a surface roughness of 0.13 μm, while flat membrane has a roughness of only 0.005 μm. The real surface area per projected area of the textured membrane is 1.27 times that of the flat membrane. The textured membrane DBFCs have slightly higher open circuit voltages than the flat membrane DBFCs. The former achieves the Pmax values of 281 and 500 mW cm−2 at 30 and 60 °C, respectively. In comparison, the latter achieves the Pmax values of 252 and 414 mW cm−2 at 30 and 60 °C, respectively. The excellent performances of the DBFC with the textured membrane is attributed to the increased three-phase boundary, the reduced polarization and decreased resistance. This work provides a simple and effective strategy to improve cell performances by texturizing membranes.Conflicts of interest
The authors declare that they have no known competing financial interests or personal relationships that could have appeared to influence the work reported in this paper.Acknowledgements
This work is supported by the Zhejiang Provincial Natural Science Foundation of China (No. LZ22B060001). Thanks also to Dr Gan Jia (College of Material, Chemistry and Chemical Engineering, Hangzhou Normal University) for the assistance in drawing pictures.References
- M. Graśa and G. Lota, RSC Adv., 2021, 11, 15639–15655 RSC.
- Y. H. Chen, S. P. Wang and Z. P. Li, RSC Adv., 2020, 10, 29119–29127 RSC.
- B. Bayatsarmadi, A. Peters and P. Talemi, J. Power Sources, 2016, 322, 26–30 CrossRef.
- P.-Y. Olu, N. Job and M. Chatenet, J. Power Sources, 2016, 327, 235–257 CrossRef CAS.
- T. Kadioglu, A. C. Turkmen, K. C. Ata, R. G. Akay, I. Tikiz and C. Celik, Int. J. Hydrogen Energy, 2020, 45, 35006–35012 CrossRef CAS.
- H. Y. Qin, Z. X. Liu, W. X. Yin, J. K. Zhu and Z. P. Li, J. Power Sources, 2008, 185, 909–912 CrossRef CAS.
- H. Qin, S. Lao, Z. Liu, J. Zhu and Z. Li, Int. J. Hydrogen Energy, 2010, 35, 1872–1878 CrossRef CAS.
- Y. He, C. Zhu, K. Chen, J. Wang, H. Qin, J. Liu, S. Yan, K. Yang and A. Li, J. Power Sources, 2017, 339, 13–19 CrossRef CAS.
- C. Grimmer, M. Grandi, R. Zacharias, S. Weinberger, A. Schenk, E. Aksamija, F.-A. Mautner, B. Bitschnau and V. Hacker, J. Electrochem. Soc., 2016, 163, F885–F890 CrossRef CAS.
- X. Yin, L. Feng, W. Yang, Y. Zhang, H. Wu, L. Yang, L. Zhou, L. Gan and S. Sun, Nano Res, 2022, 15, 2138–2146 CrossRef CAS.
- M. H. Gouda, W. Gouveia, N. A. Elessawy, B. Šljukić, A. B. Nassr and D. M. F. Santos, Int. J. Hydrogen Energy, 2020, 45(30), 15226–15238 CrossRef CAS.
- D. Liu, M. Xu, M. Fang, J. Chen and L. Wang, J. Mater. Chem. A, 2018, 6, 10879–10890 RSC.
- F. Pelanchon and P. Mialhe, Sol. Energy, 1995, 54, 381–385 CrossRef.
- G. Hashmi, A. R. Akand, M. Hoq and H. Rahman, Silicon, 2018, 10, 1653–1660 CrossRef CAS.
- H. Nussbaumer, G. Willeke and E. Bucher, J. Appl. Phys., 1994, 75, 2202–2209 CrossRef.
- W. J. Yang, Z. Q. Ma, X. Tang, C. B. Feng, W. G. Zhao and P. P. Shi, Sol. Energy, 2008, 82, 106–110 CrossRef.
- S. J. C. Cleghorn, D. K. Mayfield, D. A. Moore, J. C. Moore, G. Rusch, T. W. Sherman, N. T. Sisofo and U. Beuscher, J. Power Sources., 2006, 158(1), 446–454 CrossRef.
- W. Bian, W. Wu, B. Wang, W. Tang, M. Zhou, C. Jin, H. Ding, W. Fan, Y. Dong, J. Li and D. Ding, Nature, 2022, 604(7906), 479–485 CrossRef PubMed.
- Z. Pei, L. Ding, C. Wang, Q. Meng, Z. Yuan, Z. Zhou, S. Zhao and Y. Chen, Energy Environ. Sci., 2021, 14, 4926–4935 RSC.
- H. Y. Qin, Y. P. Hu, C. Zhu, W. Chu, H. Sheng, Z. Dong, Y. He, J. Wang, A. G. Li, H. Z. Chi, H. N. Ni, Z. G. Ji and J. B. Liu, Electrochem. Commun., 2017, 77, 1–4 CrossRef.
- H. Y. Qin, Z. X. Liu, L. Q. Ye, J. K. Zhu and Z. P. Li, J. Power Sources, 2009, 192, 385–390 CrossRef.
- Y. Sun, J. Pan, L. Liu, Y. Fang, G. Han and J. Liu, J. Appl. Electrochem., 2022, 52(8), 1219–1230 CrossRef CAS.
- J. Xie, D. L. Wood, K. L. More, P. Atanassov and R. L. Borup, J. Electrochem. Soc., 2005, 152(5), A1011 CrossRef.
| This journal is © The Royal Society of Chemistry 2022 |

