 Open Access Article
N-doped carbon dots as robust fluorescent probes for the rapid detection of hypochlorite†
Kai Wang *a,
Zongling Rub,
Jiwei Shic,
Yuezhao Zhua,
Liguo Yanga,
Mengxue Weia,
Mengli Xiaoa,
Nana Liua and
Fang Wanga
aSchool of Chemical and Environmental Engineering, Anyang Institute of Technology, Anyang, 455000, China. E-mail: wangkevin07@163.com
bSchool of Materials Science and Engineering, Anyang Institute of Technology, Anyang, 455000, China
cShanghai Morimatsu Pharmaceutical Equipment Engineering Co. Ltd., No. 29 Jinwen Road, Pudong Area, Shanghai, 201323, China
First published on 26th September 2022
Abstract
Great advances have been made in the development of carbon dot (CD)-based fluorescent materials for the detection of hypochlorite in the past few years. However, developing new CDs with high quantum yield (QY) for the rapid detection of hypochlorite and gaining a deeper insight into the detection mechanism still need to be further investigated. Herein, N-doped carbon dots (NCDs) with high QYs, which can reach as high as 67%, were efficiently prepared employing citric acid and o-phenylenediamine as raw materials. Significantly, the NCDs could act as fluorescent probes for the rapid detection of hypochlorite and the limit of detection is calculated to be as low as 12.6 nM on the basis of fluorescent “on–off” effects upon the addition of hypochlorite. Furthermore, UV-vis absorption spectra, Density Functional Theory (DFT) calculations and kinetic analysis of fluorescence (FL) decay were used to investigate the detection mechanism. The results indicate that the electron transfer (ET) process from NCDs to imine-functionalized NCDs (imine-NCDs) and the higher energy gap of imine-NCDs will facilitate the excited-energy of NCDs to be dissipated in the form of a non-radiative decay procedure, resulting in a static quenching mechanism. Therefore, these observations are useful in deepening the understanding of the hypochlorite induced FL quenching mechanism and thereby developing oxidative stress-related detection materials.
1. Introduction
Hypochlorite (ClO−) and hypochlorous acid (HClO) are powerful oxidants and have been extensively used as disinfectants in treating water.1 In biological systems, ClO−/HClO act as an effective antimicrobial oxidant for neutrophils to protect the host when microorganisms invade by causing the host to generate innate immunity.2 However, excessive hypochlorite in the human body can cause oxidative stress-related pathological events, such as lung injury, pathogen invasion, cardiovascular diseases, wound regeneration and so on.3–5 Thus, it is very meaningful to study the detection of hypochlorite in water samples. Recently, several approaches for the detection of hypochlorite have been reported, including spectrophotometry, electrochemical analysis, colorimetric assays, spectrofluorimetry, etc. Compared with other strategies, the fluorescent method has attracted considerable attention due to its superior properties of facile operation, rapid response and high sensitivity, in particular the advantages of detecting a targeted-analyte in a non-invasive way and realizing online real-time monitoring in biological systems.6 In recent years, many fluorescent probes, including small organic molecules, metal nanoclusters and semiconductor nanocrystals, have been proposed for the detection of hypochlorite in tap water, and cells, and even in tissue and vivo systems.7–9 However, despite the substantial developments, these reported fluorescent probes usually either suffer from the problems of complicated organic synthesis of fluorescent molecules or need help with the coordination interaction between heavy metal (or toxic metal compound) and ligands, which greatly limit their further applications.10 Therefore, developing green and facile fluorescent materials for the hypochlorite detection is still highly desirable.Carbon dots (CDs), as a kind of emerging star nanomaterials, have attracted tremendous interests especially in the field of ions/molecules detection, catalysis and bioimaging due to their low toxicity and excellent optical properties.11–16 At present, it is reported that CDs exhibit great potential as anion sensors for hypochlorite and hypochlorous acid.17–21 For example, Yin et al. prepared CDs with a quantum yield (QY) of 19.3% to detect hypochlorite employing sweet pepper as the raw material.22 Hu et al. synthesized CDs using ethanol and hydrogen peroxide as the precursors. The system was sensitive to hypochlorite with a detection limit of 0.08 μM.23 Shi et al. reported nitrogen and sulfur co-doped CDs using citric acid (CA) and glutathione (GSH) as carbon source and nitrogen source, respectively. The FL intensity of CDs decreased when the hypochlorite was added to the system.24,25 Qi et al. presented N-doped CDs using CA and ethylenediamine (EDA) as the raw materials. The N-doped CDs can serve as FL sensors to detect hypochlorite with the detection limit of 0.43 μM.26 In addition, Xia group fabricated color tunable “multicenter-emitting” CDs employing m-aminophenol as the carbon source.27 The colors of CDs solution changed from yellow-green to blue upon the addition of HClO, the process of dynamics monitoring oxidative stress was observed in vivo as well. However, most of these CDs possess low QYs. Consequently, developing new CDs with high QYs for the rapid detection of hypochlorite and gaining a deeper insight into the detection mechanism still need to be further investigated.
In this study, N-doped CDs (NCDs) with high QYs, which can reach as high as 67%, were efficiently synthesized by hydrothermal method based on citric acid and o-phenylenediamine derivatives as raw materials. Moreover, the resultant NCDs can serve as a robust fluorescent switch for the rapid detection of hypochlorite by “mixing and testing” approach avoiding complicated organic synthesis or coordination interaction between toxic metals compounds and ligands. In addition, the detecting mechanism for hypochlorite was investigated with the help of kinetic analysis of fluorescence decay and theoretical calculations.
2. Experimental section
2.1 Materials
Citric acid, o-phenylenediamine, 4-trifluoromethyl-o-phenylenediamine, 4-methoxy-o-phenylenediamine, 4-nitro-o-phenylenediamine, quinine sulphate, sodium hypochlorite were purchased from Macklin Biochemical Ltd. CuSO4, H2O2, Na2S2O3, NaOAc, NaNO3, NaNO2, NaCl, NaBr, FeCl3, KI were obtained from Energy Chemical. AgNO3 was purchased from Tianjin Chemical Reagent Factory.2.2 Instruments
The morphology and size of NCDs were measured with a transmission electron microscopy (JEM-2100F and Talos F200S) accompanied by an acceleration voltage of 200 kV. Atomic force microscopy (AFM) was carried out by tapping-mode on the MFP-3D Infinity. FTIR spectra were conducted on the Nicolet iS10 spectrometer. The X-ray diffractometer (XRD) spectra of the samples were obtained on the Rigaku (miniflex) powder X-ray diffractometer with CuKα radiation (λ = 0.1540 nm). Ultraviolet-visible (UV-vis) spectra were recorded with a Shimadzu UV-3100 instrument. Fluorescence spectra (FL) were measured by a Hitachi F-7000 fluorescence spectrophotometer. Time-resolved fluorescent spectra were measured with a FLS980 (Edinburg) steady-transient fluorescence spectrometer, using the time-correlated single-photon counting (TCSPC) system. The samples were excited by a 370 nm picoseconds diode laser (2 MHz repetition rate), and the statistics results were analyzed by reconvolution fit.2.3 Synthesis of NCDs
Citric acid (0.50 g, 2.6 mmol) and o-phenylenediamine (0.5 g, 4.6 mmol) were dispersed in 20 mL deionized water. Then, the solution was transferred to a poly(tetrafluoroethylene) autoclave (50 mL), and heated at 180 °C for 6 h. Afterwards, the autoclave was cooled to room temperature naturally. The crude products were centrifuged (at 10![[thin space (1/6-em)]](https://www.rsc.org/images/entities/char_2009.gif) 000 rpm for 10 min) and filtered with 0.22 μm filter membrane to remove agglomerated larger particles. The filtrate was dialyzed with dialysis membrane (MWCO: 1000 Da) for 24 h to get rid of salt and impurities. Finally, the sample was freeze-dried to obtain NCDs with the yields of 11% approximately.
000 rpm for 10 min) and filtered with 0.22 μm filter membrane to remove agglomerated larger particles. The filtrate was dialyzed with dialysis membrane (MWCO: 1000 Da) for 24 h to get rid of salt and impurities. Finally, the sample was freeze-dried to obtain NCDs with the yields of 11% approximately.
For comparison, other N-doped CDs were prepared with citric acid and o-phenylenediamine derivatives as the raw materials under the same conditions.
2.4 Fluorescence detection of hypochlorite with NCDs
NCDs solutions with the concentration of 10 μg mL−1 were prepared using deionized water firstly. Then different concentrations of hypochlorite solutions (12.3 μM and 123 μM) was separately added into NCDs solutions (10 μg mL−1, 2 mL). Thus, the concentrations of hypochlorite in the mixed solutions were 123 nM, 246 nM, 492 nM, 738 nM, 984 nM, 1.23 μM, 1.48 μM, 1.97 μM, 2.71 μM, 4.08 μM, 5.17 μM, 6.15 μM, 7.25 μM respectively. The FL intensity of each mixed solutions after incubation for 30 seconds were measured at the excitation wavelength of 370 nm.The selectivity measurements of the sensing system were carried out by detecting the FL intensity of NCDs (10 μg mL−1, 2 mL) with different interfering species (Cu2+, H2O2, S2O32−, AcO−, NO2−, NO3−, Cl−, Br−, ClO−, Ag+, Fe3+ and I−). The concentration of various interfering species was 7.25 μM.
2.5 Density functional theory (DFT) calculation
All calculations were carried out with the Gaussian 16 software. The BP86 functional and 6-311G(d) basis set were adopted for all the theoretical calculations. The visualization of the orbitals for each molecule were achieved using VMD software. Then the vibrational spectrum of each molecule was obtained at the same level of theory to ensure that all structures correspond to true minima of the potential energy surface. Meanwhile, the lowest unoccupied molecular orbital (LUMO) and highest occupied molecular orbital (HOMO) were calculated, the relative energy gaps (Egap) were obtained thereby.3. Results and discussion
3.1 Characterization of the NCDs
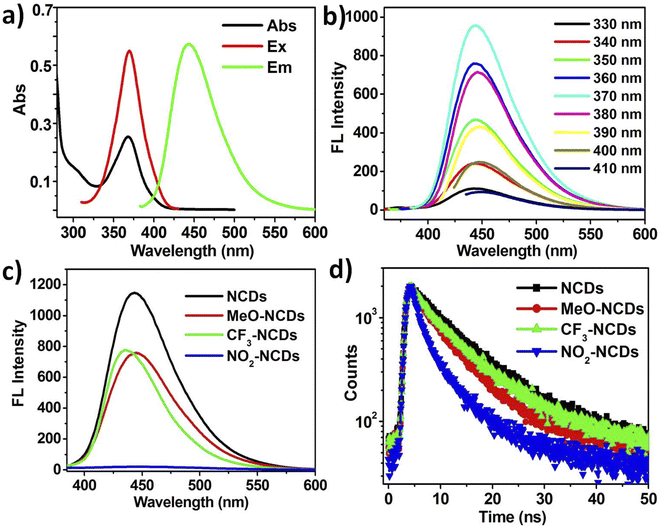
The four N-doped CDs were prepared through hydrothermal method with citric acid as the carbon source and o-phenylenediamine derivatives as the nitrogen source (Scheme 1). N-doped CDs with o-phenylenediamine as the N-dopant (NCDs) possess the highest quantum yield (QY), which can reach as high as 67.0%. Upon changing the substituent groups of o-phenylenediamine derivatives, the QYs of other three CDs are determined to be 40.7%, 42.4% and 0.5% for MeO-NCDs, CF3-NCDs and NO2-NCDs, respectively (Fig. S1, ESI†). The morphologies of NCDs were characterized by transmission electron microscopy (TEM) and atomic force microscopy (AFM). Representative TEM image show that the NCDs well separated from each other and their sizes range from 3 to 7 nm with an average diameter of 5.0 ± 0.5 nm by randomly measuring 200 nanoparticles (Fig. 1a and b). However, the high-resolution TEM image (HRTEM) of NCDs shows that rare particles with well-resolved lattice fringes are observed and there exist many amorphous carbon particles without any lattices in the NCDs structures (Fig. 1a inset and Fig. 1b). The average height of NCDs nanoparticles is 4 nm by AFM measurement, which is consistent with TEM result (Fig. 1c and d). | ||
| Scheme 1 The preparation of four N-doped CDs and the application in the hypochlorite detection based on the FL switch of NCDs. | ||
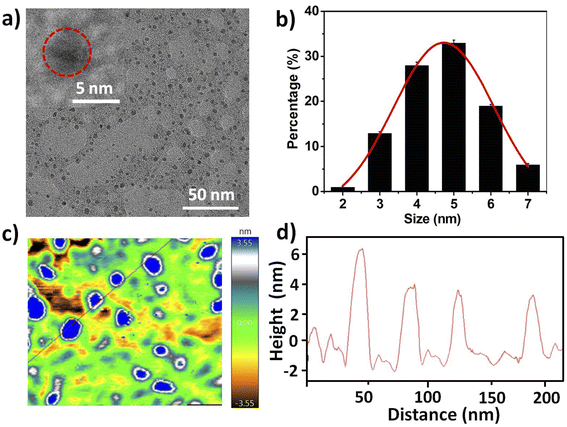 | ||
| Fig. 1 (a) TEM image of prepared NCDs (inset: HRTEM image of NCDs). (b) Size distribution of NCDs. (c and d) AFM image of NCDs and the height profile along the line. | ||
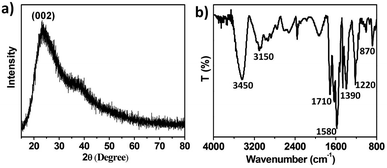
XRD pattern presents a typical broad diffraction peak situated at around 24° (002 plane), which is associated with the graphene structure (Fig. 2a).23 In addition, the surface functional groups in NCDs were further detected through Fourier transform infrared (FTIR) spectra (Fig. 2b). The broad and strong stretching vibration band of O–H and N–H groups are observed at 3450 cm−1. The weak peaks at around 3150 cm−1 are ascribed to the stretching vibrations of aromatic ring (Ar)–H. The peaks at about 1710 cm−1 are attributed to the stretching vibration of carbonyl (C![[double bond, length as m-dash]](https://www.rsc.org/images/entities/char_e001.gif) O) bonds of COOH. The peaks at 1580 cm−1 are ascribed to the C
O) bonds of COOH. The peaks at 1580 cm−1 are ascribed to the C![[double bond, length as m-dash]](https://www.rsc.org/images/entities/char_e001.gif) C or C
C or C![[double bond, length as m-dash]](https://www.rsc.org/images/entities/char_e001.gif) N stretching vibrations of nitrogen-heteroatomic aromatic ring (e.g., pyridinic, pyrrolic). Besides, the absorption bands range from 1220 to 1000 cm−1 correspond to C–O–C groups. The peak at 870 cm−1 belongs to the N–H deformation vibration. Consequently, the analysis of FT-IR spectra indicate that NCDs possess a large quantity of functional groups, such as OH, COOH, NH2, C(
N stretching vibrations of nitrogen-heteroatomic aromatic ring (e.g., pyridinic, pyrrolic). Besides, the absorption bands range from 1220 to 1000 cm−1 correspond to C–O–C groups. The peak at 870 cm−1 belongs to the N–H deformation vibration. Consequently, the analysis of FT-IR spectra indicate that NCDs possess a large quantity of functional groups, such as OH, COOH, NH2, C(![[double bond, length as m-dash]](https://www.rsc.org/images/entities/char_e001.gif) O)NH–, on their surface.28,29
O)NH–, on their surface.28,29
3.2 Optical properties of the NCDs
The UV-vis absorption and photoluminescence (PL) spectra of NCDs are shown in Fig. 3a. Notably, the distinct absorption peak locating at 370 nm is observed, which can be assigned to C–N/C–O n–π* transition.30,31 Both the excitation and emission spectra of NCDs are well-defined, the emission peak is located at 445 nm upon the excitation wavelength at 370 nm. Additionally, the PL emission spectra of NCDs shows excitation-independent behavior when the excitation wavelength ranges from 330 nm to 410 nm with an interval of 10 nm. As shown in Fig. 3b, the fluorescence (FL) intensity gradually increases on varying the excitation wavelength from 330 nm to 370 nm with 10 nm increment and followed by a decrease when the excitation wavelength is further increased. As a result, the optimal excitation and emission wavelengths of NCDs are 370 nm and 445 nm, respectively. Compared with other three CDs (MeO-NCDs, CF3-NCDs and NO2-NCDs), NCDs possess the highest FL intensity under the respective optimal excitation wavelength and the same absorption values of 0.03 (Fig. 3c).Fluorescence lifetime (τ) is a significant factor to evaluate the photoluminescence efficiency of luminescent materials.32 The fluorescence lifetime (τ) of four CDs (NCDs, MeO-NCDs, CF3-NCDs and NO2-NCDs) were measured through time-resolved fluorescence employing time-correlated single photon counting (TCSPC) technique (excitation wavelength at 370 nm). The decay curves of four CDs were obtained through biexponential functions fitting. The average lifetime of NCDs, which have two components: 11.62 ns (ca. 59.08%) and 6.11 (ca. 40.92%), is calculated about 9.48 ns (Fig. 3d). In addition, the average lifetimes for other three CDs are 7.21 ns (MeO-NCDs), 8.60 ns (CF3-NCDs) and 5.54 ns (NO2-NCDs), respectively (Fig. 3d).
3.3 Selective and sensitive detection of hypochlorite
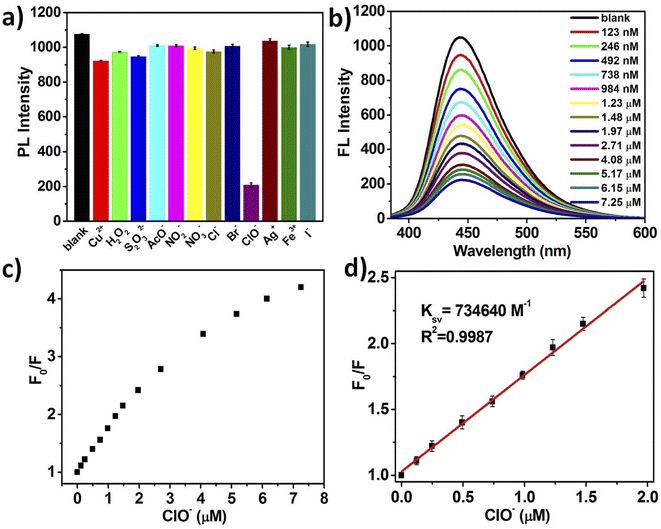
Under the optimized conditions, the detection capability of NCDs for the hypochlorite was evaluated utilizing the simultaneous fluorescence change of NCDs system upon the addition of different analytes. As shown in Fig. 4a, various oxidants (or anions) including blank, Cu2+, H2O2, S2O32−, AcO−, NO2−, NO3−, Cl−, Br−, ClO−, Ag+, Fe3+ and I− at a concentration of 7.25 μM were added into the fluorescent NCDs solutions, respectively. The performed fluorescence study displays that ClO− had the greatest FL quenching effect among the all tested ions while other eleven interfering species have no apparent FL quenching, indicating that NCDs possess excellent selectivity toward ClO−. These results demonstrate that NCDs can serve as a environment-responsive fluorescent probe for the highly selective ClO− monitoring.Furthermore, the sensitivity of NCDs for hypochlorite detection was investigated by means of FL titration. The FL intensity of NCDs at 445 nm decreases sharply at the initial stage (0–1.97 μM) and declines more slowly at the latter stage (1.97–7.25 μM) upon the addition of ClO− (Fig. 4b). In addition, the relationship between FL intensity of NCDs (F0/F) and the concentration of ClO− is analyzed (Fig. 4c), which is fitted to the Stern–Volmer equation, F0/F = 1 + Ksv [ClO−], where F0 and F represent the FL intensities of NCDs at 445 nm before and after ClO− addition respectively, Ksv is quenching constant, [ClO−] is the concentration of added ClO−.33 As shown in Fig. 4d, the result displays a good linear correlation between the F0/F and concentration of ClO− in the range of 0.13–1.97 μM. However, the experimental data deviate from the ideal linearity upon the addition of ClO− at high concentrations, which is caused by the following reasons. Firstly, the static quenching process is one of the possible reasons for the deviation from the linear relationship shown in the Stern–Volmer equation. Secondly, the quenching process is no longer bimolecular reaction between excited state of NCDs and ClO− at relative high concentrations. As for the NCDs with multi-functional groups on the surface, the electron transfer process may take place more than one surface reaction site with the increase of ClO− concentration. Moreover, the limit of detection (LOD) is estimated to be 12.6 nM on the basis of standard deviation rule (LOD = 3σ/S), where σ is the standard deviation of 10 blank samples and S represents the slope of fitted curve.34 Consequently, the results suggest that the NCDs as the fluorescent switches exhibit superior sensitive for the hypochlorite detection.
3.4 Investigation of detection mechanism
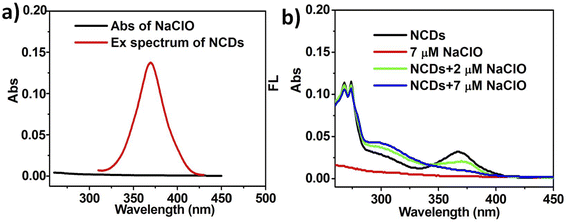
UV-vis absorption spectra analysis is an important technique to investigate the FL quenching mechanism between NCDs and hypochlorite. As shown in Fig. 5a, no obvious overlap between the absorption spectrum of NaClO and excitation spectrum of NCDs is observed, which demonstrates that ClO− do not absorbed the excited light of NCDs directly, avoiding the FL quenching of NCDs induced by inner filter effect (IFE) thereby.35 The absorption peak at 370 nm of NCDs is disappeared gradually upon the addition of different concentration of ClO− (from 2 μM to 7 μM) and the absorption band centered at 310 nm enhances simultaneously (Fig. 5b). These results indicate that the chromophores of NCDs are oxidized and ground-state complex are formed.36 However, a rise of temperature can not cause the remarkable change in the UV-vis absorption spectra of mixed system in the presence of NCDs (10 μg mL−1) and NaClO (7 μM), which suggests that the ground-state complex is stable and not destroyed in the condition (Fig. S2, ESI†).37To further address the detection mechanism, the molecular geometries and molecular orbital energy levels for NCDs and imine-functionalized NCDs (imine-NCDs) in water (298.15 K) were obtained employing Density Functional Theory (DFT) calculations.
According to the reaction mechanism of NCDs, functionalized 2-pyridones 1 and corresponding reaction product 2 are proposed as the most possible fluorophore units for NCDs and imine-NCDs.38,39 The optimized molecular geometries of fluorophore units 1 and 2 are shown in Fig. 6a and b. Meanwhile, the energy gap (Eg) of 1 is calculated to be 2.187 eV on the basis of its HOMO energy (−4.843 eV) and LUMO energy (−2.655 eV). As shown in Fig. 6c, the LUMO level (ELUMO = −3.330 eV) of 2 is obviously lower than that (ELUMO = −2.655 eV) of 1, which indicates that the electron transfer (ET) process easily take place from excited electron of 1 in its LUMO to the LUMO of 2.40 While the energy gap of 2 (Eg = 2.579 eV) is much higher than that of 1, manifesting that it is difficult for the excited electrons return to ground state in the form of fluorescence radiation (Fig. S3, ESI†). Moreover, ET phenomenon between 1 and 2 can be observed from UV-vis absorption spectra (Fig. 5b). The absorption peak of NCDs at 370 nm is blue-shifted with the appearance of absorption band centered at 310 nm upon the addition of ClO−. As a result, synergistic effect of the ET process and higher energy gap of imine-NCDs plays a vital role for the FL quenching.
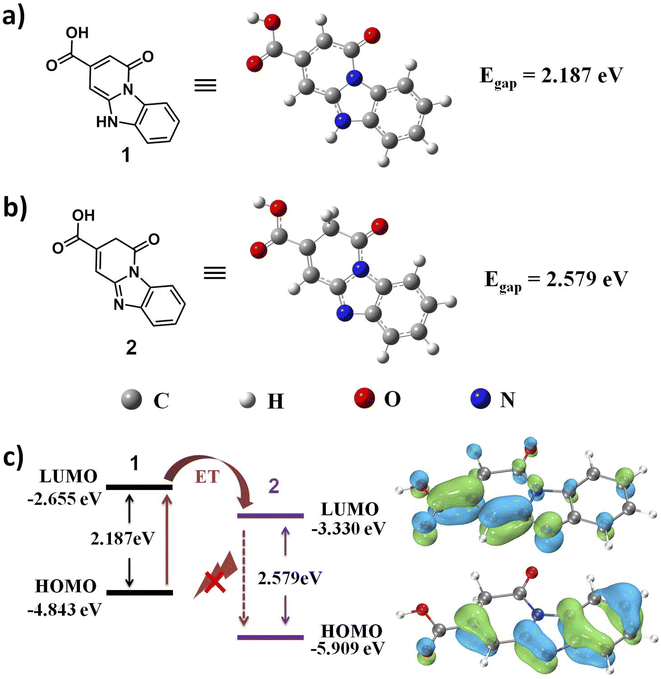 | ||
| Fig. 6 (a) The optimized structure of fluorophore unit 1 of NCDs. (b) The optimized molecular geometry of fluorophore unit 2 of imine-NCDs. (c) HOMO–LUMO energy levels of 1 and 2, respectively. | ||
The mechanism for FL quenching was further explored by the analysis of time-resolved fluorescence decay measurements, which were used to investigate the excitation behavior of NCDs in the absence and presence of ClO−.41 As shown in Fig. 7, the emission of blank NCDs exhibits biexponential decay with an mean lifetime of τ = 9.48 ns (ΦF = 67%). Subsequently, the radiative decay rate (kr) and non-radiative decay rate (knr) of NCDs can be calculated to be 7.07 × 10⁷ s−1 and 3.48 × 10⁷ s−1, respectively. When 615 nM ClO− is added to the NCDs solutions, the QY of NCDs system drops from 67% to 50.4%, while the average lifetime of NCDs (τ = 9.14 ns) does not change obviously and the radiative decay rate of NCDs system decreases to be 5.51 × 10⁷ s−1. Upon the addition of 6.15 μM ClO−, the average lifetime of NCDs (τ = 9.14 ns) still does not change significantly, yielding a relatively lower radiative decay rate (kr = 2.96 × 10⁷ s−1) and much higher non-radiative decay rate (knr = 8.0 × 10⁷ s−1) compared to that of blank NCDs (Table 1).
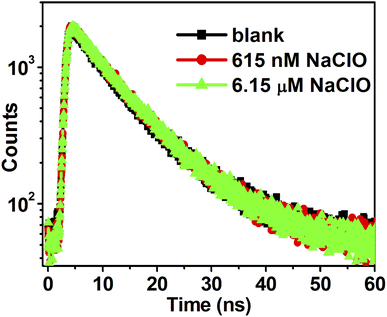 | ||
| Fig. 7 Time-resolved decay curves of NCDs (10 μg mL−1) in the absence and presence of different ClO− concentrations. | ||
At the molecular level, the FL emission intensity of fluorophore is greatly influenced by intramolecular and intermolecular interactions.42 In detail, the formation of complex between NCDs and imine-NCDs in the ground state would facilitate ET process from excited state of NCDs to LUMO of imine-NCDs, resulting in a non-radiative decay procedure. The nearly constant fluorescent lifetime suggests that the oxidative-stress induced FL quenching belongs to static quenching mechanism.43
3.5 Detection for free chlorine in tap water
The NCDs, as robust fluorescent probes, were applied for the free chlorine detection in tap water due to their excellent selectivity and sensitivity. As shown in Table 2, the concentration of ClO− in the tap water is detected to be 2.35 μM by means of dilution method (the test sample is diluted ten fold). Moreover, ClO− is measured according to the modified Stern–Volmer equation (F0/F = 1 + Ksv [ClO−]/10) along with the recoveries in the range from 97.2% to 108%, proving the rapid responses and accurate detection of this assay. These results demonstrate that this kind of carbon material could serve as a promising chemosensor for free chlorine detection in local tap water with rapid response and precision.| Sample | Addition (μM) | Measured (μM) | Recovery (%) | Replicate number | RSD (%) |
|---|---|---|---|---|---|
| 1 | 0 | 2.35 | — | 3 | 2.7 |
| 2 | 0.5 | 2.89 | 108 | 3 | 3.1 |
| 3 | 1.0 | 3.37 | 102 | 3 | 1.8 |
| 4 | 8.0 | 10.13 | 97.2 | 3 | 2.8 |
4. Conclusions
In summary, the NCDs were successfully prepared through hydrothermal method employing citric acid and o-phenylenediamine as the raw materials. The as-prepared NCDs were characterized by means of TEM, AFM, XRD, FTIR, UV-vis absorption, FL emission and FL lifetime measurements. Significantly, the NCDs can act as fluorescent probes for the rapid response and sensitive detection of hypochlorite. Meanwhile, the limit of detection is calculated to be as low as 12.6 nM on the basis of fluorescent “on–off” effects upon the addition of hypochlorite. Furthermore, UV-vis absorption spectra, DFT calculations and time-resolved FL decay analysis were used to investigated the detection mechanism. These results demonstrate that electron transfer process from NCDs to imine-NCDs and the higher energy gap of imine-NCDs will facilitate the excited-energy of NCDs to be dissipated in the form of non-radiative decay procedure, resulting in a static quenching mechanism. Moreover, the NCDs material were applied for free chlorine detection in local tap water with rapid response and accurate measurement. This work will pave a way for the development of hypochlorite detection materials and the treatment of oxidative stress induced diseases.Conflicts of interest
There are no conflicts to declare.Acknowledgements
This work was supported by the Natural Science Foundation of Henan Province (202300410010), the Scientific Cultivation Fund of Anyang Institute of Technology, the Innovation and Entrepreneurship Projects (202211330005) and the Key Laboratory of Subcritical High-Efficiency Extraction of Henan Province. We also thank Zhenyun Huang from Shiyanjia Lab (https://www.shiyanjia.com) for the help with DFT calculation on the detection mechanism.References
- W. A. Rutala and D. J. Weber, Clin. Microbiol. Rev., 1997, 10, 597–610 CrossRef CAS
.
- M. Ren, K. Zhou, L. He and W. Lin, J. Mater. Chem. B, 2018, 6, 1716–1733 RSC
.
- K. Shinagawa, A. Shiroshita-Takeshita, G. Schram and S. Nattel, Circulation, 2003, 107, 1440–1446 CrossRef CAS PubMed
.
- J. Perez-Vilar and R. C. Boucher, Free Radicals Biol. Med., 2004, 37, 1564–1577 CrossRef CAS PubMed
.
- K. L. Brown, C. Darris, K. L. Rose, O. A. Sanchez, H. Madu, J. Avance, N. Brooks, M.-Z. Zhang, A. Fogo, R. Harris, B. G. Hudson and P. Voziyan, Diabetes, 2015, 64, 2242–2253 CrossRef CAS PubMed
.
- S. Dong, L. Zhang, Y. Lin, C. Ding and C. Lu, Analyst, 2020, 145, 5068–5089 RSC
.
- Z. Han, L. Dong, F. Sun, L. Long, S. Jiang, X. Dai and M. Zhang, Anal. Biochem., 2020, 602, 113795–113802 CrossRef CAS
.
- X. Xiong, Y. Tang, L. Zhang and S. Zhao, Talanta, 2015, 132, 790–795 CrossRef CAS
.
- Y. Yan, S. Wang, Z. Liu, H. Wang and D. Huang, Anal. Chem., 2010, 82, 9775–9781 CrossRef CAS PubMed
.
- Q. Mei, W. Deng, W. Yisibashaer, H. Jing, G. Du, M. Wu, B. N. Li and Y. Zhang, Small, 2015, 11, 4568–4575 CrossRef CAS PubMed
.
- Y. Liu, H. Huang, W. Cao, B. Mao, Y. Liu and Z. Kang, Mater. Chem. Front., 2020, 4, 1586–1613 RSC
.
- W. Meng, X. Bai, B. Wang, Z. Liu, S. Lu and B. Yang, Energy Environ. Mater., 2019, 2, 172–192 CrossRef CAS
.
- X. Wei, J. Yang, L. Hu, Y. Cao, J. Lai, F. Cao, J. Gu and X. Cao, J. Mater. Chem. C, 2021, 9, 4425–4443 RSC
.
- D. Saini, A. K. Garg, C. Dalal, S. R. Anand, S. K. Sonkar, A. K. Sonker and G. Westman, ACS Appl. Nano Mater., 2022, 5, 3087–3109 CrossRef CAS
.
- P. Zhu, S. Wang, Y. Zhang, Y. Li, Y. Liu, W. Li, Y. Wang, X. Yan and D. Luo, ACS Appl. Bio Mater., 2022, 5, 2031–2045 CrossRef CAS PubMed
.
- W. Li, Y. Zhao, Y. Liu, M. Sun, G. I. N. Waterhouse, B. Huang, K. Zhang, T. Zhang and S. Lu, Angew. Chem., Int. Ed., 2021, 60, 3290–3298 CrossRef CAS PubMed
.
- L. Wang, J. Jana, J. S. Chung and S. H. Hur, Spectrochim. Acta, Part A, 2021, 260, 119895–119902 CrossRef CAS
.
- Y. Tang, Y. Su, N. Yang, L. Zhang and Y. Lv, Anal. Chem., 2014, 86, 4528–4535 CrossRef CAS
.
- J. Hao, L.-L. Huang, R. Zhang, H.-Z. Wang and H.-Y. Xie, Anal. Chem., 2012, 84, 8364–8370 CrossRef CAS PubMed
.
- H. Lee, Y.-C. Su, H.-H. Tang, Y.-S. Lee, J.-Y. Lee, C.-C. Hu and T.-C. Chiu, Nanomaterials, 2021, 11, 1831–1841 CrossRef CAS PubMed
.
- X. Pang, L. Li, P. Wang, Y. Zhang, W. Dong and Q. Mei, Microchem. J., 2021, 168, 106400–106406 CrossRef CAS
.
- B. Yin, J. Deng, X. Peng, Q. Long, J. Zhao, Q. Lu, Q. Chen, H. Li, H. Tang, Y. Zhang and S. Yao, Analyst, 2013, 138, 6551–6557 RSC
.
- Y. Hu, J. Yang, L. Jia and J.-S. Yu, Carbon, 2015, 93, 999–1007 CrossRef CAS
.
- L. Shi, G. Zhou, X. Xiang, Z. Zhang, Y. Jia, P. Liu and Z. Li, Spectrochim. Acta, Part A, 2020, 242, 118721–118728 CrossRef CAS
.
- R. Wang, R. Wang, D. Ju, W. Lu, C. Jiang, X. Shan, Q. Chen and G. Sun, Analyst, 2018, 143, 5834–5840 RSC
.
- H. Qi, Z. Zhai, X. Dong and P. Zhang, Spectrochim. Acta, Part A, 2022, 279, 121456–121464 CrossRef CAS PubMed
.
- Y. Wang, G. Guo, J. Gao, Z. Li, X. Yin, C. Zhu and Y. Xia, Chem. Mater., 2020, 32, 8146–8157 CrossRef CAS
.
- S. Pandit, S. Mondal and M. De, J. Mater. Chem. B, 2021, 9, 1432–1440 RSC
.
- F. Yuan, Z. Wang, X. Li, Y. Li, Z. a. Tan, L. Fan and S. Yang, Adv. Mater., 2017, 29, 1604436 CrossRef PubMed
.
- X.-W. Hua, Y.-W. Bao and F.-G. Wu, ACS Appl. Mater. Interfaces, 2018, 10, 10664–10677 CrossRef CAS PubMed
.
- H. Nie, M. Li, Q. Li, S. Liang, Y. Tan, L. Sheng, W. Shi and S. X.-A. Zhang, Chem. Mater., 2014, 26, 3104–3112 CrossRef CAS
.
- K. Wang, C. Geng, F. Wang, Y. Zhao and Z. Ru, RSC Adv., 2021, 11, 27645–27652 RSC
.
- G. Gao, Y.-W. Jiang, H.-R. Jia, J. Yang and F.-G. Wu, Carbon, 2018, 134, 232–243 CrossRef CAS
.
- T.-T. Xu, J.-X. Yang, J.-M. Song, J.-S. Chen, H.-L. Niu, C.-J. Mao, S.-Y. Zhang and Y.-H. Shen, Sens. Actuators, B, 2017, 243, 863–872 CrossRef CAS
.
- M. Wang, Y. Wan, K. Zhang, Q. Fu, L. Wang, J. Zeng, Z. Xia and D. Gao, Anal. Bioanal. Chem., 2019, 411, 2715–2727 CrossRef CAS PubMed
.
- S. Huang, L. Wang, C. Huang, J. Xie, W. Su, J. Sheng and Q. Xiao, Sens. Actuators, B, 2015, 221, 1215–1222 CrossRef CAS
.
- F. Zu, F. Yan, Z. Bai, J. Xu, Y. Wang, Y. Huang and X. Zhou, Microchim. Acta, 2017, 184, 1899–1914 CrossRef CAS
.
- J. Schneider, C. J. Reckmeier, Y. Xiong, M. von Seckendorff, A. S. Susha, P. Kasák and A. L. Rogach, J. Phys. Chem. C, 2017, 121, 2014–2022 CrossRef CAS
.
- W. Kasprzyk, S. Bednarz, P. Żmudzki, M. Galica and D. Bogdał, RSC Adv., 2015, 5, 34795–34799 RSC
.
- B. Ju, Y. Wang, Y.-M. Zhang, T. Zhang, Z. Liu, M. Li and S. Xiao-An Zhang, ACS Appl. Mater. Interfaces, 2018, 10, 13040–13047 CrossRef CAS
.
- K. Wang, C.-Y. Wang, Y. Zhang, S. X.-A. Zhang, B. Yang and Y.-W. Yang, Chem. Commun., 2014, 50, 9458–9461 RSC
.
- J. Zhang, B. Xu, J. Chen, L. Wang and W. Tian, J. Phys. Chem. C, 2013, 117, 23117–23125 CrossRef CAS
.
- G. Qiao, D. Lu, Y. Tang, J. Gao and Q. Wang, Dyes Pigm., 2019, 163, 102–110 CrossRef CAS
.
Footnote |
| † Electronic supplementary information (ESI) available. See https://doi.org/10.1039/d2ra04477c |
| This journal is © The Royal Society of Chemistry 2022 |

