 Open Access Article
Characteristics and performance studies of a composite polymer electrolyte membrane based on chitosan/glycerol–sulfosuccinic acid modified montmorillonite clay
Yohana Ivana Kedang ab,
Arif Priyanggaa,
Lukman Atmaja
 *a and
Mardi Santoso
 a
a
aDepartment of Chemistry, Faculty of Science, Institut Teknologi Sepuluh Nopember, Surabaya 60111, Indonesia. E-mail: lukman_at@chem.its.ac.id
bDepartment of Chemistry, Agriculture Faculty, Universitas Timor, Kefamenanu 85613, Indonesia
First published on 27th October 2022
Abstract
In this study, chitosan (CS) doped sulphosuccinic acid (SSA)–glycerol (Gly) and modified montmorillonite clay (MMT) were successfully fabricated. The membranes were prepared using the solution casting method. Analysis of morphology and topography using scanning electron microscopy (SEM) and atomic force microscopy (AFM) revealed that the composite membrane with 3 wt% MMT filler, namely CS/MMT-1, possessed the most adequate surface roughness compared to the other fabricated membranes. Furthermore, mechanical characterization of the CS/MMT-1 composite membrane showed that the membrane achieved satisfactory mechanical strength with a value of 39.23 MPa. Proton conductivity of the composite membranes increased as the temperature was increased. The proton conductivity of the CS/MMT-1 composite membrane increased from 1.75 × 10⁻² S cm−1 at 25 °C up to 3.57 × 10⁻² S cm−1 at 80 °C. The CS/MMT-1 composite membrane also exhibited a methanol permeability value that was significantly lower than that of pristine CS, namely 1.22 × 10⁻⁷ cm2 s−1 and 12.49 × 10⁻⁷ cm2 s−1, respectively. The results of this study show that the fabricated composite membrane can be used as an alternative polymer electrolyte membrane (PEM) for DMFC applications.
Introduction
The development of clean energy is necessary because of the increasing demand for energy to fulfil the needs of the ever-expanding population, as well as environmental problems related to power generation. One of the most promising green technologies used to generate energy for portable electronics such as cell phones, cameras and laptop computers is direct methanol fuel cells (DMFCs).1 Because of its high energy density, low cost and ease of handling and storage, methanol is employed as a fuel source. DMFCs use a diluted methanol solution and operate at low and moderate temperatures.2 The fundamental component of DMFCs is the polymer electrolyte membrane (PEM), which serves two purposes: as a proton transfer medium and as a partition between gases or fuels and oxidant among the anode and cathode.3,4Nafion is the most frequently used PEM in fuel cells at the present time. Due to its good chemical and mechanical stability and also good electrical conductivity, Nafion has been commercially used as a PEM. The proton transportation pathway is activated by the presence of sulfonic acid groups.5,6 Unfortunately, Nafion has several drawbacks such as high cost and high methanol crossover which necessitates research into other materials. Furthermore, the performance of Nafion deteriorates in certain conditions including high temperatures and low soil moisture.7,8 In an attempt to replace Nafion, alternative PEMs have been designed with properties such as low cost, low swelling rate, and good proton conductivity. Various research and commercialization efforts have been carried out by exploring perfluorinated ionomer, perfluorinated ionomer, fluorinated hydrocarbon, acid-base polymer blend and organic–inorganic polymer composite membranes to deal with the aforementioned challenges of proton-conducting PEM.9,10
Biopolymer CS is a natural polysaccharide composed of 2-amino-2-deoxy-(1,4)-β-D-glucopyranose repeating structural units.11 The use of CS in fuel cell applications is typically recommended because of its non-toxicity, biodegradability, biocompatibility, good film formation, low cost, thermal and chemical stability and ability to tolerate high-temperature operations, which is a critical performance criterion for PEMs.12,13 It has also been widely investigated and used extensively in biomedical engineering, the paper and pulp industry, healthy food manufacturing and water treatment. CS can also be a cationic polyelectrolyte owing to the free amino groups on the CS side chains.14 However, several properties of pristine CS, namely mechanical strength, low thermal degradation, and instability at high temperatures, have limited its use in DMFC applications. To overcome these drawbacks, several studies have explored composite inorganic fillers, crosslinking and blending with other copolymers.15–17 The development of a composite membrane is the most effective way to improve the selectivity (ratio of proton conductivity to methanol permeability), mechanical property, and thermal stability of the CS membrane.18
The incorporation of inorganic fillers, such as graphene oxide (GO), silicon dioxide (SiO2), zeolite, phosphotungstic acid (PTA), carbon nanotubes (CNTs) and montmorillonite (MMT) into the chitosan matrix can affect the physicochemical properties of the host matrix.19–23 Swagatha and co-worker studied and produced a series of chitosan based nanocomposites with the addition of zeolite LTA (Linde type-A) to be used as PEM. The CS/Zeolite LTA nanocomposite membrane showed a high proton conductivity of 4.45 mS cm−1. Furthermore, the presence of zeolite-A as an inorganic filler in the membrane composite improved proton transport, enhanced the water uptake, and provided additional pathways for proton conduction.24 The other methods to improve the physical–chemical properties of chitosan membranes are through polymer blending and the crosslinking agent. Gil-Castell and co-workers studied and fabricated a series of chitosan based nanocomposites with polyvinyl alcohol (PVA) polymer blended and sulfosuccinic acid (SSA) as crosslinking and sulfonating agent to enhance the proton conductivity, and glycerol (GL) to endorse plasticity to the membranes for PEM.25 The CS-PVA/SSA/GL nanocomposite membrane showed a higher proton conductivity at 0.735 mS cm−1 than the pristine CS membrane at 0.011 mS cm−1. SSA is a superionic proton conductor that is utilized as a crosslinking agent to increase the number of sulfonic groups in the polymer matrix. The mechanical properties of the membrane also showed an increment along with the increasing of proton conductivity.26 Another study conducted by González-Guisasola and co-worker reported that the SSA crosslinked PVA membrane showed proton conductivity values ranging from 10−2 S cm−1 with a controlled charge density which prevented excessive swelling in humid conditions so as to provide stability and promising performance for DMFC applications.27
The clay mineral, MMT, is a remarkable mineral and is one of the most studied.28 Due to its swelling capacity, surface properties, ion exchange capacity, aspect ratio, good mechanical strength, high cation exchange capacity, good solvent resistance, compatibility, environmentally friendly properties, good chemical stability, mechanical qualities and electrostatic interactions, it has been used to produce polymeric composites.29–32 The cations inside the gallery can be easily exchanged with organic ions such as ammonium, phosphonium and sulfonium due to the presence of cations adsorbed on the silicate layer, giving the MMT cation-exchange properties.33,34 Yousefi and co-worker confirmed that the chitosan (CHI)/montmorillonite (MMT) membrane in MFC applications exhibited poor ionic conductivity resulting in an increase in proton and cation conductivity, which increased the performance of the membrane due to the unique oxygen barrier properties and conductance features of the composite membrane material. In Nafion membranes filled with MMT particles, high proton conductivity and low methanol crossover have been reported.14 The most promising scale fillers are silicate clays such as MMT.35 Nataraj and co-worker developed a chitosan membrane composite with sulfonated MMT filler, the water uptake values ranged from 35% to 58% and IEC at 2.73 mmol g−1.36
The purpose of this research is to manufacture and analyse a novel composite membrane-based biopolymer. CS was isolated as a natural biomaterial to be used as an economic wound dressing and was compared to a commercially available wound healing agent to examine the physical and chemical aspects for burn wounds. CS was incorporated with MMT to form a composite membrane, which was then crosslinked with SSA as the crosslinker agent and added with Gly as the plasticizing agent. This study provides a comprehensive overview of the blending of CS with MMT, SSA, and Gly to form a composite membrane and evaluates its performance as PEM for DMFC applications. The combined assessment of chemical stability, oxidative behavior, water uptake and swelling ratio, methanol permeability, ion exchange capacity, and proton conductivity were measured as a suitable validation method. The proposed approach may help in successfully designing an alternative polyelectrolyte for direct methanol fuel cells (DMFC).
Experimental
Material
Shrimp shells of Litopenaeus vannamei were used to synthesize CS. MMT (montmorillonite K-10 surface area 250 m2 g−1), SSA (70 wt% solution in water) and Gly (≥99.5%) were all purchased from Sigma-Aldrich. Other chemicals were purchased at Indonesian smart labs.Synthesis of CS
CS was extracted from dried shrimp shells (Litopenaeus vannamei), in accordance to an earlier study. The dry shrimp shell was first mashed to obtain a dry shrimp powder. After that, the shrimp powder was immersed in a 3.5 wt% NaOH solution at 65 °C for 2 hours. The mixture was separated, and the residue was washed until it was completely neutral. The residue sample was dried at a temperature of 105 °C for 6 hours. The dry powder was then demineralized at 65 °C for 30 minutes with a 1![[thin space (1/6-em)]](https://www.rsc.org/images/entities/char_2009.gif) :
:![[thin space (1/6-em)]](https://www.rsc.org/images/entities/char_2009.gif) 15 (w/v) solution of 1 M HCl, washed until neutral, and dried at 105 °C for 6 hours. The resultant dry powder is chitin. The deacetylation technique was then used to react chitin at 120 °C for 4 hours with 50 wt% NaOH solution. Separation, washing, and drying were carried out on the mixture. The resultant dry powder is CS.
15 (w/v) solution of 1 M HCl, washed until neutral, and dried at 105 °C for 6 hours. The resultant dry powder is chitin. The deacetylation technique was then used to react chitin at 120 °C for 4 hours with 50 wt% NaOH solution. Separation, washing, and drying were carried out on the mixture. The resultant dry powder is CS.
Preparation of the CS/MMT composite membranes
The CS membrane was made using 2 wt% of CS dissolved in a 2% acetic acid solution (80 mL). After that, it was swirled and ultrasonically processed for 30 minutes. The solution was then poured into the acrylic casting and allowed to dry for about two weeks at room temperature. The membrane was then immersed in 1 M NaOH solution for 15 minutes before being neutralized with deionized water. The solution was re-neutralized with deionized water and dried at 25 °C.The CS/MMT composite membranes were made by means of the same solvent evaporation method as the CS membranes. The researchers also discovered that low molecular weight CS is water soluble and that switching the MMT filler can improve the efficiency of the product. Initially, the 0, 3, 5, 10, and 15 wt% MMT filler was added into 2 wt% chitosan solution and stirred for 30 minutes. The mixture was agitated until a black solution was obtained. For in situ crosslinking, 1.3 ml of SSA and 0.75 ml of Gly were added to the solution mixture and agitated for 3–4 hours. The solution was mixed again for 6 hours at 25 °C to achieve equal mixing. The solution was then casted on an acrylic plate and dehydrated for two weeks at room temperature. The composite membranes were first soaked for 15 minutes in a 1 M NaOH solution before being neutralized. It was then re-neutralized and allowed to dry at an ambient temperature. To prepare the composite membranes, the addition of MMT in the CS solution was varied at different loadings, namely 3 wt% (CS/MMT-1), 5 wt% (CS/MMT-2), 10 wt% (CS/MMT-3), and 15 wt% (CS/MMT-4).
Characterizations
Atomic force microscopy (AFM) was performed using Scanning Probe Microscopy (AFM, Bruker N8 Neos Accurion) in tapping mode. The scan size was 1–5000 nm. The average value of surface roughness characteristics obtained from AFM pictures of two different positions of the membrane sample are also presented in this study.
Mechanical property and oxidative stability of the composite membranes
Tensile strength (TS) and elongation at break (E%) of the composite membrane samples were determined using Toyoseiki VG10E, according to ASTM D882 device at room temperature at a constant cross-head speed of 10 mm min−1 and 100 N load cell. The samples were dumbbell-shaped with gauge dimensions of 15 mm × 3 mm × 0.22 mm. The oxidation stability was evaluated by recording the time taken by the membranes to break themselves into pieces in a Fenton's reagent (3% H2O2 aqueous solution containing 2 ppm of FeSO4) at 80 °C. The values of the initial dissolution time of the composite membranes were taken from the average of three measurements.Ion exchange capacity, water uptake and swelling ratio of the composite membranes
The ion exchange capacity (IEC) was measured using the titration method. The membrane samples were soaked in 1 M NaCl for 24 h to exchange the H+ of the sample to Na+. Subsequently, 0.01 M NaOH was used to titrate the mixture of NaCl solution and membrane samples. Phenolphthalein (PP) was used as an indicator of titration termination. VNaOH refers to the volume of the NaOH solution used and MNaOH represents the concentration of the NaOH solution. The IEC was calculated using the eqn (1) as follows:
 | (1) |
Water uptake (WU) measurements were performed using the weight difference method. The membranes were dried at 80 °C for 12 hours, and the weight (Wdry) and area (Adry) of the dried membranes were recorded. Then the membranes were immersed in distilled water at different temperatures for 24 hours. After careful removal of the surface water, the weight (Wwet) and area (Awet) of the wet membranes were recorded. The calculation of water uptake and swelling ratio are shown in eqn (2) and (3), respectively, as follows:
 | (2) |
 | (3) |
Methanol permeability, proton conductivity, and selectivity of the composite membranes
The methanol permeability test was conducted using two compartments, in which compartment A and B contained water and methanol, respectively. Methanol in the process of penetration conforms to eqn (4) as follows:
 | (4) |
The proton conductivity of the membrane was measured in the conductivity cell using electrochemical impedance spectroscopy (Agilent™ E4980A). The impedance spectra were fitted on the ZView-2 software from Scribner Associates Inc. for the curve fitting procedure. The specimens were cut into 0.5 × 0.5 cm pieces and thinly coated. To improve conductivity, a coating of Au/Pd was applied by means of sputter coating. The membrane samples were immersed in distilled water for 24 h before being tested. The proton conductivity was calculated using eqn (5) as follows:
 | (5) |
 | (6) |
Results and discussion
FTIR of chitin and CS
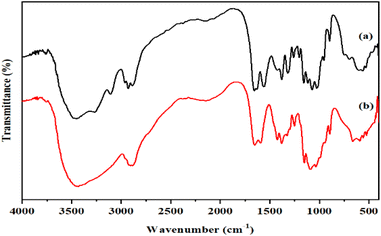
The qualitative synthesis of chitin and CS were characterized by FTIR analysis. In the FTIR spectrum of chitin and CS shown in Fig. 1, the inter-sheet hydrogen bonding due to the hydroxy group can be associated with the band peak at 3255 cm−1, which corresponds to the inter-sheet hydrogen bonding due to the hydroxy group and the intra-sheet carbonyl group at the C![[double bond, length as m-dash]](https://www.rsc.org/images/entities/char_e001.gif) O stretching region with a wavenumber of 1383 cm−1. The amide I band is responsible for the splitting of wavenumbers between 1680 and 1630 cm−1.37 In the FTIR spectrum of synthesized CS, a sequence of narrow absorption bands can be seen, which are typical of crystalline polysaccharide materials. The stretching vibrations O–H of hydroxyl groups linked to carbon atoms correspond to the band at 3470 cm−1.38 CS is known for its inter- and intra-sheet hydrogen bonding, which contributes to its highly insoluble nature. Stretching vibrations cause intense absorption bands between 3000 and 2800 cm−1. The deformation vibrations of –NH2 were observed at 1583 and 1647 cm−1; 1429 cm−1 for carbonyl group and 1103 cm−1 for group C–H bending vibrations.39 Chitin was shown to be partly deacetylated, resulting in CS. The degree of deacetylation (DD) of CS is a significant characteristic. It is relatively easier for CS to bind with another substance if it possesses a higher DD.
O stretching region with a wavenumber of 1383 cm−1. The amide I band is responsible for the splitting of wavenumbers between 1680 and 1630 cm−1.37 In the FTIR spectrum of synthesized CS, a sequence of narrow absorption bands can be seen, which are typical of crystalline polysaccharide materials. The stretching vibrations O–H of hydroxyl groups linked to carbon atoms correspond to the band at 3470 cm−1.38 CS is known for its inter- and intra-sheet hydrogen bonding, which contributes to its highly insoluble nature. Stretching vibrations cause intense absorption bands between 3000 and 2800 cm−1. The deformation vibrations of –NH2 were observed at 1583 and 1647 cm−1; 1429 cm−1 for carbonyl group and 1103 cm−1 for group C–H bending vibrations.39 Chitin was shown to be partly deacetylated, resulting in CS. The degree of deacetylation (DD) of CS is a significant characteristic. It is relatively easier for CS to bind with another substance if it possesses a higher DD.
Characterization of MMT
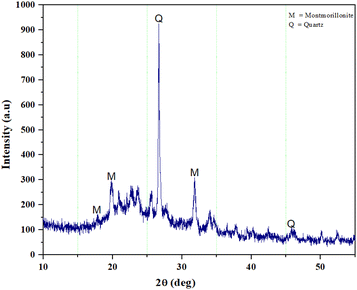
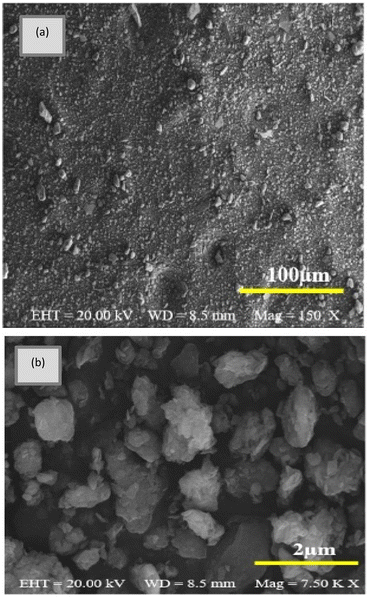
In addition, clay structure has pores which randomly distributed with different sizes. Fig. 2 shows the MMT XRD pattern for the MMT-K10. These patterns contain reflections corresponding to MMT (002), (110), (220) and quartz (101), (112).40 The enumerated peaks are characteristic of the original MMT. The MMT sample is mostly composed of montmorillonite, with small elements of quartz, as shown in Fig. 2. SEM image of the MMT was given in Fig. 3. The surface morphology of MMT demonstrates a layered surface with some large flakes, which is the typical structure for MMT. The observed morphology is one or a few randomly drawn montmorillonite particles with magnification 150 and 7500 times.Characterization of the composite membranes
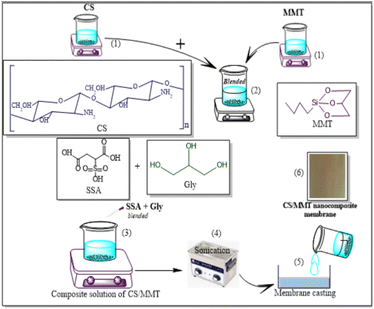
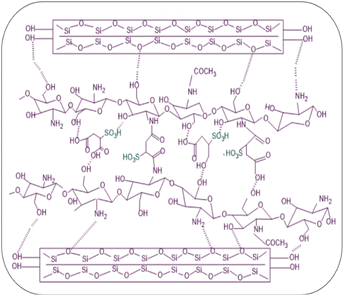
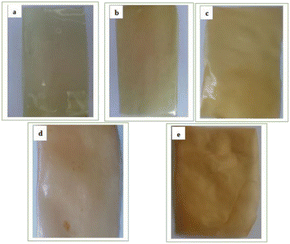
The preparation steps of natural composite PEMs were systematically investigated shown in Fig. 4 and 5 showed the possible chemical interactions of the membrane. To prepare the membranes, the CS matrix was incorporated with the MMT filler by means of blending. The composite solution was dispersed in a blend of SSA as the crosslinking agent and Gly as the plasticizing agent, and sonicated to obtain an agglomerate-free solution. Different loading percentages of composite solutions were casted on an acrylic plate and dried in ambient conditions. Because this network structure has better contact with the polymer matrix, the CS-based membrane has a lower impact. Due to the incorporation of the MMT filler and crosslinking with SSA as the crosslinking agent and added with Gly as the plasticizing agent, all the polyelectrolytes which were initially clear, changed color that showed Fig. 6. This shift was more prominent in samples with a higher MMT loading weight, indicating that the crosslinking reaction with the SSA molecules was confirmed.FTIR analysis of the membranes
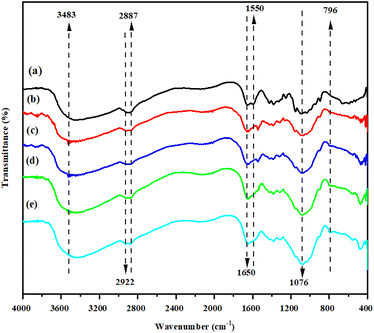
In order to examine the inorganic blending filler, the crosslinking reaction of CS with the SSA molecules, and the influence of the addition of Gly was analyzed using FTIR. Fig. 7 shows the obtained spectra. Neat CS and the CS/MMT were used as reference. The characteristic bonds at 3483 cm−1 are attributed to the OH group. In the bands at 2950 and 2900 cm−1, the symmetric and asymmetric stretching of the methylene groups C–H can be seen. The stretching of primary and secondary amides are assigned to the vibrations at 1650 and 1550 cm−1, respectively.41 In general, the spectra of the composite membrane-based polyelectrolytes achieved the characteristic peaks of the blend's components, including the CS, MMT and SSA signals. The –OH stretching vibration and the –NH stretching vibration, as well as the characteristic absorption bands for the methylene groups (–CH2–) of CS, were identified in the CS. The typical bands of the MMT filler that appear at 1076 and 796 cm−1 are attributed to the Si–O and –SiOH group, respectively.42 Changes in the percentages of the membrane's components reverberated in the spectra as a fluctuation in the band intensity of the individual groups, as predicted.The existence of the sulfonic group introduced by SSA was confirmed by assessing the membrane sulfonation. The symmetric stretching vibrations of the –SO3H group inserted into the SSA molecules were related to the peaks at 1100–1030 cm−1. Despite the fact that the –SO3H signals may overlap with the C–O stretching of CS, the strength of the sulfonic group band in the blends was higher. The effects of adding Gly to the CS/MMT-based polyelectrolytes were further investigated. Gly indicated a significant band in the range of 3200–3570 cm−1 due to the intramolecular hydrogen bonds. The interactions of Gly with CS, MMT, and SSA led to a decrease in total peak intensity, specifically in the fingerprint area, indicating the plasticizing function of Gly.43
SEM & AFM analysis of the membranes
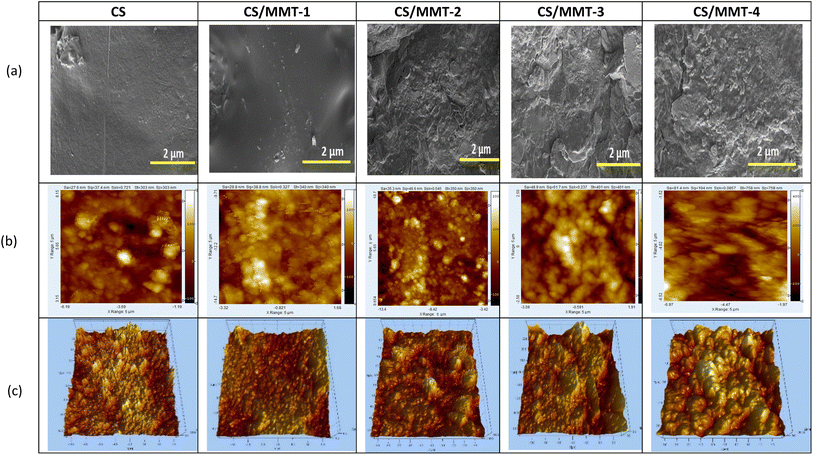
SEM pictures were taken to examine the morphology of the prepared membranes. Before the analysis, the membranes were coated with platinum. It can be seen that the fabricated membranes exhibit a smooth and dense morphology. The membranes' phase separation was further confirmed by taking SEM pictures of all the membranes, shown in Fig. 8(a). It is clear from the images that the surface of the pristine CS membrane was smooth and not rough. However, the surfaces of the fabricated composite membranes were noticeably rough. This is predicted to be related to the phase separation in the composite membranes due to the presence of MMT and sulfonate acid from SSA. This favors the mobility of protons across the membrane matrix and thereby improves the proton conductivity of the resulting composite membranes. The surface view of these membranes was a little rough and spotted with agglomerated particles and no pinholes, and also the morphology of the MMT filler (3%) was exhibited at low and high magnification. AFM was used to record the surface morphology of the produced membranes. The obtained micrographs of both 2D and 3D tapping mode pictures are shown in Fig. 8(b) and (c), respectively.The AFM technique was used to examine the phase and surface topography of the CS membrane and the CS/MMT composite membranes in order to identify the effects of the MMT filler. As a result, a correlation was exhibited between the AFM peaks and surface roughness values. The surface pattern, which depicts the hydrophilic–hydrophobic microphase separation, was shown to be highly influenced by the addition of sulfonic groups. With a spike-like form, the surface morphology can be easily recognized. The surface of the pristine CS membrane appeared to be smoother than that of the composite membranes. As the concentration of the MMT filler increased, the appearance of the composite membrane became rougher and possessed darker spots. The CS/MMT-1 composite exhibited a smooth surface that is attributed to the dark region in the images, which corresponds to the hydrophilic sulfonated groups. Fewer brighter domains on the surface of the CS/MMT-2, CS/MMT-3 and CS/MMT-4 composite membranes indicate the aggregation of the filler and a hard structure, corresponding to a hydrophobic polymer matrix that is attributed to the bright phase in the images. The phase difference between the hydrophilic and hydrophobic areas suggests that the composite membranes can provide enhanced proton conductivity. In comparison to the pristine CS membrane, the appearance of the composite membranes possessed bigger peaks and a deeper gap. More electrostatic contact causes a topographical change on the surface of the membrane.44 The filler agglomeration was responsible for the increased value of surface roughness. Furthermore, the aggregation has the potential to alter the proton conductivity of the membrane. The addition of MMT particles to the CS biopolymer may have a considerable impact on the surface roughness of the resultant composite membranes.
The morphology and surface roughness of the composite membranes are likewise affected by undispersed MMT. It may cause the surface roughness of the resultant membranes to increase.45 The surface roughness of the membranes are listed in Table 1. The CS/MMT-1 composite membrane, which had an adequate surface roughness for DMFC applications, had the best AFM result. The formation of hydrogen bonds with the hydroxyl and amide groups in CS and SiO2 from MMT makes it easier for MMT to interact with CS.46 Basically, the MMT filler is responsible for the surface absorption of H2O, which leads to methanol permeability resistance. The distribution of filler particles is evenly spread due to perfect mixing and the addition of SSA as a crosslinking agent and Gly as the plasticizing agent in the polymer matrix.
| Membrane | Sa (nm) | Sq (nm) | Sz (nm) |
|---|---|---|---|
| Cs | 27.6 | 37.4 | 303 |
| CS/MMT-1 | 29.8 | 38.8 | 340 |
| CS/MMT-2 | 35.3 | 46.6 | 350 |
| CS/MMT-3 | 48.9 | 61.7 | 401 |
| CS/MMT-4 | 81.4 | 104 | 758 |
The composite membranes exhibited a rough surface and showed inhomogeneous porosity size, particle agglomeration and unequal distribution on their surfaces as shown in Fig. 8.
Oxidation stability and mechanical properties of the membranes
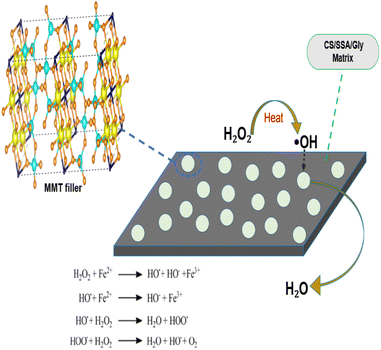
Evaluations were carried out on whether the membranes can withstand a strong oxidizing environment. This is because PEMFCs and DMFCs generally operate under a strong oxidizing environment, in which oxidative degradation is considered to be most important factor that causes membrane chemical/electrochemical degradation.47 Consequently, PEMs should have enough oxidative stability to withstand a strong oxidizing environment in order to enhance the lifetime of fuel cells. The comparison of oxidation stability was carried out by comparing the time before the samples start to dissolve in a Fenton solution at 80 °C.48 The initial dissolution time of the composite membranes are shown in Table 2. The composite membranes with a higher concentration of MMT exhibit better oxidative stability. The pristine CS membrane started to dissolve only after about 189 minutes. This results showed that the initial time for the membrane to dissolve was longer than the CS composite membrane with various silica-coated carbon nanotubes (SCNTs) filler concentrations. Otherwise, the various CS/SCNTs membranes obtained a faster initial dissolve time of 148–214 min.17 The addition of the MMT filler enhanced the oxidative stability of the composite membranes, proving that the MMT filler improved the oxidation stability of the CS membrane. The enhanced oxidative stability is attributed to the excellent oxidation resistance of MMT. The characteristic layer structure of MMT has antioxidant properties that can capture radical molecules through intercalation or physical adsorption process that will produce H2O.49 The possible mechanism of the CS/MMT membrane in Fenton's reagent is shown in Fig. 9. Furthermore, the good compatibility between the CS/MMT and CS matrix should contribute to increasing the oxidation stability, which delays the degradation of CS chains by inhibiting their motion. The mechanical properties of PEMs strongly affects the fabrication condition and durability of fuel cells.50| Membrane | Tensile strength (MPa) | Young modulus (GPa) | εb (%) | Oxidation stability (min) |
|---|---|---|---|---|
| CS | 29.34 ± 0.77 | 1.17 ± 0.62 | 15.38 ± 0.38 | 189 ± 0.01 |
| CS/MMT-1 | 39.23 ± 0.31 | 2.49 ± 0.11 | 9.29 ± 0.42 | 366 ± 0.02 |
| CS/MMT-2 | 36.57 ± 1.26 | 2.05 ± 1.05 | 8.52 ± 0.63 | 373 ± 0.01 |
| CS/MMT-3 | 34.92 ± 0.38 | 1.46 ± 0.31 | 6.67 ± 0.67 | 382 ± 0.01 |
| CS/MMT-4 | 30.15 ± 0.29 | 1.35 ± 1.27 | 3.45 ± 0.61 | 397 ± 0.01 |
It can be seen in Table 2 that the addition of the MMT filler, SSA and Gly resulted in a direct increase in the stiffness and the strength of the CS membrane. The value of tensile strength is obtained from the maximum stress of the stress–strain curve, while the slope of the initial linear part of the curve is defined as Young modulus. The tensile strength and Young modulus of the composite membranes are enhanced after the addition of MMT. A higher amount of MMT filler resulted in a stiffer membrane. This result may be attributed to the excellent mechanical properties of MMT that has previously been proven to be an excellent strengthening agent for many polymers.51 Meanwhile, the homogeneous dispersion of MMT, SSA and Gly in the CS matrix can form physical crosslinking points, which can disperse stress and restrain the mobility of CS chains.
This is due to the high number of electrostatic contacts between MMT and CS. It is assumed that SSA and Gly were dispersed throughout the CS network, resulting in a highly visible plasticization impact. It was also reported that the mechanical characteristics of Ch/MMT/glycerol composites have considerable influence.52 It was discovered that adding glycerol as a crosslinking agent increased the elongation at break, which was associated to a more uniform distribution of water and glycerol throughout the system, resulting in a greater plasticization effect. In addition, when the amount of MMT was at 3 wt%, the tensile strength and Young modulus exhibited an increasing trend. However, when the concentration of MMT was at 5 and 15 wt%, the tensile strength and Young modulus exhibited a decreasing trend. The mechanical properties of the research membrane have a higher value ranging from 29.34 to 39.23 MPa compared to the study conducted by Wang and co-worker to synthesize CS membranes with filler titania-carbon nanotubes (TCNTs) obtained the value of mechanical properties only around 17.8–29 MPa.48
This may be caused by the slight aggregation of MMT at higher amounts of MMT, even though the aggregation was not easily observed from the SEM images. The insufficient dispersion of MMT or the development of partial agglomeration, which reduces the reinforcing action of MMT, may be linked to the decrease in tensile strength at high amounts of MMT. During the loading process of the composites, agglomerates function as defect points in the polymer matrix.53
It had been reported that in the intercalated composites, the clay platelets are poorly dispersed and form aggregates that break upon loading, as was observed in the fracture surface of the starch composites.54
Water uptake, and swelling ratio
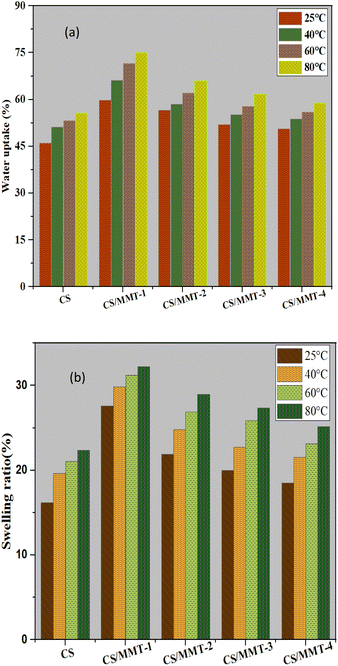
Polymer membranes have high water absorption capacity for the functioning of PEMs. The effect of filler loading on the water uptake performance of the CS/MMT composite membrane was investigated. The water uptake increased as the concentration of filler in the membrane matrix increased, but when excessive amounts of filler was introduced to the membrane matrix, agglomeration occurred lowering the water uptake value. Proton transport across the membrane is further enabled by water uptake. Water uptake values are typically used to indicate the availability of a diffusion vehicle or process.55 As a result, the composite membrane with a filler load of 3 wt% had the highest water uptake. If the polymer matrix is overloaded with the filler, the value of water absorption may decrease. Membrane diffusion can be decreased in composites by agglomerating MMT fillers. This phenomenon indicates that in the structure of the composite membrane, Grotthus mechanism and vehicle mechanism both exist for proton transfer.56Fig. 10(a) showed that the increasing the addition of MMT up to 5, 10, or 15 wt% reduced the ability of water uptake of the membrane. The water uptake behavior of the membrane is fully influenced by the loading weight of MMT. The results of our study are similar to the results of the reported water uptake and swelling ratio of the SPEEK/MMT membrane,57 where the water uptake of pristine SPEEK membrane at 35% that lower than the 1 wt% SPEEK–MMT composite membrane with the water uptake up to 39%. However, the SPEEK/MMT composite membrane attributed to the decreasing of the water uptake along with the increasing of MMT content. The addition of the large number of MMT content causes the agglomeration of the membrane's structure.57 Water uptake is a critical feature of PEMs because it is related to proton conductivity.58 Because of their hydrogen bonding with water, PEMs are able to absorb water due to functional groups, in this case –SO3H. On the other hand, the addition of CS and MMT resulted in a significant interaction with sulfonic acid groups. Purwanto and co-worker suggested that the reduction of water uptake occurs because of two reasons; (1) agglomeration of modified MMT and (2) intercalation in clay layers which may obstruct the polymer chain movement, resulting in chain packing. The various water uptake values are related to the swelling and water sorption of the membrane.16
The swelling ratio of all the membranes at 25 °C are showed in Fig. 10(b). The swelling ratio of membranes incorporated with lower content of MMT is higher than the pristine CS membrane. MMT is a clay material, which has monovalent ions trapped between the silicates layers that tend to attract polar solvent such as methanol and water.59
Furthermore, the homogeneously distributed MMT layers in the matrix reduces the free volume of the resultant matrix, which also reduces the swelling ratio.59,60 A similar study reported by Hu and co-worker for SPPESK-MMT, found that the increasing of MMT content to the membrane will reduce the swelling ratio from 34% to 12%.61 Besides water uptake, swelling ratio is also an important property that determines the quality of PEMs, especially for DMFC applications. The CS/MMT-1 composite membrane has the highest swelling ratio and also the highest water uptake. Although the composite membranes have a slightly higher swelling ratio than previous CS-based composite membranes, they still possess an acceptable dimensional stability.
IEC, methanol permeability, proton conductivity, and membrane selectivity
The IEC of PEMs is a critical parameter that indicates its ion exchange ability that directly impacts proton transfer. PEM is a polymer network containing covalently bonded negatively charged functional groups capable of exchanging cations. The IEC value indicates proton transfer using the Grotthus mechanism and reveals the quantity of ion exchangeable groups present in a polymer matrix, which has a substantial impact on proton transport mechanisms.62 For fuel cells, the sulfonic acid group (–SO3H) is the widely used exchanging site because the protons are fully dissociated in the presence of water, thereby functioning as a good hydronium ion conductor.63 Compared to the pristine polymeric membrane, the polymeric membrane with 3 wt% loading of MMT filler achieved the highest IEC value as shown in Table 3. Furthermore, an increase in the amount of MMT filler up to 5, 10, and 15 wt% lead to the decrease in IEC value. To achieve a high IEC value, an optimal loading amount of MMT filler should be applied to the polymer matrix. The high IEC value indicating that the hydrophilic groups play an important role in proton transport in the membrane structure.| Membrane | IEC (mmol g−1) | Methanol permeability (cm2 s−1) | Proton conductivity (S cm−1) | Selectivity (S s cm−3) |
|---|---|---|---|---|
| CS | 0.68 ± 0.02 | 12.49 × 10⁻⁷ | 0.0044 | 0.35 × 10⁴ |
| CS/MMT-1 | 0.57 ± 0.03 | 1.22 × 10⁻⁷ | 0.0175 | 1.43 ×10⁵ |
| CS/MMT-2 | 0.48 ± 0.02 | 3.67 × 10⁻⁷ | 0.0136 | 0.37 × 10⁵ |
| CS/MMT-3 | 0.41 ± 0.04 | 4.51 × 10⁻⁷ | 0.0119 | 0.26 × 10⁵ |
| CS/MMT-4 | 0.37 ± 0.04 | 9.57 × 10⁻⁷ | 0.0103 | 0.11 × 10⁵ |
MMT is deemed as a two-dimensional structure and so MMT provides extra pathways for proton transfer, resulting in an increase in IEC value. Enhanced IEC in CS/MMT is attributed to the presence of excessive sulfonyl active sites from S-MMTs in ionically cross-linked chitosan. This may lead to selective transport of protons across the membrane through interconnected hydrated domains. As studied by Kakati and co-worker, a sulfonated organic modified montmorillonite nanoclay (SMMt) filler added to a polyvinyl alcohol (PVA) membrane with the sulphosuccinic acid (SPA) as crosslinker, where the SMMt filler attributed to facilitate the movement of ionic transport selectivity, due to the polar group in MMT's structure it constructs a hydrophilic interface so that it can affect the resulting ionic conductivity.60 This study found that proton conductivities for CS/MMT membranes are adequate and show an increasing trend up to an optimized 5% embedded sulfonated MMT. The proton conductivity increased until an optimal 3 wt% MMT loading, which corresponds to an increase in IEC. Higher MMT loading over 3 wt% resulted in the formation of aggregates, leading to uneven distribution in the parent CS matrix. According to the IEC data, the IEC of the CS/MMT composite membranes were in agreement with the WU data, in which an increase in WU also increases the IEC of the membrane at particular amounts of the filler.
The methanol permeability of the pristine CS membrane was substantially higher than that of the fabricated composite membranes, as shown in Table 3. The CS/MMT-1 (3 wt%) composite membrane exhibited a lower methanol permeability value than the pristine CS membrane. Compared to the CS/MMT-1 composite membrane, the methanol permeability increased as the amount of the filler was increased (5, 10, 15 wt%). It was previously reported that the methanol permeation of a Nafion® 117-based membrane increased due to an increase in methanol concentration. It was revealed that the proton conductivity of Nafion® 117 membrane was 27 × 10−7 cm2 s−1.3 However, in the case of the pristine CS membrane and the other CS/MMT composite membranes, the effect is the opposite. Furthermore, it was proposed that the inclusion of a MMT filler increased the barrier characteristics of the pristine CS membrane against methanol due to high compatibility. Another study reported by Tohidian and co-worker, synthesized nanocomposite membranes based on complex polyelectrolyte (PEC) from chitosan/phosphotungstic acid and various types of montmorillonite resulted in methanol permeability at 8.3 × 10⁻⁸ cm2 s−1.64 This is because the well-dispersed MMT filler increases the tortuous path for methyl alcohol through the membranes due to its high length-to-width ratio, and the dispersion of inorganic particles increases the path length and torsion of methyl alcohol permeability.65 The SSA crosslinking agent has a strong interaction with the chitosan matrix, resulting in a dense composite membrane that can reduce methanol crossing. It was shown to be compatible with an organic–inorganic composite. The minor voids are filled and the two components are combined by the transitional stage generated at the inorganic-organic border. The –SO3H groups on the surface of the composite membranes form strong contacts with the OH groups of CS, resulting in a compact structure with minimal methanol permeability. The methanol permeability of pristine CS is clearly greater than those of our newly fabricated composite membranes.
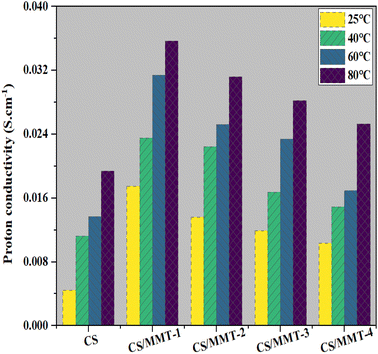
Although conductivity is very significant in determining the magnitude of power density of the membrane, it is strongly suggested that membrane conductivity should also be determined in order to identify the influence of the filler on the performance of the membrane. In this study, the pristine CS membrane possessed a lower conductivity than the CS/MMT composite membranes. It was revealed in this study that the proton conductivity of the pristine CS membrane was 4.4 × 10⁻³ S cm−1 at 25 °C, which is close to the value reported in ref. 66. The proton conductivity of the CS/MMT-1 composite membrane increased as the MMT filler content was increased to 3 wt%. However, the proton conductivity of the composite membranes decreased as the filler content was increased to 5, 10, 15 wt%. MMT builds extra paths for proton transfer in the CS network. However, as the amount of MMT was increased, agglomeration of MMT occurred and instead building more paths, parts of the transfer paths were blocked. The proper proton conductivity of the composite membrane may be due to its better ability to retain water molecules (proton carriers) at higher temperatures, as a result of the hydrogen bond with the composite membrane's hydrophilic groups (OH, NH2, and SO3H),67 as well as an increase in ion mobility with temperature.47 Therefore, increasing the temperature also enhanced the proton conductivity of the CS membrane. This effect may be caused by the involvement of functional groups related to the membrane structure. The membrane structure is related to functional groups such as hydroxy, –NH3+, and Si–O. Most of these hydrophilic functional groups were synthesized.
A higher density of functional groups in a typical fuel cell membrane is advantageous. They have the capacity to reduce ionic interaction while increasing proton mobility in the proton-conducting network. An appropriate amount of MMT filler in the membrane can contribute to building proton transfer pathways. Other studies reported on inorganic fillers such as graphene has properties as protonation agents. In addition, the addition of the optimum amount of graphene can increase the diffusion coefficient in the CS matrix. Moreover, the role of MMT in this study can act as protonation agent in CS/SSA/Gly composite matrix corresponding to the other inorganic fillers.68 Furthermore, increased water sorption promotes proton transfer via structural diffusion at normal temperature, as shown in Fig. 11. The proton conductivity of the composite membranes was carried out in this study, the resulting proton conductivity of the synthesized membrane was 0.0175 S cm−1 with the water uptake value of 59.93% at 25 °C. These results are higher than the previous study reported by Yousefi and co-worker using a similar composite membrane, of chitosan (CHI) as a matrix with montmorillonite (MMT) filler, with the proton conductivity only at 222.73 ± 22.7 μS cm−1.14
The inclusion of hydroxyl groups in MMT allows the membrane to provide an additional proton transfer conduction site, resulting in increased proton conductivity.16 Proton diffusion generally occurs through two mechanisms, namely the hopping mechanism and the vehicle mechanism. In the hopping mechanism, a hydrated proton is transferred to the next electron pair of the water molecule, whereas in the vehicle mechanism, a proton in the form of hydronium ion is transferred to solvent molecules in hydrophilic channels.64,69 The CS matrix, MMT filler, and SSA crosslinking agent are used in this study to establish an infinite hydrophilic cluster that allows proton transport via the vehicle mechanism. In this study, it was confirmed that proton conductivity is influenced by both the vehicle mechanism and the hopping mechanism. Selectivity is an important measure that indicates the overall performance of the composite membranes.
A high proton conductivity and low methanol permeability is more desirable. The performance of the membranes can be enhanced due to a higher selectivity. To enhance the function of novel composite membranes in DMFC applications, it is important to determine the optimal filler and additive loading. Table 3 clearly shows that the membrane selectivity of the CS/MMT-1 composite membrane is significantly higher than that of the other membranes, indicating that the fabricated CS/MMT-1 composite membrane is acceptable for DMFC applications.
Conclusions
CS/MMT composite membranes with surface modifications were successfully fabricated and analyzed. The hydrophilicity of the membranes was increased by adding different amounts of MMT (3, 5, 10, and 15 wt%) and also by adding SSA and Gly. The addition of the MMT filler to the CS matrix enhanced the surface roughness of the membranes and also affected the WU and proton conductivity of the membranes based on the SEM and AFM characterizations. The oxidative stability and mechanical strength of the CS/MMT composite membranes were satisfactory. The proton conductivity of the CS/MMT-1 composite membrane was greater than that of the pristine CS membrane and the CS/MMT-2, CS/MMT-3, and CS/MMT-4 composite membranes. The highest proton conductivity was obtained by the CS/MMT-1 composite membrane with a value of 3.57 × 10⁻² S cm−1 at 80 °C. Because of their superior processability, the CS/MMT composite membranes can be applied in PEM fuel cells up to temperatures of 80 °C. The CS/MMT-1 composite membrane demonstrated selective swelling ratio, adequate ion exchange capacity, and low methanol permeability with values of 32.28%, 0.57 mmol g−1, and 1.22 × 10⁻⁷ cm2 s−1, respectively. This current work offers a generic technique for converting abundant biopolymer minerals into high-performance energy materials using green modification technologies.Author contributions
Yohana Ivana Kedang: writing-original draft, methodology, validation, investigation, preparation; Lukman Atmaja: writing-reviewing, conceptualization, validation, editing, and supervision; Mardi Santoso: validation, editing; conceptualization; Arif Priyangga: editing, validation, investigation.Conflicts of interest
There are no conflicts to declare.Acknowledgements
This work was financially supported by the Indonesian Government, especially the Ministry of Finance under Lembaga Pengelola Dana Pendidikan (LPDP).Notes and references
- A. Pagidi, G. Arthanareeswaran and M. M. Seepana, Int. J. Hydrogen Energy, 2020, 45, 7829–7837 CrossRef CAS.
- P. Prapainainar, Z. Du, P. Kongkachuichay, S. M. Holmes and C. Prapainainar, Appl. Surf. Sci., 2017, 421, 24–41 CrossRef CAS.
- F. Altaf, R. Batool, R. Gill, M. A. Shabir, M. Drexler, F. Alamgir, G. Abbas, A. Sabir and K. I. Jacob, Carbohydr. Polym., 2020, 237, 116111 CrossRef CAS PubMed.
- C. Li, Z. Yang, X. Liu, Y. Zhang, J. Dong, Q. Zhang and H. Cheng, Int. J. Hydrogen Energy, 2017, 42, 28567–28577 CrossRef CAS.
- C. Yin, J. Li, Y. Zhou, H. Zhang, P. Fang and C. He, ACS Appl. Mater. Interfaces, 2018, 10, 14026–14035 CrossRef CAS PubMed.
- S. Neelakandan, P. Kanagaraj, A. Nagendran, D. Rana, T. Matsuura and A. Muthumeenal, Renewable Energy, 2015, 78, 306–313 CrossRef CAS.
- J. V. Gohel, P. S. Mishra and Z. V. P. Murthy, Sep. Sci. Technol., 2019, 54, 233–246 CrossRef CAS.
- X. Zhu, J. Huang, C. Jin and S. Zhang, Polym. Bull., 2018, 75, 3739–3751 CrossRef CAS.
- K. S. kumar, S. Rajendran and M. R. Prabhu, Appl. Surf. Sci., 2017, 418, 64–71 CrossRef CAS.
- H. Junoh, J. Jaafar, N. A. H. Nik Abdul, A. F. Ismail, M. H. D. Othman, M. A. Rahman, F. Aziz and N. Yusof, Membranes, 2020, 10, 1–21 CrossRef PubMed.
- P. Srinophakun, A. Thanapimmetha, S. Plangsri, S. Vetchayakunchai and M. Saisriyoot, J. Clean. Prod., 2017, 142, 1274–1282 CrossRef CAS.
- S. S. Gaur, P. Dhar, A. Sonowal, A. Sharma, A. Kumar and V. Katiyar, J. Membr. Sci., 2017, 526, 348–354 CrossRef CAS.
- S. Mohanapriya and V. Raj, Ionics, 2018, 24, 2729–2743 CrossRef CAS.
- V. Yousefi, D. Mohebbi-Kalhori and A. Samimi, Int. J. Hydrogen Energy, 2020, 45, 4804–4820 CrossRef CAS.
- M. A. Abu-Saied, E. Soliman and E. A. A. Desouki, Mater. Today Commun., 2020, 25, 101536 CrossRef CAS.
- M. Purwanto, L. Atmaja, M. A. Mohamed, M. T. Salleh, J. Jaafar, A. F. Ismail, M. Santoso and N. Widiastuti, RSC Adv., 2016, 6, 2314–2322 RSC.
- H. Liu, C. Gong, J. Wang, X. Liu, H. Liu, F. Cheng, G. Wang, G. Zheng, C. Qin and S. Wen, Carbohydr. Polym., 2016, 136, 1379–1385 CrossRef CAS PubMed.
- M. Ranjani, M. Pannipara, A. G. Al-Sehemi, A. Vignesh and G. G. kumar, Solid State Ionics, 2019, 338, 153–160 CrossRef CAS.
- S. Dhanavel, P. Praveena, V. Narayanan and A. Stephen, Polym. Bull., 2020, 77, 5681–5696 CrossRef CAS.
- C. Gong, S. Zhao, W.-C. Tsen, F. Hu, F. Zhong, B. Zhang, H. Liu, G. Zheng, C. Qin and S. Wen, J. Power Sources, 2019, 441, 227176 CrossRef CAS.
- V. Vijayakumar and D. Khastgir, Carbohydr. Polym., 2018, 179, 152–163 CrossRef CAS PubMed.
- L. Atmaja, M. Purwanto, M. T. Salleh, M. A. Mohamed, J. Jaafar, A. F. Ismail, M. Santoso and N. Widiastuti, Malays. J. Fund. Appl. Sci., 2019, 15, 492–497 CrossRef.
- A. R. Nešić, S. J. Veličković and D. G. Antonović, Composites, Part B, 2013, 53, 145–151 CrossRef.
- A. I. A. K. Swaghatha and L. Cindrella, React. Funct. Polym., 2022, 170, 105116 CrossRef CAS.
- O. Gil-Castell, R. Teruel-Juanes, F. Arenga, A. M. Salaberria, M. G. Baschetti, J. Labidi, J. D. Badia and A. Ribes-Greus, React. Funct. Polym., 2019, 142, 213–222 CrossRef CAS.
- S. D. Bhat, A. K. Sahu, A. Jalajakshi, S. Pitchumani, P. Sridhar, C. George, A. Banerjee, N. Chandrakumar and A. K. Shukla, J. Electrochem. Soc., 2010, 157, B1403 CrossRef CAS.
- C. González-Guisasola and A. Ribes-Greus, Polym. Test., 2018, 67, 55–67 CrossRef.
- M. Brotas De Carvalho, J. Pires and A. P. Carvalho, Microporous Mater., 1996, 6, 65–77 CrossRef CAS.
- P. Salerno and S. Mendioroz, Appl. Clay Sci., 2002, 22, 115–123 CrossRef CAS.
- P. T. Bertuoli, D. Piazza, L. C. Scienza and A. J. Zattera, Appl. Clay Sci., 2014, 87, 46–51 CrossRef CAS.
- P. Lertsutthiwong, K. Noomun, S. Khunthon and S. Limpanart, Prog. Nat. Sci.: Mater. Int., 2012, 22, 502–508 CrossRef.
- M. A. Khedr, A. I. Waly, A. Hafez and H. Ali, Aust. J. Basic Appl. Sci., 2012, 6, 216–226 CAS.
- Y. Cui, S. Kumar, B. Rao Kona and D. Van Houcke, RSC Adv., 2015, 5, 63669–63690 RSC.
- A. N. Ghadge and M. M. Ghangrekar, Electrochim. Acta, 2015, 166, 320–328 CrossRef CAS.
- M. M. Hasani-Sadrabadi, E. Dashtimoghadam, F. S. Majedi, K. Kabiri, N. Mokarram, M. Solati-Hashjin and H. Moaddel, Chem. Commun., 2010, 46, 6500–6502 RSC.
- S. K. Nataraj, C. H. Wang, H. C. Huang, H. Y. Du, L. C. Chen and K. H. Chen, ACS Sustainable Chem. Eng., 2015, 3, 302–308 CrossRef CAS.
- L. Fernando, M. Poblete, A. G. Ongkiko and L. J. Diaz, Procedia Chem., 2016, 19, 462–468 CrossRef CAS.
- A. B. D. Nandiyanto, R. Oktiani and R. Ragadhita, Indones. J. Sci. Technol., 2019, 4, 97–118 CrossRef.
- T. Budnyak, I. Pylypchuk, V. Tertykh, E. Yanovska and D. Kołodyńska, Nanoscale Res. Lett., 2015, 10, 87 CrossRef PubMed.
- O. Alekseeva, A. Noskov, E. Grishina, L. Ramenskaya, N. Kudryakova, V. Ivanov and A. Agafonov, Mater., 2019, 12, 16 Search PubMed.
- S. Bensaha and S. K. Slimane, Russ. J. Appl. Chem., 2016, 89, 1991–2000 CrossRef CAS.
- R. Zhang, C. Chen, J. Li and X. Wang, Appl. Surf. Sci., 2015, 349, 129–137 CrossRef CAS.
- A. Jokar, M. H. Azizi and Z. Hamidi Esfehani, Nutr. Food Sci. Res., 2017, 4, 25–34 CAS.
- D. Manikandan, R. V. Mangalaraja, R. E. Avila, R. Siddheswaran and S. Ananthakumar, Mater. Sci. Eng., B, 2012, 177, 614–618 CrossRef CAS.
- M. Gierszewska, E. Jakubowska and E. Olewnik-Kruszkowska, Polym. Test., 2019, 77, 105872 CrossRef.
- V. G. L. Souza, J. R. A. Pires, É. T. Vieira, I. M. Coelhoso, M. P. Duarte and A. L. Fernando, Food Hydrocolloids, 2019, 89, 241–252 CrossRef CAS.
- S. J. Peighambardoust, S. Rowshanzamir and M. Amjadi, Review of the proton exchange membranes for fuel cell applications, 2010, vol. 35 Search PubMed.
- H. Liu, J. Wang, S. Wen, C. Gong, F. Cheng, G. Wang, G. Zheng and C. Qin, J. Appl. Polym. Sci., 2016, 133, 1–7 Search PubMed.
- S. Muráth, N. B. Alsharif, S. Sáringer, B. Katana, Z. Somosi and I. Szilagyi, Crystals, 2020, 10, 40–49 CrossRef.
- S. Bose, T. Kuila, T. X. H. Nguyen, N. H. Kim, K. T. Lau and J. H. Lee, Prog. Polym. Sci., 2011, 36, 813–843 CrossRef CAS.
- A. Zuraida, Y. Yusliza, O. Nurizan, H. Anuar, H. Zahurin and S. Noorasikin, Adv. Mater. Res., 2012, 445, 469–474 CAS.
- A. Giannakas, K. Grigoriadi, A. Leontiou, N.-M. Barkoula and A. Ladavos, Carbohydr. Polym., 2014, 108, 103–111 CrossRef CAS PubMed.
- M. Alboofetileh, M. Rezaei, H. Hosseini and M. Abdollahi, J. Food Eng., 2013, 117, 26–33 CrossRef CAS.
- V. P. Cyras, L. B. Manfredi, M. T. Ton-That and A. Vázquez, Carbohydr. Polym., 2008, 73, 55–63 CrossRef CAS.
- F. C. Teixeira, A. I. de Sá, A. P. S. Teixeira and C. M. Rangel, Appl. Surf. Sci., 2019, 487, 889–897 CrossRef CAS.
- Y. Yin, T. Xu, X. Shen, H. Wu and Z. Jiang, J. Membr. Sci., 2014, 469, 355–363 CrossRef CAS.
- S. Porchelvi, R. Kannan, P. Bahavan Palani, K. Sainul Abidin and S. Rajashabala, Mater. Res. Innovations, 2019, 23, 33–38 CAS.
- B. P. Tripathi, M. Kumar and V. K. Shahi, J. Membr. Sci., 2009, 327, 145–154 CrossRef CAS.
- D. Xing, G. He, Z. Hou, P. Ming and S. Song, Int. J. Hydrogen Energy, 2011, 36, 2177–2183 CrossRef CAS.
- N. Kakati, J. Maiti, G. Das, S. H. Lee and Y. S. Yoon, Int. J. Hydrogen Energy, 2015, 40, 7114–7123 CrossRef CAS.
- Z. Hu, G. He, S. Gu, Y. Liu and X. Wu, J. Appl. Polym. Sci., 2014, 131, 1–7 CrossRef.
- J. Qiao, T. Hamaya and T. Okada, Polymers, 2005, 46, 10809–10816 CrossRef CAS.
- E. Córdova-Mateo, O. Bertran, C. A. Ferreira and C. Alemán, J. Membr. Sci., 2013, 428, 393–402 CrossRef.
- M. Tohidian, S. R. Ghaffarian, S. E. Shakeri, E. Dashtimoghadam and M. M. Hasani-Sadrabadi, J. Solid State Electrochem., 2013, 17, 2123–2137 CrossRef CAS.
- M. H. Mohamed, H. Ilbeygi, J. Jaafar, M. Aziz, M. H. D. Othman and M. A. Rahman, Int. J. Hydrogen Energy, 2022, 47, 10736–10746 CrossRef CAS.
- J. Ma and Y. Sahai, Carbohydr. Polym., 2013, 92, 955–975 CrossRef CAS PubMed.
- Z. Gaowen and Z. Zhentao, J. Membr. Sci., 2005, 261, 107–113 CrossRef.
- H. P. Zhang, N. S. Gandhi, Y. Gu, Y. Zhang and Y. Tang, Int. J. Hydrogen Energy, 2020, 45, 25960–25969 CrossRef CAS.
- B. Smitha, S. Sridhar and A. A. Khan, Macromolecules, 2004, 37, 2233–2239 CrossRef CAS.
| This journal is © The Royal Society of Chemistry 2022 |

