 Open Access Article
Quantum chemical investigation of the effect of alkali metal ions on the dynamic structure of water in aqueous solutions†
Rabi Khanal and
Stephan Irle
 *
*
Computational Sciences and Engineering Division, Oak Ridge National Laboratory, Oak Ridge, Tennessee 37831, USA. E-mail: irles@ornl.gov
First published on 16th September 2022
Abstract
We report quantum chemical molecular dynamics (MD) simulations based on the density-functional tight-binding (DFTB) method to investigate the effect of K+, Na+, and Mg2+ ions in aqueous solutions on the static and dynamic structure of bulk water at room temperature and with various concentrations. The DFTB/MD simulations were validated for the description of ion solvation in aqueous ionic solutions by comparing static pair distribution functions (PDFs) as well as the cation solvation shell between experimental and available ab initio DFT data. The effect of the cations on the water structure, as well as relative differences between K+, Na+, and Mg2+ cations, were analyzed in terms of atomically resolved PDFs as well as time-dependent Van Hove correlation functions (VHFs). The investigation of the VHFs reveals that salt ions generally slow down the dynamic decay of the pair correlations in the water solvation sphere, irrespective of the cation size or charge. The analysis of partial metal–oxygen VHFs indicates that there are long-lived correlations between water and Na+ over long distances, in contrast to K+ and Mg2+.
1 Introduction
Aqueous ionic solutions play an essential role in dynamic chemical processes occurring in nature1–3 as well as human technologies.4–6 The ions are mobile carriers of electronic charge that can carry out a variety of dynamic functions such as signaling purposes or osmotic pressure changes. The ability to transport electric charges is widely used in chemical energy storage applications such as rechargeable batteries and capacitors,4–6 with device power and energy density depending greatly on the electrolyte's ion diffusion7,8 and viscosity9 properties. To advance the performance of capacitors and batteries, it is therefore crucially important to understand the effect of ionic salt addition on the dynamic structure of water at the microscopic level. However, most of the earlier theoretical10–15 and experimental investigations11,15–18 of ion-specific properties in aqueous solutions have been limited to self-diffusion properties, static solvation shell structure, e.g. effective coordination numbers (ECNs),14,15 and pair distribution functions (PDFs). A long-standing discussion in the literature regarding ion–water interactions has focused on the effect of ions on the hydrogen bonding network:10,11,18 smaller ions with higher charge densities are binding the water molecules in the first solvation shell more strongly, and thereby enhance the hydrogen bonding network around them (so-called “structure makers” or “cosmotropes”), whereas larger ions with lower charge densities exhibit the opposite behavior (so-called “structure breakers” or “chaotropes”). However, these concepts are only qualitative, and there is no clear definition by which one could quantitatively classify specific ions in these terms. In addition, dynamic properties of the water shell structure around ions has only recently been investigated by time-dependent, correlated water-ion spectroscopy and simulations.19–23Molecular dynamics (MD) is a powerful computational tool to study the properties of aqueous solutions and provide atomic-scale insights that are helpful for electrolyte analysis. In MD trajectories, the position of every atom is recorded at each point in time, and these time sequences can be used to identify the element-specific physical, chemical, and dynamical properties of the aqueous solutions.24 However, most MD simulations carried out on aqueous electrolytes are limited in their applicability by the accuracy of the respective classical force fields.19,23 Certain force fields are incapable of describing the basic features of the liquid and thus fail to reproduce experimentally observed ion-specific correlated motion.25 A serious drawback of most classical MD force fields is the use of fixed atomic point charges to evaluate the Coulomb interaction between atoms, and incorporating more realistic, spatially extended charge distributions with associated polarizabilities involves empirical schemes and incurs significant computational cost.26 Polarizable force fields have been developed for the simulation of pure water but have not sufficiently matured to faithfully describe aqueous ionic solutions. As an alternative, so-called “first principles” MD (FPMD) simulations based on density functional theory (DFT),27 also often referred to as ab initio MD (AIMD),28 can help to overcome the present difficulties of classical force field methods with ionic charge distributions. Unfortunately, they are computationally rather expensive,29 making it difficult to obtain trajectories of sufficient simulation time length for relevant model system sizes and complexity.30 In this work, we instead employ the density-functional tight-binding (DFTB) method,31–33 which is an approximation to traditional DFT that is 100 to 1000 times faster and provides a trade-off between accuracy and computational efficiency.34 Since DFTB is a quantum chemical method and able to compute nuclear forces during MD simulations by solving Kohn–Sham equations on-the-fly, DFTB/MD35 trajectories not only provide structural features but also contain information on the electronic structure such as charge distributions. This makes the method attractive for the simulation of electrolyte systems.34,36
The aforementioned pair distribution function (PDF) is an important quantity in the analysis of electrolyte structure. It reports the probability of finding a given particle at a distance R from another particle at R = 0, independent of time. Thus, the PDF can be helpful to understand relative atomic positions and the distribution of the atoms around a particular atom. The PDF can serve as a proper parameter in the solid system where particles do not change their positions with time. However, this “static” PDF does not provide information on the time-dependent dynamics of correlations between particles that is reported by the Van Hove correlation function (VHF),37 a time-dependent incarnation of the PDF. It has been shown that the time required for an atom to lose or gain one neighbor is directly linked to the liquid flow.38 In fluids, particles are in constant motion, making local temporal correlations essential to understand the macroscopic transport behavior such as viscosity. For example, the diffusion of ions in aqueous solutions depends on the solution's viscosity, ultimately influencing the performance of capacitors and batteries that use aqueous electrolytes.
The VHF promises to be a powerful tool in understanding the local and correlated motion of aqueous solution as it relates molecular behavior and the macroscopic transport properties simultaneously as a function of positions (r) and time (t). The decay of the first peak in VHF displays both ballistic-like motion within the first solvation shell as well as the correlation between ions. Also, the time decay of the first peak is linked to the viscosity (η) through Maxwell relaxation time τM.39 Hence, the VHF essentially links local microscopic behavior i.e., elementary excitation or the time to lose or gain one neighbor (τLC), to a macroscopic property, namely (τM).38,39 Moreover, the VHF can be obtained from inelastic neutron or X-ray scattering experiments via a double Fourier transform of the dynamic structure factor S(Q, ω), where Q is the momentum transfer and E = ℏω is the energy transfer in scattering. Thus, computation of the VHF provides an opportunity for gaining in-depth molecular-level understanding of element-specific collective motion in an aqueous environment on the picosecond timescale by connecting theoretical simulations with experimental studies. It is non-trivial to resolve element-specific correlation from experiment.22 To understand the element-specific temporal correlation of water with various cations, in this work, we simulated the VHF in an aqueous solution with different concentrations of chloride salts.
DFTB has already been widely used in the literature to explore properties of pure water,40,41 biomolecular systems,42 as well as aqueous electrolytes.43 To the best of our knowledge however, hydration properties of the aqueous solution of most common salts such as NaCl are yet to be explored with the DFTB approach. Further, the use of non-classical methods in the study of VHF is limited to pure water.44 Investigations of the VHF of aqueous solution from molecular simulations have thus far been limited to classical MD simulations.19,25 Here, we performed MD simulations at the DFTB level on the aqueous solutions of the chloride salts KCl, NaCl, and MgCl2. Our validation against DFT results shows that DFTB can be used to explore the hydration effect of ions within reasonable agreement with first principles methods in terms of structure and dynamics predictions. Further, we used DFTB for simulating the Van Hove correlation functions, which show the correlated motion of water molecules and ions. We found that the dynamics of the water hydration shell and the water–cation correlation depends significantly on the type of salt and their ion concentrations.
2 Computational methods
DFTB simulations of alkali metal chlorides in aqueous solution were performed using the divide-and-conquer (DC) implementation in the DCDFTBMD software developed by Nakai et al.36,45–47 Briefly, the DFTB method is based on a two-center approximation of the Kohn–Sham Hamiltonian for valence electrons using optimized electronic parameters as well as interatomic repulsive potentials. The Coulomb interaction between atoms is evaluated using a Taylor expansion of the total DFT electronic energy E in terms of density fluctuations δρ around the sum of atomic reference densities ρ0.32 In the DFTB Taylor series expansion,32 is expressed as: E[ρ] = E0[ρ0] + E1[ρ0, δρ] + E2[ρ0, (δρ)2] + E3[ρ0, (δρ)3] + …. The series can be truncated at various orders giving different DFTB “flavors” with various accuracies in the interatomic coulombic interaction (DFTB1, DFTB2, etc.). In this work, we truncated the DFT energy expression at E3, and employed the empirical γ-damping for hydrogen bonds, known as third-order DFTB, more conveniently called “DFTB3”.33 The corresponding 3ob parameter set developed by Kubillus et al.48 was employed in our simulations. The only exception was the repulsive potential for the H–O interaction, where adopted from the 3obw parameter set developed by Goyal et al.41 In the 3obw parameter set, this particular repulsive potential was specifically optimized in an iterative Boltzmann inversion process to reproduce the experimental PDF for bulk water. To further improve noncovalent interactions, as suggested in Goyal's original work,41 Grimme's D3 empirical dispersion correction with Becke–Johnson damping (D3(BJ))49 was employed in our simulations. In the DC-DFTB method, the total system is divided into small, overlapping fragments called subsystems and buffer regions. The subsystem density matrices are computed in parallel using the local DFTB Hamiltonian, and electron population is determined according to the estimated, overall system's Fermi level. Ultimately, the density matrix of the whole system is obtained by summing up the subsystem density matrices. This technique helps to speed up the calculation compared to the standard DFTB method. To facilitate the DC methodology in the DCDFTBMD software, we selected cubic subsystems with side lengths of 3.0 to 4.0 Å and a buffer radius between 5.8 and 6.0 Å to ensure the reliability of energetics, as well as the numerical stability of the simulations.Model systems used in the simulation consist of 1, 2, 3, and 4 ion pairs (cation–anion) with 128 water molecules in a cubic simulation box. The size of the boxes were adjusted to afford the experimental water density under the simulation conditions (0.997 g cm−3). The corresponding salt concentrations are 0.42, 0.83, 1.21 and 1.58 mol kg−1 for NaCl, 0.42, 0.82, 1.19, 1.54, mol kg−1 for KCl, and 0.42, 0.80, 1.16, 1.49 mol kg−1 for MgCl2. MD simulations in the NVT canonical ensemble at 298 Kelvin (K) were performed for each model system for a total length of 1.6 ns using the Nosé–Hoover thermostat and a time integration step of 0.5 fs. The first 100 ps of the trajectory was used for equilibration, and the remaining 1.5 ns of the run was used for analysis, where MD trajectory snapshots were collected every 10 fs. We note that, based on the simulations with different system sizes (1000, 512, 250 and 128 water molecules) for bulk water, Matsumoto et al.44 found that no significant system size effects are introduced in the smaller systems, and that 128 water molecules are sufficient to study the VHF and its peak behaviors with time. Also, the typical system size used in the study of aqueous ions with AIMD-based simulations is less than or equal to 128 molecules, with the length of the simulation within a few hundred ps. For example, Galib et al.15 used 95 water moles for 80 ps, and Wang et al.14 used 63 water molecules for 50 ps. DC-DFTB scheme used in this study allowed us to achieve 1.6 ns simulations on the system of 128 water molecules with less than 30 K CPU hours.
Here we briefly introduce the technique employed to extract the VHF from the MD trajectory. The VHF, G(r, t) between arbitrary particles, atoms or molecules, is defined as:
 | (1) |
 | (2) |
It is worth mentioning that the VHF, G(r, t) in eqn (1) can be decomposed into two quantities: (i) the self-correlation, a measure for particle diffusion, representing the probability of finding a particle i at time t under the assumption that this same particle was at the origin at t = 0, and (ii) the distinct correlation, representing the probability of finding a particle j that is different from i at time t under the assumption that particle i was at the origin at time t = 0, i.e. The latter describes collective motions for distinct particle pairs. The distinct correlation at time t = 0 is identical to the conventional, static PDF, g(r). Van Hove functions were generated and analyzed using the scattering package50 and functions in the water_vhf_analysis51 github repository.
3 Results and discussion
3.1 Validation of the DFTB/MD methodology
Since the DFTB method employs parameters obtained by way of fitting to selected DFT reference data, it is essential to validate its predictions against known experimental or ab initio results and to gauge the reliability of the chosen DFTB method and parameter sets for the specific materials or chemical systems under consideration.35 We already noted above that the 3obw parameters for water were shown to accurately reproduce the hydration shell structure and the pair distribution function in agreement with experiment.41 More recently, the VHF of water was investigated in a study comparing experimental data with different MD simulation methods, including divide-and-conquer (DC) DFTB with the 3obw parameter set and the D3(DJ) dispersion. In that study, the DC-DFTB3-D3(BJ)/3ob method was found to reproduce the overall nature of the VHF and decay characteristics of various peaks in very good agreement with experiment.44For the purpose of this work, we first compared the hydration shell structure of cations obtained from DFTB/MD simulations with the ab initio MD (AIMD) results reported by Wang et al.14 as shown in Fig. 1. We found generally very good agreement between the DFTB/MD and AIMD PDFs for the position of the cation's first solvation shells, with differences not exceeding 0.2 Å. In the case of the Mg–O PDF, the peak positions are in nearly perfect agreement, and only the intensity of the second peak is somewhat underestimated in DFTB/MD. For both Na+ and K+, the height of the first peak in the DFTB/MD cation–water PDF is likewise somewhat underestimated, whereas here the intensity of the broader second peak is in excellent agreement between DFTB/MD and AIMD. We believe this level of agreement is acceptable since slight deviations in peak position and the height of the PDF are not expected to limit the understanding of the overall trends in the hydration structure of different cations, their effects on the water structure, or the effect of concentration changes. It is further important to recognize that AIMD performed with various DFT functionals can also lead to different PDF peak positions and intensities.14,52
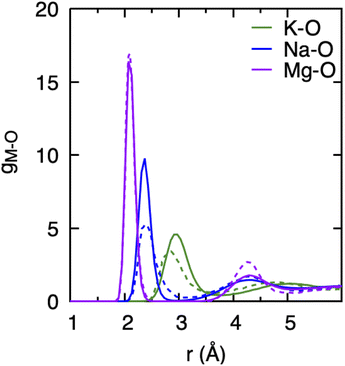 | ||
| Fig. 1 Cation–water pair distribution functions, gM–O, obtained from DFTB/MD simulations of a cation–Cl ion pair in aqueous solution (0.8 mol kg−1). Dotted curves represents data obtained from AIMD (PBE-D3) simulation of cation–Cl in aqueous solutions (1.9 mol kg−1) with 58–62 water molecules simulated for 50 ps, which were extracted from ref. 14. | ||
3.2 Effect of ions on the static structure of water and solvation structure of the ions
In our study, we have used chlorine as a counter anion for all three cations in an aqueous solution. At the low salt concentrations employed here, cations and anions are expected to be solvated by water molecules instead of forming cation–anion pairs. We have plotted the Cl–water PDF gCl–O and its running coordination number (nCl–O) in Fig. 2. All cations have very similar nCl–O with the first peak located ≈3.1 Å. Only a slight difference is observed when comparing gCl–O of the MgCl2 system at a distance between 5.5–6 Å to those of the KCl and NaCl systems. This observed feature in MgCl2 agrees qualitatively with the study performed with X-rays and classical MD simulations of MgCl2 solutions.16 Also, the running coordination number of Cl with O (nCl–O) in the inset in Fig. 2 is identical for all cations, and it lacks any plateau indicating the continuous distribution of water molecules around chloride ion without defined solvation shell. The similar nature of chloride–water PDF and coordination distributions in three cations suggests that the effect of Cl− in water structure will be the same, irrespective of the cation. We therefore conclude that the specific trend observed among the cations regarding water structure and dynamics pertains to cationic features.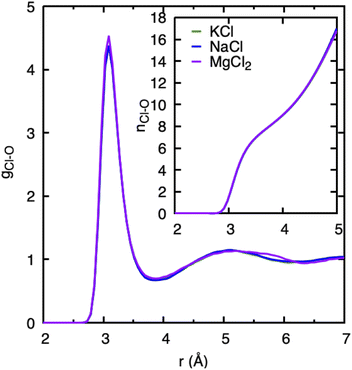 | ||
| Fig. 2 Cl–water pair distribution functions, gCl–O, and running Cl–water coordination numbers nCl–O obtained from DFTB/MD simulations of a cation–Cl ion pair in aqueous solution (0.8 mol kg−1). | ||
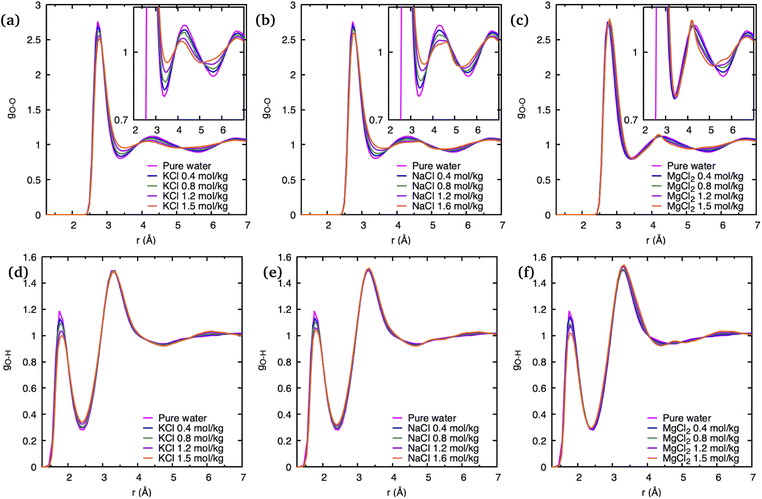
To understand the effect of various cations as well as their concentrations on the static structure of pure water, we have plotted its crucial O–O PDF, gO–O, as well as the O–H PDF, gO–H, in Fig. 3 for all simulated systems. In comparison to gO–H, which seems only affected by salt concentrations in the height of its first peak at 1.9 Å, the gO–O of the ionic solutions shows a more significant deviation from pure water. Although the position of the first peak corresponding to nearest-neighbor O–O correlations at 2.8 Å remains unchanged with the addition of different salts, the intensity of this peak significantly decreases with an increase in salt concentrations. This decrease is consistent with experimental observations and was explained previously as a result of the confluence of multiple ion–O pair positions whose positions coincide with the water O–O peak.23
The greatest overall variation of the O–O PDF as function of salt concentration is observed for K+, with Na+ a close second, and the least variation is visible in that for Mg2+, which is consistent with the order of the respective ionic radii: the ionic radius of K+ is 1.38 Å and that of Na+ is 0.95 Å while it is smallest for the Mg2+ dication with 0.65 Å. Such a trend was previously noted and is consistent with greater solvent exchange reactivity for larger cations.14 In regards to salt concentration changes, we note that deviations of the gO–O from pure water increases with higher number of ion pairs in the solution, and that these deviations tend to “smear out” the pronounced static water structure with increasing salt concentrations.
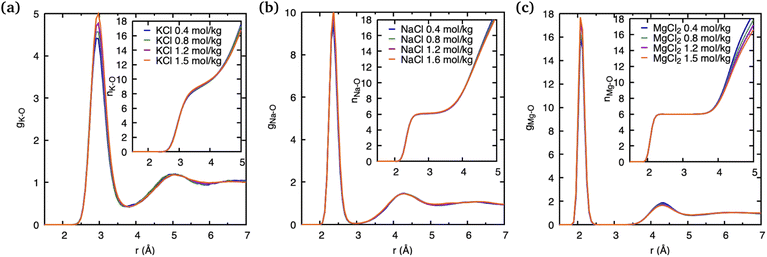
The observations above suggest that the salt ion pairs are partially breaking the hydrogen bond structure of water in their vicinity, with Mg2+ having a less disruptive effect than Na+ and K+. In the following, we analyze in greater detail the solvation structure of different metal (M) cations using the cation–water PDFs, gM–O, and the cation–oxygen coordination number nM. The PDFs shown in Fig. 4 represent the distribution of water oxygen atoms at various distances around the cations. The positions of the first peak in the PDF provides an average of the shortest cation–oxygen distance, rmax, which are consistent with the ordering of the cationic radii mentioned above. Among the three cations, the first hydration shell of K+ is furthest away from the ionic nucleus and considerably less defined, with the first peak in the PDF being broader compared to Na+ and Mg2+. Correspondingly, the heights of the first peaks in the gM–O PDFs increases in the order K+ < Na+ < Mg2+. We do not observe a significant variation of these PDFs with salt concentrations within the range investigated here. Our findings are in very good agreement with the earlier AIMD results reported by Wang et al.14
The area underneath the cation–water PDFs, gM–O, when integrated from the cation nucleus outwards up to a given point, represents the running coordination number, as shown in the insets of Fig. 4. In these plots we can clearly observe that, different from Na+ and Mg2+, the running coordination number of K+ increases continuously without exhibiting a well-defined plateau. Such plateaus are indicative of the existence of a stable solvent coordination shell, here the so-called cation hydration shell, and the integrated value of nM–O at the plateau indicates the number of water molecules that comprise the first hydration shell. The Mg–O running coordination number reaches a well-defined plateau at 2.5 Å indicating the first hydration shell, and the number of water molecules in its first hydration shell is 6. The nature of the Na+ running coordination curve lies between that of K+ and Mg2+, but the number of water molecules in its first hydration shell is also 6. The size of the hydration shell around cations is typically a function of their ionic radii, where smaller ions tend to feature a more well-defined hydration shell and larger ions are associated with more poorly defined hydration shells.
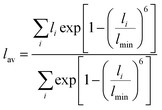
For larger ions such as K+, when there is no clear plateau in the running coordination number, the cation–O coordination number is not sharply defined, which does not allow a clear definition of the number of water molecules participating in the first hydration shell. For such poorly defined coordination shells, various empirical techniques have been devised to estimate an approximate cation coordination number.14,15,53,54 In our study we have employed the technique proposed by Hoppe55,56 who suggested to estimate an average M–O distance and derive from it the so-called effective coordination number (ECN). The average distance, lav, is defined as:
 | (3) |
 | (4) |
Table 1 shows that the average cation–O distance is largest for K+, decreases for Na+ and becomes smallest in the case of Mg2+, consistent with their cationic radii. In each case the distances, rmax, obtained from the PDFs from the centroid of a fitted Gaussian distribution function, are slightly larger than the ones estimated from eqn (3) defining the lav. The deviation between rmax and lav is highest for K+, which could be expected based on its more diffuse hydration shell. There is no significant variation between the cation–O distances with changes in salt concentration, as previously noted for the M–O PDFs. The calculated average distances lav are 2.90 Å for K–O, 2.35 Å for Na–O, and 2.09 Å for Mg–O. We find good agreement between average distances obtained from our DFTB/MD simulations with previously reported AIMD and experimental results for Na–O and Mg–O, see Table 1. The K–O distance is slightly (≈0.1 Å) overestimated compared to the experimental value, nevertheless it lies within the range reported from a previous AIMD simulation. Among the three cations considered, the ECN is highest for K+, followed by Mg2+ which is close to Na+, Table 2. Although the ECNs do not change much with the salt concentration, we find that alkali metal ECNs are slightly higher at higher concentration (1.6 mol kg−1) compared to the lower concentration at 0.80 mol kg−1. Only in the case of Mg2+, its ECN remains almost unchanged ≈5.64 Å within the considered concentration range. Our calculated ECNs at 1.6 mol kg−1 concentration 6.86 for K+, 5.54 for Na+, and 5.64 for Mg2+, are in reasonable agreement with values reported in the literature from AIMD and experiments, see Table 2. In the case of Mg2+, its ECN is slightly underestimated by ≈0.36 compared to AIMD and experimental values. On the other hand, its running coordination number at the plateau in Fig. 1(c) indicates a hydration number of 6, which exactly matches the literature values, Table 2. This indicates that Hoppe's definition of an ECN may not give consistent results across ions with different cationic charges.
In summary, we find that DFTB/MD simulations paint a picture consistent with experimental and available AIMD data, where the largest cation under investigation here, K+, features the most flexible solvation shell and the smaller Na+ and Mg2+ ions have more rigid solvation shells. On the other hand, the loss of a pronounced water shell structure in the static PDF with increasing salt concentration, is more visible in the case of the alkali metal ions, and least noticeable for the Mg2+ cation. Nevertheless, our analysis of the effect of salt ions on the static water structure is consistent with that of a structure breaker or chaotrope, in the approximate order K+ > Na+ > Mg2+.
3.3 Effect of ions on the dynamic water structure – VHFs
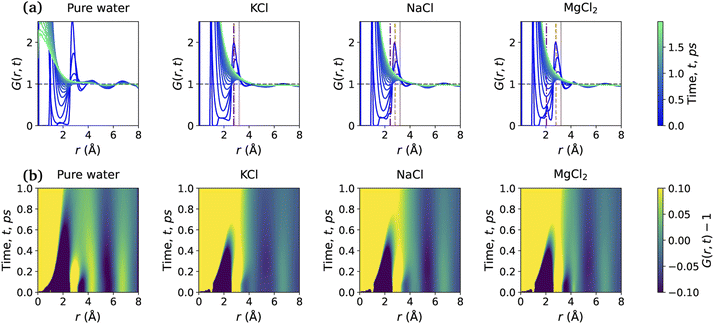
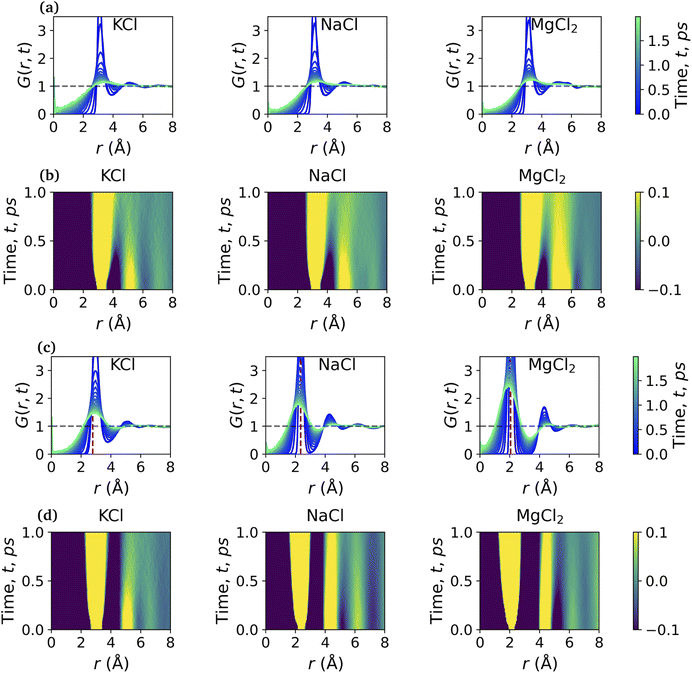
Fig. 5 shows the total VHF, G(r, t) of pure water and the aqueous ionic solutions of KCl, NaCl, and MgCl2 salts at a concentration of 1.2 mol kg−1 molality. Notably, a comparison of the water VHF at room temperature between experiment and various simulations on different potentials previously showed that DFTB/MD could reproduce experiment very well. The first peak of the pure water VHF at t = 0 is at ≈2.8 Å and the second peak is at ≈4.5 Å, consistent with the static PDF of pure water. As time elapses, the first peak position moves towards higher values of r and the second peak position moves towards lower values of r.44As discussed above for the static PDFs, the addition of ions can signficantly influence the water VHF and even introduce distinct new spectral features. Unless otherwise noted, we focus on a salt concentration of 1.2 mol kg−1 molality for clarity, and is sufficient to illustrate the important effects of the salt ions on the water VHF. As was the case for the static water–water PDFs for different salt concentrations shown in Fig. 3, the total VHFs depicted in Fig. 5 as a time series in panel (a) and as a heat map in panel (b), likewise feature a significant intensity decrease in the first peak corresponding to nearest-neighbor O–O correlations at 2.8 Å. This finding is qualitatively consistent with the classical MD simulations for aqueous sodium salts reported in ref. 22.
Other changes in the VHF are somewhat more subtle and are better discussed based on the heatmaps in Fig. 5(b). At first glance it is immediately apparent that the pure water VHF is the spectrum with the most pronounced features, in particular for longer periods of time. This is particularly true for the intensity and long-time decay of the features corresponding to the second and third peaks at ≈4.3 and 6.5 Å. These peaks can be attributed mainly to the O–O pair correlation with molecules in the second and third self-solvation shell. They are less pronounced for the KCl and NaCl salts, with MgCl2 being somewhat in between the other salts and pure water in terms of these long-time decay features. Second in prominence is a feature that is easily overlooked in the time series plots but clearly visible in the heat maps, namely the delayed decay of the first peak corresponding to nearest-neighbor O–O correlations at 2.8 Å for all salt solution VHF spectra. At time scales above 0.5 ps, this peak merges with the peak intensity originating from intramolecular self- and distinct pair correlations, and this merger is a characteristic feature for all ionic solutions. We further note in regards to the first peak that over time it seems to develop a slight shoulder structure at ≈3.21 Å which corresponds to interactions between water oxygen and the chloride anion. We note that qualitatively similar observations were previously made in experiment and classical MD simulations for Na+ salts with different anions.22 An interesting observation can be made for Mg2+, where this delayed decay of the first peak is highly prominent, yet the decrease of intensity and long-time decay features for the second and third peaks at ≈4.3 and 6.5 Å are less pronounced.
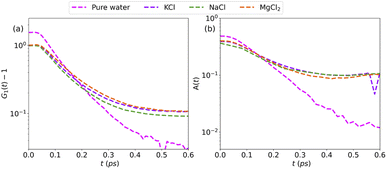
More information can be extracted from the decay behavior of the first-neighbor VHF peak,19 which is related to transport properties and viscosity as they are directly linked to the correlated motions between neighboring particles.20,21,25 The height, G(t) and area under the curve A(t) of the first peak is shown in Fig. 6 for pure water and the three salt solutions at 1.2 mol kg−1 molality. The area under the curve is defined as,20  where G(r, t) > 1 and
  , R1 is the position of the first peak, G1(t).
  and
and  are the local minima on the left and right to R1, respectively. The decaying behavior can be fitted by using a two-step relaxation function. To this end, following the approach described in ref. 22,44, we have fitted A(t) (t ≤ 0.75 ps) to a compressed exponential function of the form A(t) = a1e(−t/τ1)γ1+a2e(−t/τ2)γ2, where τ1 and τ2 represent the relaxation times of the first-step and second step-decay. The fitting results are listed in Table 3. Unsurprisingly, the values obtained here for pure water are in good agreement with the DFTB/3obw values reported previously.44 It is notable, however, that our results for the aqueous NaCl solution also agrees with the corresponding experimental results previously reported by Shinohara et al.23 The addition of NaCl leads to a decrease in a1 and an increase in a2. Likewise, a1 decreases with the addition of KCl and MgCl2, while a2 decreases for KCl and remains unchanged for MgCl2. τ1 remains almost unchanged with the addition of salts, with some decrease associated with τ1 for NaCl. This finding indicates that the first step decay of pair correlation is not significantly changed with the addition of salts. However, τ2 increases significantly with the addition of salts, indicating that the addition of salts induces a slower second step-decay behavior. KCl and MgCl2 exhibit a similar decay behavior among the three salts, in and order of decay time τ2 decays as Na+ ≈ K+ < Mg2+. An increase in salt concentration will further increase the decay time of the first peak height, as shown in Fig. 7.
| Model | a1 | τ1 | γ1 | a2 | τ2 | γ2 |
|---|---|---|---|---|---|---|
| Pure water | 0.439 | 0.154 | 1.657 | 0.060 | 0.440 | 1.386 |
| KCl | 0.295 | 0.158 | 1.712 | 0.105 | 0.721 | 7.540 |
| NaCl | 0.232 | 0.139 | 1.887 | 0.138 | 0.626 | 1.853 |
| MgCl2 | 0.314 | 0.158 | 1.784 | 0.094 | 0.994 | 8.810 |
 | ||
| Fig. 7 Height of first peak, G1(t) as a function of time: (a) KCl, (b) NaCl and (c) MgCl2 at various concentrations. | ||
Since the concentrations of the aqueous ionic solutions under study are relatively low, most of the features of the total VHF are dominated by O–O correlations. To analyze the ion-specific correlation function in greater detail, we have also computed partial VHFs and their intensity maps for water–ions, shown in Fig. 8. O–Cl− partial VHFs, Fig. 8(a) and (b) show that the first peak located between 3 and 4 Å is similar in all three cations, which is also the case in the static PDF shown in Fig. 2. Additionally, it is worth pointing out that the O–Cl correlation in the first peak Fig. 8(b) is extended in time compared to O–O peak correlations observed in pure water VHF Fig. 5(b). Our finding of a slow decay of the water–Cl− first peak correlation agrees qualitatively with the experimental study performed on NaCl solutions.23 The second peak between 4 and 6 Å shows some ion-specific features. Namely, (i) in MgCl2, the second peak is more diffuse in space compared to NaCl and KCl. (ii) Time correlation of the second peak is shortest for KCl, followed by NaCl and MgCl2.
Next, we discuss the feature of water-cation VHFs depicted in Fig. 8(c) and (d). All three cations give rise to their first peak at the sum of ionic radii with the oxygen, namely, 2.78 Å for K, 2.35 Å for Na, and 2.05 Å for Mg. The decay of the first O-M peak is remarkably slow, as it remains clearly visible at time t = 1.5 ps irrespective of the salt type, indicating a strong association between the cation and the water molecules in the first solvation shell. The second peak, located between 4 and 6 Å, shifted towards higher values of r and is short-lived in K+ compared to Na+ and Mg2. The third peak remains only visible for NaCl, which is located at a slightly shorter distance than it appeared in the total VHF of pure water, Fig. 5(d). The partial O–Na VHF indicates that there are long-lived correlations between water and Na+ over long distances, unlike in the case of K+ and Mg2+.
To summarize our observations on the effect of ions on the dynamic structure of water, we find a common picture emerging where the pair correlations in the VHFs of the salt solutions are decaying slower than for pure water, irrespective of the type of salt. The peak intensity and long-time decay of the VHF features corresponding to the second and third peaks at ≈4.3 and 6.5 Å are generally less pronounced in the salt solutions when compared to pure water. The nearest-neighbor O–O interactions for the salt-containing systems decay slower and merge with intramolecular VHF features in the heatmaps, different from that of pure water. Among the salt solutions, Mg2+ shows the slowest decay of pair correlations, with Na+ and K+ exhibiting similar decay characteristics. Partial VHF analysis indicates that the O–M correlations within the first solvation shell of the cations decay remarkably slowly, with the decay of the second solvation shell being less pronounced for Mg2+ and Na+. Surprisingly, the sodium cation exhibits the longest-lived long-range correlations with water motions around it.
4 Conclusion
In summary, we have performed DFTB-based MD simulations for aqueous solutions of KCl, NaCl, and MgCl2 at different salt concentrations. Comparison with available AIMD simulations and experimental results confirmed that DFTB/MD simulations are in the position to accurately describe the effect of cations on the static water structure, and reproduces the AIMD hydration shell of cations in aqueous electrolytes. Our simulations demonstrate for the first time that DFTB/MD methodologies are allowing accurate simulations at a first principles level without the need to empirically fit charges. This opens the possibility to employ the method to fundamentally understand the local correlated motion of water with salt ions through the VHF dynamic pair correlation function, which is not easily accessible to AIMD simulations due to the required simulation system sizes and timescales.Considering only the static PDFs, it is found that the largest cation under investigation here, K+, features the most flexible solvation shell and the smaller Na+ and Mg2+ ions have more rigid solvation shells. The Mg2+ appears to have the smallest effect on the static PDF of pure water, and we find the following order of the cations with respect to their ability to disrupt the water network: K+ > Na+ > Mg2+. This is consistent with the fact that pair correlations in the VHFs of the salt solutions are decaying slower than for pure water, irrespective of the type of salt, with Mg2+ showing the slowest correlation decay. Partial VHF analysis indicates that the O–M correlations within the first solvation shell of the cations decay remarkably slowly, with the decay of the second solvation shell being least pronounced for Mg2+ and Na+. Surprisingly, the sodium cation exhibits the longest-lived correlations with water motions around it, indicating more pronounced long-range effects on water dynamics.
Our combined quantum chemical simulation of the effect of cations on the static and dynamic structure of water further gives credibility to the thesis that it is difficult to draw a clear line between chaotrope and cosmotrope ions, as all ions are delaying correlation decay in their solutions, with Mg2+ having the least impact on the static water structure but greatest impact on its dynamic correlations.
Conflicts of interest
The authors have no conflicts to disclose.Acknowledgements
We would like to thank Dr Ray A. Matsumoto and Prof. Peter T. Cummings of Vanderbilt University, Nashville, TN, for discussions on the generation of the Van Hove function. The authors acknowledge support by the Fluid Interface Reactions, Structures and Transport (FIRST) Center, an Energy Frontier Research Center funded by the U.S. DOE Office of Science. The research used resources of the National Energy Research Scientific Computing Center (NERSC), a U.S. Department of Energy Office of Science User Facility operated under Contract No. DE-AC02-05CH11231. This research made use of the resources at the High-Performance Computing Center at Idaho National Laboratory, which is supported by the Office of Nuclear Energy of the U.S. Dept. of Energy under Contract No. DE-AC07-05ID14517.References
- H. J. Bakker, Chem. Rev., 2008, 108, 1456–1473 CrossRef CAS PubMed.
- Y. Qin, L. Wang and D. Zhong, Proc. Natl. Acad. Sci., 2016, 113, 8424–8429 CrossRef CAS PubMed.
- D. Laage, T. Elsaesser and J. T. Hynes, Chem. Rev., 2017, 117, 10694–10725 CrossRef CAS PubMed.
- Q. Gao, W. Sun, P. Ilani-Kashkouli, A. Tselev, P. R. C. Kent, N. Kabengi, M. Naguib, M. Alhabeb, W.-Y. Tsai, A. P. Baddorf, J. Huang, S. Jesse, Y. Gogotsi and N. Balke, Energy Environ. Sci., 2020, 13, 2549–2558 RSC.
- K. Liang, R. A. Matsumoto, W. Zhao, N. C. Osti, I. Popov, B. P. Thapaliya, S. Fleischmann, S. Misra, K. Prenger, M. Tyagi, E. Mamontov, V. Augustyn, R. R. Unocic, A. P. Sokolov, S. Dai, P. T. Cummings and M. Naguib, Adv. Funct. Mater., 2021, 31, 2104007 CrossRef CAS.
- S. Fleischmann, J. B. Mitchell, R. Wang, C. Zhan, D.-e. Jiang, V. Presser and V. Augustyn, Chem. Rev., 2020, 120, 6738–6782 CrossRef CAS PubMed.
- H. Seyyedhosseinzadeh, F. Mahboubi and A. Azadmehr, Ionics, 2015, 21, 335–344 CrossRef CAS.
- M. A. Cabanero, N. Boaretto, M. Roder, J. Muller, J. Kallo and A. Latz, J. Electrochem. Soc., 2018, 165, A847 CrossRef CAS.
- N. C. Osti, B. P. Thapaliya, S. Dai, M. Tyagi and E. Mamontov, J. Phys. Chem. Lett., 2021, 12, 4038–4044 CrossRef CAS PubMed.
- B. Hribar, N. T. Southall, V. Vlachy and K. A. Dill, J. Am. Chem. Soc., 2002, 124, 12302–12311 CrossRef CAS PubMed.
- R. Mancinelli, A. Botti, F. Bruni, M. A. Ricci and A. K. Soper, J. Chem. Phys. B, 2007, 111, 13570–13577 CrossRef CAS PubMed.
- S. S. Azam, T. S. Hofer, B. R. Randolf and B. M. Rode, J. Phys. Chem. A, 2009, 113, 1827–1834 CrossRef CAS.
- S. Ahmadi, Y. Wu and S. Rohani, CrystEngComm, 2019, 21, 7507–7518 RSC.
- X. Wang, D. Toroz, S. Kim, S. L. Clegg, G.-S. Park and D. D. Tommaso, Phys. Chem. Chem. Phys., 2020, 22, 16301–16313 RSC.
- M. Galib, M. D. Baer, L. B. Skinner, C. J. Mundy, T. Huthwelker, G. K. Schenter, C. J. Benmore, N. Govind and J. L. Fulton, J. Chem. Phys., 2017, 146, 084504 CrossRef CAS.
- K. M. Callahan, N. N. Casillas-Ituarte, M. Roeselová, H. C. Allen and D. J. Tobias, J. Phys. Chem. A, 2010, 114, 5141–5148 CrossRef CAS PubMed.
- J. Mähler and I. Persson, Inorg. Chem., 2012, 51, 425–438 CrossRef.
- P. Ben Ishai, E. Mamontov, J. D. Nickels and A. P. Sokolov, J. Chem. Phys. B, 2013, 117, 7724–7728 CrossRef CAS.
- T. Iwashita, B. Wu, W.-R. Chen, S. Tsutsui, A. Q. R. Baron and T. Egami, Sci. Adv., 2017, 3, e1603079 CrossRef PubMed.
- Y. Shinohara, W. Dmowski, T. Iwashita, B. Wu, D. Ishikawa, A. Q. R. Baron and T. Egami, Phys. Rev. E, 2018, 98, 022604 CrossRef CAS.
- T. Egami and Y. Shinohara, Mol. Phys., 2019, 117, 3227–3231 CrossRef CAS.
- Y. Shinohara, R. Matsumoto, M. W. Thompson, C. W. Ryu, W. Dmowski, T. Iwashita, D. Ishikawa, A. Q. R. Baron, P. T. Cummings and T. Egami, J. Phys. Chem. Lett., 2019, 10, 7119–7125 CrossRef CAS.
- Y. Shinohara, W. Dmowski, T. Iwashita, D. Ishikawa, A. Q. R. Baron and T. Egami, Phys. Rev. Mater., 2019, 3, 065604 CrossRef CAS.
- M. P. Allen and D. J. Tildesley, Computer Simulation of Liquids, Oxford University Press, second edn, 2017 Search PubMed.
- Y. Shinohara, W. Dmowski, T. Iwashita, D. Ishikawa, A. Q. R. Baron and T. Egami, Phys. Rev. E, 2020, 102, 032604 CrossRef CAS PubMed.
- D. Bedrov, J.-P. Piquemal, O. Borodin, A. D. MacKerell Jr, B. Roux and C. SchroÌĹder, Chem. Rev., 2019, 119, 7940–7995 CrossRef CAS PubMed.
- R. Iftimie, P. Minary and M. E. Tuckerman, Proc. Natl. Acad. Sci., 2005, 102, 6654–6659 CrossRef CAS.
- D. Marx and J. Hutter, Ab Initio Molecular Dynamics: Basic Theory and Advanced Methods, Cambridge University Press, 2009 Search PubMed.
- M. Chen, H.-Y. Ko, R. C. Remsing, M. F. Calegari Andrade, B. Santra, Z. Sun, A. Selloni, R. Car, M. L. Klein, J. P. Perdew and X. Wu, Proc. Natl. Acad. Sci., 2017, 114, 10846 CrossRef CAS.
- R. Khanal, N. Ayers, S. Briggs, Y. Wang, S. Banerjee and S. Choudhury, J. Phys. Chem. C, 2020, 124, 4141–4151 CrossRef CAS.
- D. Porezag, T. Frauenheim, T. Köhler, G. Seifert and R. Kaschner, Phys. Rev. B, 1995, 51, 12947–12957 CrossRef CAS PubMed.
- M. Elstner, D. Porezag, G. Jungnickel, J. Elsner, M. Haugk, T. Frauenheim, S. Suhai and G. Seifert, Phys. Rev. B: Condens. Matter Mater. Phys., 1998, 58, 7260–7268 CrossRef CAS.
- M. Gaus, Q. Cui and M. Elstner, J. Chem. Theory Comput., 2011, 7, 931–948 CrossRef CAS PubMed.
- M. A. Addicoat, R. Stefanovic, G. B. Webber, R. Atkin and A. J. Page, J. Chem. Theory Comput., 2014, 10, 4633–4643 CrossRef CAS PubMed.
- B. Hourahine, B. Aradi, V. Blum, F. Bonafé, A. Buccheri, C. Camacho, C. Cevallos, M. Deshaye, T. Dumitrică and A. Dominguez, et al., J. Chem. Phys., 2020, 152, 124101 CrossRef CAS PubMed.
- C.-P. Chou, A. W. Sakti, Y. Nishimura and H. Nakai, Chem. Rec., 2019, 19, 746–757 CrossRef CAS.
- L. Van Hove, Phys. Rev., 1954, 95, 249 CrossRef CAS.
- M. Blodgett, T. Egami, Z. Nussinov and K. Kelton, Sci. Rep., 2015, 5, 1–8 Search PubMed.
- T. Iwashita, D. M. Nicholson and T. Egami, Phys. Rev. Lett., 2013, 110, 205504 CrossRef CAS.
- T. H. Choi, R. Liang, C. M. Maupin and G. A. Voth, J. Phys. Chem. B, 2013, 117, 5165–5179 CrossRef CAS PubMed.
- P. Goyal, H.-J. Qian, S. Irle, X. Lu, D. Roston, T. Mori, M. Elstner and Q. Cui, J. Phys. Chem. B, 2014, 118, 11007–11027 CrossRef CAS PubMed.
- R. Liang, J. M. J. Swanson and G. A. Voth, J. Chem. Theory Comput., 2014, 10, 451–462 CrossRef CAS PubMed.
- C.-P. Chou, A. W. Sakti, Y. Nishimura and H. Nakai, Chem. Rec., 2019, 19, 746–757 CrossRef CAS PubMed.
- R. A. Matsumoto, M. W. Thompson, V. Q. Vuong, W. Zhang, Y. Shinohara, A. C. T. van Duin, P. R. C. Kent, S. Irle, T. Egami and P. T. Cummings, J. Chem. Theory Comput., 2021, 5992–6005 CrossRef CAS PubMed.
- H. Nishizawa, Y. Nishimura, M. Kobayashi, S. Irle and H. Nakai, J. Comput. Chem., 2016, 37, 1983–1992 CrossRef CAS.
- Y. Nishimura and H. Nakai, J. Comput. Chem., 2018, 39, 105–116 CrossRef CAS PubMed.
- Y. Nishimura and H. Nakai, J. Comput. Chem., 2019, 40, 1538–1549 CrossRef CAS PubMed.
- M. Kubillus, T. Kubař, M. Gaus, J. Řeźač and M. Elstner, J. Chem. Theory Comput., 2015, 11, 332–342 CrossRef CAS PubMed.
- J. G. Brandenburg and S. Grimme, J. Phys. Chem. Lett., 2014, 5, 1785–1789 CrossRef CAS PubMed.
- M. Thompson, Scattering, https://github.com/mattwthompson/scattering, accessed: 2020-04-28 Search PubMed.
- R. Matsumoto, Water Van Hove Function Analysis, https://github.com/rmatsum836/water_vhf_analysis, accessed: 2020-04-28 Search PubMed.
- T. T. Duignan, G. K. Schenter, J. L. Fulton, T. Huthwelker, M. Balasubramanian, M. Galib, M. D. Baer, J. Wilhelm, J. Hutter and M. Del Ben, et al., Phys. Chem. Chem. Phys., 2020, 22, 10641–10652 RSC.
- Y. Liu, H. Lu, Y. Wu, T. Hu and Q. Li, J. Chem. Phys., 2010, 132, 124503 CrossRef PubMed.
- R. Khanal, D. B. Buchholz, R. P. H. Chang and J. E. Medvedeva, Phys. Rev. B: Condens. Matter Mater. Phys., 2015, 91, 205203 CrossRef.
- R. Hoppe, Angew. Chem., Int. Ed., 1970, 9, 25–34 CrossRef CAS.
- R. Hoppe, S. Voigt, H. Glaum, J. Kissel, H. P. Müller and K. Bernet, J. Less-Common Met., 1989, 156, 105–122 CrossRef CAS.
- V.-A. Glezakou, Y. Chen, J. L. Fulton, G. K. Schenter and L. X. Dang, Theor. Chem. Acc., 2006, 115, 86–99 Search PubMed.
Footnote |
| † Notice of copyright: this manuscript has been authored by UT-Battelle, LLC under Contract No. DE-AC05-00OR22725 with the U.S. Department of Energy. The United States Government retains and the publisher, by accepting the article for publication, acknowledges that the United States Government retains a non-exclusive, paid-up, irrevocable, worldwide license to publish or reproduce the published form of this manuscript, or allow others to do so, for United States Government purposes. The Department of Energy will provide public access to these results of federally sponsored research in accordance with the DOE Public Access Plan (https://energy.gov/downloads/doe-public-access-plan). |
| This journal is © The Royal Society of Chemistry 2022 |

