 Open Access Article
Synthesis and characterization of CuO@S-doped g-C3N4 based nanocomposites for binder-free sensor applications†
Nigussie Alebachew a,
H. C. Ananda Murthy
 *ab,
Bedassa Abdissa
 a,
Taye B. Demissie
 *c,
Karel G. von Eschwege
 d,
Ernst H. G. Langner
 d and
Liza Coetsee-Hugo
 d
d
aDepartment of Applied Chemistry, School of Applied Natural Sciences, Adama Science and Technology University, P.O. Box 1888, Adama, Ethiopia. E-mail: anandkps350@gmail.com
bDepartment of Prosthodontics, Saveetha Dental College & Hospital, Saveetha Institute of Medical and Technical Science (SIMAT), Saveetha University, Chennai-600077, Tamil Nadu, India
cDepartment of Chemistry, University of Botswana, Pbag UB 00704, Gaborone, Botswana. E-mail: demissiet@ub.ac.bw
dDepartment of Chemistry, University of the Free State, P.O Box 339, Bloemfontein, South Africa
First published on 19th October 2022
Abstract
This study presents the simultaneous exfoliation and modification of heterostructured copper oxide incorporated sulfur doped graphitic carbon nitride (CuO@S-doped g-C3N4) nanocomposites (NCs) synthesized via chemical precipitation and pyrolysis techniques. The results revealed that the approach is feasible and highly efficient in producing 2-dimensional CuO@S-doped g-C3N4 NCs. The findings also showed a promising technique for enhancing the optical and electrical properties of bulk g-C3N4 by combining CuO nanoparticles (NPs) with S-doped g-C3N4. The crystallite and the average size of the NCs were validated using X-ray diffraction (XRD) studies. Incorporation of the cubical structured CuO on flower shaped S-doped-g-C3N4 was visualized and characterized through XRD, HR-SEM/EDS/SED, FT-IR, BET, UV-Vis/DRS, PL, XPS and impedance spectroscopy. The agglomerated NCs had various pore sizes, shapes and nanosized crystals, while being photo-active in the UV-vis range. The synergistic effect of CuO and S-doped g-C3N4 as co-modifiers greatly facilitates the electron transfer process between the electrolyte and the bare glassy carbon electrode. Specific surface areas of the NCs clearly revealed modification of bulk S-doped g-C3N4 when CuO NPs are incorporated with S-doped g-C3N4, providing a suitable environment for the binder-free decorated electrode with sensing behavior for hazardous pollutants. This was tested for the preparation of a 4-nitrophenol sensor.
1. Introduction
Graphitic carbon nitride (g-C3N4), a two-dimensional conjugated polymer with earth-abundant carbon and nitrogen elements, has been manufactured by replacing carbon atoms with nitrogen atoms.1 For the production of g-C3N4 based composites primarily two types of synthetic techniques were used. The first involves mixing of a substance with a carbon nitride precursor and then thermally condensing it at a desired temperature. The second involves post-treating a substance with as-formed g-C3N4 by deposition or simply mixing.2 In this regard, it is important to note that different synthetic approaches have also been reported.3–6 However, the yield of g-C3N4 nanosheets is low, since g-C3N4 is chemically stable and insoluble in common solvents, even at high temperatures and under intensive sonication. As a result, developing a more practical and dependable method for generating high-yield g-C3N4 based hetero-structured NCs is still challenging. To solve this problem, researchers have put a lot of effort into adjusting the properties of g-C3N4 based hybrid NCs via a variety of methods, such as pyrolysis at different temperatures,7 and doping8 with non-metals like boron,9 nitrogen10,11 or sulfur.12–14 An alternative synthesis technique was also reported to adjust the structural and electrical properties of metals and metal oxides assembled on g-C3N4 nanosheets. Examples are zirconia (ZrO2) for adsorption of molecules,12 or copper oxide (CuO) for supercapacitors, synthesized by pyrolysis of C and N rich materials like urea and thiourea.15 Scientific research to improve the structures, precursor effects, band gap, poor visible light absorption, high electron–hole pair recombination and low surface area of g-C3N4 is ongoing.16–20Up to date most groundbreaking research studies focused on modifying the inherent and morphological characteristics of g-C3N4-based nanomaterials in the context of powder suspensions for artificial photosynthesis and environmental remediation. However, a detailed study of the synergistic effect of g-C3N4 and dopants (metals, nonmetals, and metal oxides), which is crucial for improving its activity, reveals its own challenge as visible-light-responsive photocatalyst. Finer details of the local structure, optical characteristics, and composition of the produced materials are not fully defined in many publications on g-C3N4 based NCs and thus uncertainty prevails in many respects. Research into how internal van der Waals heterostructures with spatially oriented charge flow may affect the geometric and electrical characteristics of metal oxides is still in its early stages.
CuO is employed in g-C3N4 heterojunction systems as a co-catalyst or co-photocatalyst to improve some of the shortcomings of pure g-C3N4. Thus, the goal of this study was to add previously unknown features to S-doped g-C3N4-based NCs by combining experimental and computational approaches. The research involved various properties of CuO@S-doped g-C3N4 semiconducting hetero-structured materials as well as methods for incorporating CuO on S-doped g-C3N4 based nanosheets. There are presently a number of DFT-based approaches for predicting structural characteristics, electronic excitation energies and wave functions in materials.21 These followed two approaches; one is from the standpoint of material design, which offers important theoretical direction and prediction, while the other provides valuable information at the levels of atoms, molecules, and unit cells. First-principle calculations, on the other hand, reveal essential information, such as mechanical properties of S-doped g-C3N4, that is difficult to uncover during typical experimental procedures.22 Thus computational techniques have been applied for the study of S-doped g-C3N4![[thin space (1/6-em)]](https://www.rsc.org/images/entities/char_2009.gif) 14,23 and P-doped g-C3N4.11,24
14,23 and P-doped g-C3N4.11,24
Even though there are ongoing efforts to enhance the performance of g-C3N4 for multifunctional applications,19,20,25–28 there is still a need for precise and reliable information on the full structural characterization, pore sizes, morphology, crystallinity, photoluminescence, formation energy, charge analysis, band gap, environmental applications and other features of S-doped g-C3N4 based NCs. Therefore, we hereby report a straightforward procedure for producing CuO@S-doped g-C3N4 semiconducting hetero-structured NCs. We also lay the groundwork for future syntheses, clarifications, and potential uses of such semiconducting NCs utilizing a variety of experimental and computational methods. The overall schematic illustration is presented in Scheme 1.
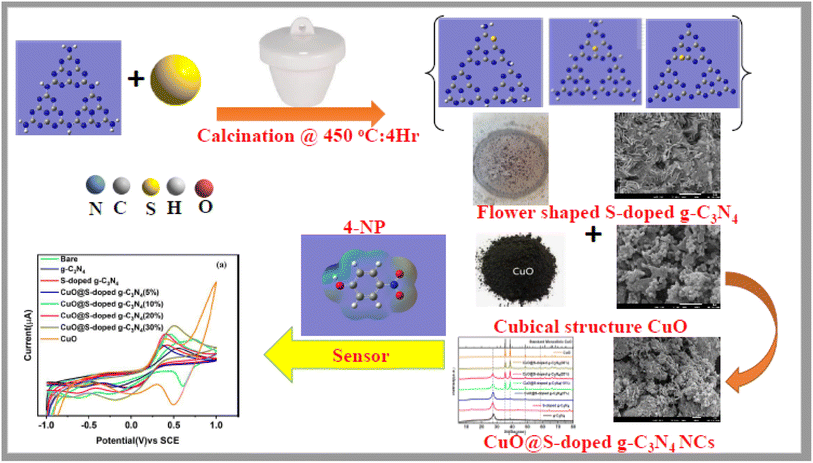 | ||
| Scheme 1 A schematic illustration of the preparation of CuO@S-doped g-C3N4 NCs and its application for the detection of hazardous 4-NP. | ||
2. Experimental
2.1 Chemicals and materials
The chemicals used in this study are urea (CO(NH2)2), ammonium sulphate ((NH4)2SO4), absolute ethanol (CH3CH2OH), sulfuric acid (H2SO4), sodium hydroxide (NaOH), copper nitrate trihydrate (Cu(NO3)2·3H2O), 4-nitrophenol (C6H5NO3), potassium ferric-hexa-cyanide (K3Fe(CN)6, diethyl formamide (DMF) and alumina (Al2O3), all obtained from Sigma-Aldrich. Monosodium hydrogen phosphate (NaH2PO4) and disodium hydrogen phosphate (Na2HPO4) were obtained from Samir Tech-Chem, absolute ethanol (CH3CH2OH) and NaOH from Labmark Chemicals, and KCl and HCl from Riedel-de Haen. All the reagents and chemicals were analytical-grade and used without further purification.2.2 Preparation of sulfur doped graphitic carbon nitride (S-doped g-C3N4) nanocomposite
The S-doped g-C3N4 NCs were prepared by modifying an upgraded gas templating method.29 Measured amounts of ammonium sulphate ((NH3)2SO4, 2 g) and urea (NH3)2CO, 8 g) were used via the following process. First, (NH3)2SO4 was placed at the bottom of a crucible and distributed uniformly (to be used as bed), then urea was laid over ammonium sulphate uniformly distributed on the upper surface. The crucible was then covered with alumina foil and placed in a muffle furnace at 550 °C with temperature rate of 15 °C min−1 for 4 h. After cooling the furnace, the prepared bulk material was dissolved in 100 mL C2H5OH and sonicated (model; BANDELIN electronic Heinrichstrabe 2.4, 12![[thin space (1/6-em)]](https://www.rsc.org/images/entities/char_2009.gif) 207 Berlin, Germany) for 2 h. To remove the unexfoliated impurities the obtained sulfur-doped graphitic carbon nitride was centrifuged at 4000 rpm. After filtering, the sample was dried at room temperature and collected. The exfoliated sample was abbreviated as S-doped g-C3N4 sheets. For comparison, bare g-C3N4 was prepared using pyrolysis of urea at the same heating temperature and time except exfoliation and absence of sulfur.
207 Berlin, Germany) for 2 h. To remove the unexfoliated impurities the obtained sulfur-doped graphitic carbon nitride was centrifuged at 4000 rpm. After filtering, the sample was dried at room temperature and collected. The exfoliated sample was abbreviated as S-doped g-C3N4 sheets. For comparison, bare g-C3N4 was prepared using pyrolysis of urea at the same heating temperature and time except exfoliation and absence of sulfur.
2.3 Synthesis of CuO@S-doped g-C3N4 NCs
The CuO@S-doped g-C3N4 heterostructured NCs were prepared by employing simple chemical precipitation and pyrolysis methods. Copper nitrate was used as precursor to produce CuO NPs. In a typical synthesis, a mixture of C2H5OH and S-doped g-C3N4 was sonicated for 2 h, labeled as solution “A”. The desired amount of Cu(NO3)2·3H2O was stirred by dropwise addition of 0.1 M of NaOH and also stirred while heating at 70 °C until a black precipitate formed, labeled as solution “B”. Solution B was then added to solution A and stirred for 4 h with addition of deionized water until the pH reached ca 10. The mixture was transferred to an oven to dry at 180 °C overnight. After grinding, the sample was placed into a muffle furnace at 500 °C, heating at a rate of 5 °C min−1 for 3 h. After allowing the furnace to cool, CuO@S-doped g-C3N4 hetero-structured NC, CuO@S-doped g-C3N4 (5%), CuO@S-doped g-C3N4 (20%) and CuO@S-doped g-C3N4 (30%) NCs were obtained. In addition, CuO NPs were also synthesized using chemical precipitation method.2.4 Characterization techniques
Combining both the results of the characterization techniques and computational study provided a better understanding of doping efficiency into the host lattice. To observe the effects of combining CuO NPs with S-doped g-C3N4 sheets, either being supported or as a support itself, characterization of the hetero-structured semiconducting materials has been undertaken. The phase structure of the samples was studied by powder X-ray diffraction (XRD) with X-ray tube Cu Kα radiation target Cu, voltage = 40.0 (kV) current = 30.0 (mA) at a scanning speed of 3.0000 (deg/min) (SHIMADZU Corporation (Japan) Model XRD-7000X-RAY DIFFRACTOMETER). The phase purity of the materials was evaluated using Fourier transform infrared (FTIR, Frontier) measured using Spectrum 65 FT-IR (PerkinElmer) in the range 4000–400 cm−1 (resolution: 4 cm−1, number of scans: 4) in KBr pellets. Ultraviolet-visible (UV-vis) diffused reflectance (DRS) spectra were recorded using a scanning-type UV-Vis spectrometer (PerkinElmer, Lambda 950) with a BaSO4-based integrating sphere in the wavelength range of 200 to 800 nm. Thermal degradation and stability of the samples were measured using capillary tubes with a digital melting point apparatus. Thermogravimetric analysis (TGA) and differential thermal analysis (DTA) were performed under a N2 atmosphere (20 mL min−1) using a DTG-60H Shimadzu thermal analyzer. The rate of heating of the sample was set at 15 °C min−1; TGA/DTA techniques were performed with an NETZSCH STA 409 PC/PG, in which a heating rate of 15 °C min−1 was applied between room temperature and 1000 °C. The steady photoluminescence (PL) spectra were carried out on a Cary Eclipse Fluorescence Spectrophotometer (Agilent, Malaysia) with excitation wave length at 324 nm using a xenon (Xe) flash lamp as excitation source.The morphologies of the prepared samples were visually characterized using high resolution scanning electron microscopy/Energy-dispersive X-ray spectroscopy/Secondary electrons diffraction (HR-SEM/EDS/SAED) HR-SEM: JEOL 7800F Field Emission SEM, with an Oxford EDS, EM: JEOL IT200 SEM, with a JEOL EDS. X-ray photoelectron spectroscopic (XPS) analysis (model PHI 5000 Versaprobe) was conducted to study chemical compositions of the prepared hetero-structured materials. A low energy Ar+ ion gun and low energy neutralizer electron gun were used to minimize charging on the surface. A 100 μm diameter monochromatic Al Kα X-ray beam (hν = 1486.6 eV) generated by a 25 W, 15 kV electron beam was used to analyze the different binding energy peaks. Multipack version 9.8 software was utilized to analyze the spectra to identify the chemical compounds and their electronic states using Gaussian–Lorentz fits. Nitrogen adsorption–desorption isotherms and Brunauer–Emmett–Teller were applied for surface area and porosity measurements (isotherms) which were obtained with a Micrometrics ASAP 2020 surface area and porosity analyzer and ASAP 2020 v2.0 software. Data refinement was done with Microactive v1.01 software. Approximately 30 mg of samples were activated under vacuum at 150 °C for 16 h. Samples were cooled to room temperature and N2 adsorption–desorption measurements were done at 77 K.
2.5 Preparation of 4-nitrophenol solution
0.5 mM stock solution of 4-nitrophenol (4-NP) was prepared by dissolving 70 mg 4-NP in 100 mL distilled water, and then filled to 1000 mL in volumetric flask. A series of 4-NP working solutions were freshly prepared from the stock solution by appropriate dilution of the stock solution with 10 mL phosphate buffer solution (PBS, pH = 7.0). All the solutions were prepared with doubly distilled water and all the measurements were carried out at room temperature (25 ± 5 °C).2.6 Electrochemical measurements
The voltammetric experiments were performed using Ivium Technologies B. V. De Zaale 11 5612 AJ Eindhoven, Netherlands, coupled to a personal computer. A conventional three-electrode cell was used for the measurements with a bare glassy carbon electrode (GCE, with a diameter of 3 mm) and/or CuO@S-doped g-C3N4/GCE as the working electrode, Ag/AgCl (3 M KCl) as reference electrode, and a platinum wire as counter electrode. The phosphate buffer (PBS, 0.1 M) electrolyte solutions were prepared using dibasic anhydrous sodium phosphate (Na2HPO4) and monobasic anhydrous sodium phosphate (NaH2PO4) salts with pH variation from 4 to 9, with the application of 0.1 M HCl or 0.1 M NaOH, using a pH meter.Prior to modification, the bare GCE was polished using a polishing cloth with 0.05 μm alumina slurry (Al2O3), washed successively with distilled water and absolute ethanol in an ultrasonic bath for 5 min and dried in air. Typically, to disperse the catalyst (CuO@S-doped g-C3N4), 0.5% wt. solution of catalyst powder was prepared in DMF solvent and then mixed ultrasonically for 30 min to obtain a homogeneous suspension. The suspension of the catalyst was drop-casted on the well-polished GCE surfaces, and then the GCE surfaces were allowed to dry at room temperature. Afterwards, the dried CuO@S-doped g-C3N4 NC was gently washed with deionized water to remove the loosely attached CuO@S-doped g-C3N4 NCs on the GCE surface. A similar procedure was followed to modify the other electrodes. Finally, the modified binder free electrodes were used for the electrochemical measurements.
2.7 Computational methods
In this study, we constructed s-triazine rings from heptazine units (C6N7), which consist of three fused s-triazine rings joined by nitrogen atoms. To mimic the doping of g-C3N4 with sulfur, we investigated substitutions of N1, N2, and N3 with S, respectively, for the three different sites. The findings of geometric optimizations of pure g-C3N4, S-doped g-C3N4, and CuO models were used as input. The results were visualized using Chemcraft 1.8 software. The ABAB-stacking order of s-triazine rings from heptazine units (C6N7) was assumed to ease DFT computations. The DFT method has been used to investigate natural bond orbitals (NBO) and electrostatic potential (ESP) analyses, such as electronic delocalization between donor and acceptor bonds. DFT simulations employing the Becke 3-Lee–Yang–Parr (B3LYP)30–32 hybrid functional was used to estimate the electronic characteristics of the optimized geometries, wavefunctions, and energies of all structures. For all of the atoms, the B3LYP/6-31+G(d,p) method was employed in Gaussian 16.33 Structural stability of the models was calculated using the energies of the lowest unoccupied molecular orbital (LUMO) and highest occupied molecular orbital (HOMO).3. Results and discussion
To understand the key reaction parameters of converting ammonium sulphate and urea to S-doped g-C3N4 sheets, we examined the retainability and delayed release impacts of the self-supporting environment formed by pyrolysis and the reaction temperature. A solid with pale yellow hue was produced on the surface of a closed crucible when a specific quantity of ammonium sulphate was added. However, in an open crucible, all of the components were thermally destroyed and no solid precipitate was observed on the surface. According to studies on thermal decomposition of urea, when gas sources, like ammonium sulphate here, are placed at the bottom of urea, gas transfer from the bottom to the top of the crucible result in better utilization of decomposed gases and disruption of bulk g-C3N4 growth. As a result of high-temperature self-polymerization of sulfur and graphitic carbon nitride, the yellow-colored g-C3N4 phase was formed inside the crucible.293.1. XRD study
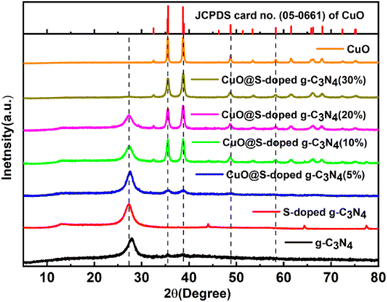
In order to verify phase and structural changes that occurred during integration of S and CuO to g-C3N4, the XRD spectra of pure g-C3N4, S-doped g-C3N4 and CuO@S-doped g-C3N4 (5, 10, 20, and 30%) composites were recorded, as shown in Fig. 1. In the XRD analysis, two significant peaks for bulk g-C3N4 and S-doped g-C3N4 were observed. The low intensity peak at 2θ = 13.4° and strong peak at 26.99° are attributed to (100) and (002) diffraction planes indicating the unique graphitic structure of pure g-C3N4 respectively.34 In comparison to bulk g-C3N4, the strong peak in S-doped g-C3N4 is sharper and more intense, indicating crystallite nature. Moreover, the major peak for S-doped g-C3N4 was found to have shifted negatively to 2θ = 26.99°, which indicates the presence of impurities, in this case S in the precursor material substituting nitrogen atoms. Diffraction patterns reveal that there is no change in the basic structure of g-C3N4 and S-doped g-C3N4 sheets, which is in compliance with reported literature.35The presence of Tenorite phase of monoclinic crystal CuO in the CuO@S-doped g-C3N4 NC is confirmed by fundamental plane orientations at (110), (002), (111), and (202) of CuO (JCPDS card no. (05–0661)), which are assigned to the typical strong peaks at 2θ = (35.728°, 38.940°, 49.031°) and (35.680°, 38.791°, 48.942°) both in the synthesized and standard XRD pattern shown in Fig. 1. The signals were found to rise as the amount of CuO in the NC increases, indicating the possibility of generating a metal–organic hybrid material or a coordination compound dominated by CuO NPs.36,37 The average crystallite size of each catalyst was calculated using Scherrer's formula as given in eqn (1).
 | (1) |
| Material | 2θ | FWHM | D (nm) |
|---|---|---|---|
| S-doped g-C3N4 | 23.984 | 0.642 | 13.23 |
| CuO@S-doped g-C3N4 (5%) | 33.857 | 0.935 | 9.28 |
| CuO@S-doped g-C3N4 (10%) | 31.914 | 1.270 | 6.80 |
| CuO@S-doped g-C3N4 (20%) | 33.846 | 0.931 | 9.32 |
| CuO@S-doped g-C3N4 (30%) | 26.509 | 1.551 | 6.50 |
| Pure CuO NPs | 40.987 | 0.285 | 30.09 |
3.2 Electronic structure analysis
UVvisible/DRS spectral studies of pure g-C3N4, S-doped g-C3N4, CuO@S-doped g-C3N4 NCs and pure CuO NPs were conducted at room temperature in the wavelength region between 200 and 800 nm. As shown in Fig. 2a, all hybrid composites exhibited a broad absorption band near 700 nm, showing an obvious red shift from 450 to 700 nm with the addition of S and CuO, as compared to bulk g-C3N4. It is worth noting that weak absorption tails were seen due to structural defects in hetero-structured samples, which may improve visible absorption of materials. This probably is attributed to structural defects formed in samples treated at a given temperature, showing doping of impurities in pure g-C3N4. The band gap energy (Eg) of the synthesized materials was determined using the Kubelka–Munk formula as given in eqn (2).38| αhυ = A(hv − Eg)n | (2) |
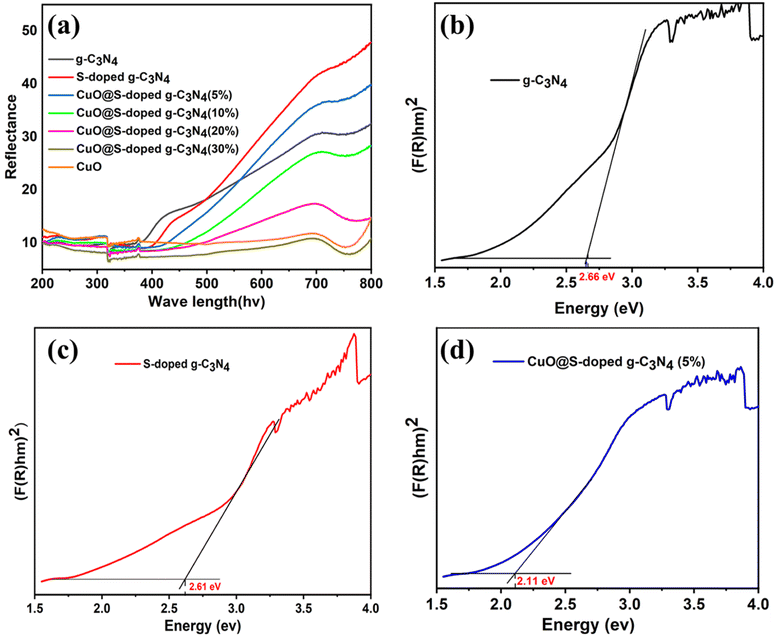 | ||
| Fig. 2 Diffuse reflectance absorption spectra (a) and optical band gap plots transformed by Kubelka–Munk function (b–d) of bulk g-C3N4, S-doped g-C3N4 CuO@S-doped g-C3N4 NC, respectively. | ||
As depicted in Fig. 2 and 3, it can be observed that the direct band gap (Eg) values of the samples are between 2.66 eV for the bulk g-C3N4 and 1.76 eV for pure CuO NPs, while the band gap of the quaternary NC was found to decrease as the amount of CuO increased (Table 2). This may be attributed to the shift to the visible range by doping-induced modification in the lattices and structure of the S-doped g-C3N4 layers shift that are observed for CuO@S-doped g-C3N4 composites.39
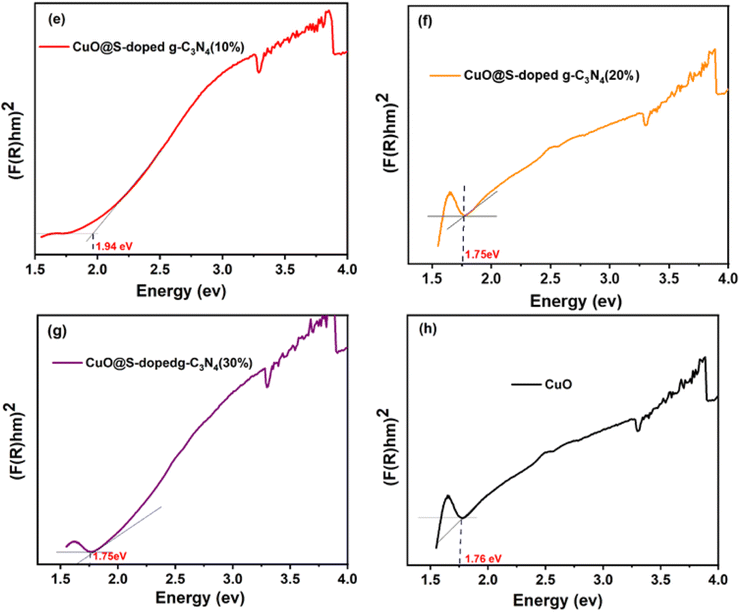 | ||
| Fig. 3 Optical band gap plot transformed by Kubelka–Munk function (e–h) of CuO@S-doped g-C3N4 NCs and pure CuO. | ||
| Samples | Band gap (Eg eV−1) |
|---|---|
| (F(R)hv)1/2 | |
| Pure g-C3N4 | 2.66 |
| S-doped g-C3N4 | 2.61 |
| CuO@S-doped g-C3N4 (CuO = 5%) | 2.11 |
| CuO@S-doped g-C3N4 (CuO = 10%) | 1.94 |
| CuO@S-doped g-C3N4 (CuO = 20%) | 1.75 |
| CuO@S-doped g-C3N4 (CuO = 30%) | 1.75 |
| Pure CuO | 1.76 |
3.3 Functional group studies
The chemical structure of bulk g-C3N4, S-doped g-C3N4, CuO@S-doped g-C3N4 NCs and pure CuO NPs catalysts were investigated by FT-IR technique (Fig. 4). The intense band observed at 811 cm−1 represents a typical bending vibration mode of the s-triazine ring (the out-of-plane bending vibration characteristic of heptazine rings).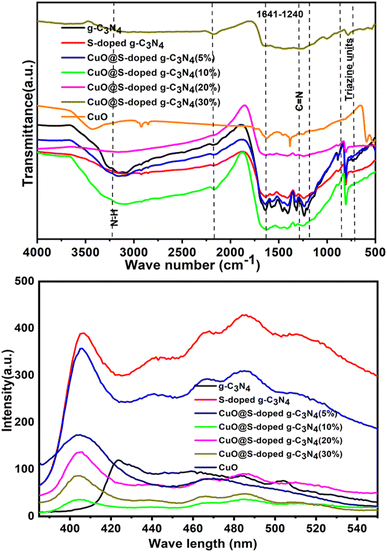 | ||
| Fig. 4 FTIR spectra (top) and PL spectra (bottom) for g-C3N4, S-doped g-C3N4, CuO@S-doped g-C3N4 NCs, and pure CuO. | ||
The fingerprint region of 1200–1700 cm−1 is dominated by C–N and C![[double bond, length as m-dash]](https://www.rsc.org/images/entities/char_e001.gif) N stretching vibrations of the tri-S-triazine rings. The prominent bands in the region of the wide absorption at band 3000–3500 cm−1 are attributed to the stretching modes of terminal –NH groups and C–N of the terminal amino groups by incomplete condensation in g-C3N4. The weak peak of the S–C bond appeared around 710 cm−1 in the FTIR spectrum of S-doped g-C3N4—it corroborates successful incorporation of sulfur into the g-C3N4 structure. S-doped g-C3N4 had similar properties to g-C3N4, however sulfur doping induced a minor change in the band position for the tri-substituted tri-S-triazine ring, indicating that S-doped g-C3N4 was successfully formed.29,40 The absence of visible new bands shows that sulfur vacancies had no effect on the overall framework structure of g-C3N4.41
N stretching vibrations of the tri-S-triazine rings. The prominent bands in the region of the wide absorption at band 3000–3500 cm−1 are attributed to the stretching modes of terminal –NH groups and C–N of the terminal amino groups by incomplete condensation in g-C3N4. The weak peak of the S–C bond appeared around 710 cm−1 in the FTIR spectrum of S-doped g-C3N4—it corroborates successful incorporation of sulfur into the g-C3N4 structure. S-doped g-C3N4 had similar properties to g-C3N4, however sulfur doping induced a minor change in the band position for the tri-substituted tri-S-triazine ring, indicating that S-doped g-C3N4 was successfully formed.29,40 The absence of visible new bands shows that sulfur vacancies had no effect on the overall framework structure of g-C3N4.41
3.4 Photoluminescence (PL) analysis
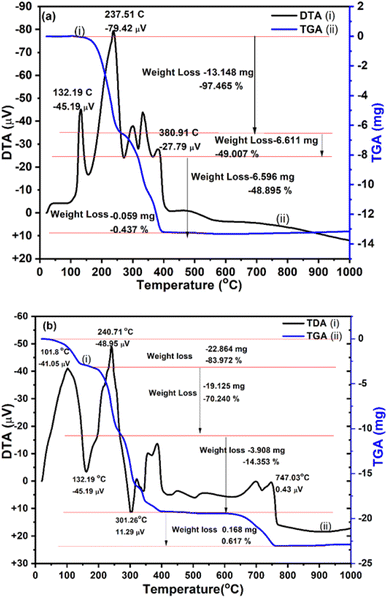
By observing the buildup of electrons on the conduction band, PL is an effective technique for determining the rate at which photogenerated electrons and holes recombine in catalysts. It is generally accepted that photogenerated carriers separate faster at lower fluorescence intensity.42 As shown in Fig. 5, PL peak intensities of CuO@S-doped g-C3N4 (5, 20 and 30% CuO) catalysts at 442 nm were found to be in between S-doped g-C3N4 and bulk g-C3N4, which indicates that CuO deficiencies inhibit the recombination rate of photogenerated carriers in the catalyst and are beneficial to improve photocatalytic and sensor activities. The PL spectrum of the g-C3N4 shows a major characteristic peak at 423.67 nm (Fig. 5). The S-doped g-C3N4 at 406.13 nm had a band that was identical to the quenched PL emission peak at around 485.54 nm, which supports the UV-Vis/DRS. This shows that, in contrast to pristine g-C3N4 sheets, the recombination of photogenerated charge carriers caused by mixing CuO NPs in g-C3N4 was inhibited. For the CuO@S-doped g-C3N4 NCs a wide peak lies between 406.13 and 560.00 nm, and pure CuO NPs at 403.63 nm. The intermediate intensity peak was observed for CuO@S-doped g-C3N4 (CuO = 5, 20 and 30%) NCs between S-doped g-C3N4, and g-C3N4 sheets suggest intermediate electron recombination. This dramatic change in PL intensity magnifies the synergistic effect due to incorporation of CuO NPs into the NCs, which is due to charge transfer at the interfaces of g-C3N4, S-doped g-C3N4 and CuO NPs. The lower recombination rate of photogenerated electron and hole pairs of CuO@S-doped g-C3N4 (CuO = 10%) may be due to structural defects.40,433.5 Thermal stability
To elucidate the contents in CuO@S-doped g-C3N4 NCs and their thermal stabilities, TGA was used from room temperature to 1000 °C at a heating rate of 15 °C min−1 (Fig. 5). The TGA/DTA thermogram shows change in sample weight as a function of temperature under controlled gas atmosphere (N2) and temperature. From DTA (Fig. 5, black line) the dynamic relationship between temperature with change in physical or chemical processes and percentage weight change (gain or lose) over a programmed temperature range, was observed.From the DTA curve, endothermic transformations were observed at 132.19, 237.51 and 300.91 °C. The increase in the rate of weight loss that rises to its maximum and occurs during isomerization is evidence of the breakdown reaction of urea and ammonium sulphate, which results in gases that escape and remove heat from the system.9 The weight loss and endothermic effect may be caused by pyrolysis of urea into g-C3N4 and decomposition of NO3 from ammonium sulfate to form S-doped g-C3N4 during the heating process.
Two heat absorption peaks observed during the first stage of mass loss are apparent from the DTA, providing evidence for endothermic events: first the slow melting of the sample between 22.27 and 132.9 °C (representing melting rather than decomposition by the absence of any detected mass loss) and the first stage decomposition reaction up to 385 °C endothermic transformations. The weight loss and endothermic peaks may be caused by pyrolysis of urea. The second peak located between 200 and 385 °C (about 97.465 wt% weight loss) observed in the TGA curve corresponds to further decomposition of urea and ammonium sulphate to form S-doped g-C3N4 during the heating process. Afterwards, the remaining portions of urea and ammonium sulphate are decomposed very slowly up to 400 °C and become stable. TGA (blue line) plots of CuO@S-doped g-C3N4 NC (Fig. 5) showed behavior that is similar to that of pure S-doped g-C3N4 sample, with significant continuous weight losses in the region 400–615 °C. This confirms that no CuO phase is found in the prepared hybrids. It was also found that the composite that includes CuO starts to burn at a lower temperature, with decomposition of Cu(NO3)2·3H2O being complete at 700 °C, as shown in Fig. 5.
3.6 Morphology and composition analysis
The HR-SEM/EDS technique was used to add understanding of the morphological and elemental composition in the inner and outer surfaces of features of the prepared g-C3N4, S-doped g-C3N4 and CuO @S-doped g-C3N4 heterostructured NCs (Fig. 6). In this technique, the magnified images of the size, shape, elemental composition, crystallography, and other physical and chemical properties were investigated. The samples were subjected to HR-SEM investigation of the bulk g-C3N4, S-doped g-C3N4 and CuO@S-doped g-C3N4, which showed agglomerated particles with irregular shape and variable packing density. The HR-SEM image of the bulk g-C3N4 at different magnification (Fig. 6) shows highest porosity with specific surface area value (Table 2), an irregular shape and desultorily assembled together with the microspheres morphology of typical g-C3N4 particles, similar to observations in other reports.44 CuO@S-doped g-C3N4 NC is composed of three types of morphology microspheres (Fig. 6): a thin straight bar, i.e. rode-shaped S, flower-shaped microsphere S-doped g-C3N4 (Fig. 6), and sphere and cubic-shaped CuO NPs. These results corroborate the successful formation of CuO@S-doped g-C3N4 NC. This kind of hybrid heterostructured composite is believed to enhance the accumulation of electrons on the conduction band to maintain electron flow and reduce the electron–hole recombination rate which can improve the photocatalytic efficiency of the material.45 The aggregated particles' dimensions were found to be substantially greater than what were found in the XRD results. The difference between calculated and observed sizes in the HRSEM micrograph is ascribed to the calculated size being that of a single crystallite, whilst the observed size is that of an agglomeration made up of numerous synthesized crystallites.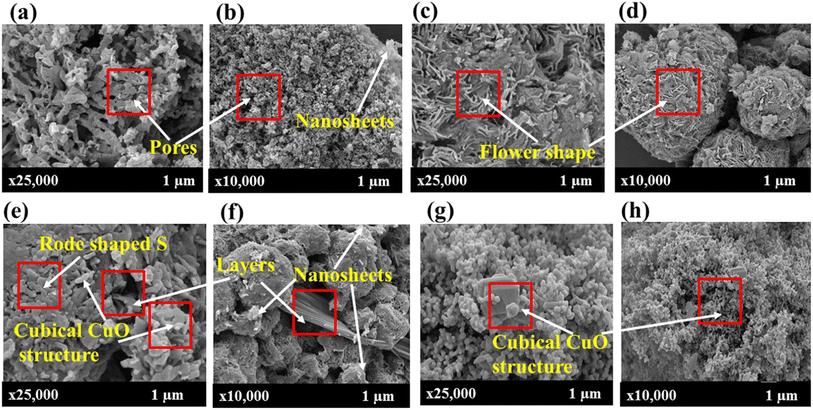 | ||
| Fig. 6 HR-SEM image of (a and b) bulk g-C3N4, (c and d) S-doped g-C3N4, (e and f) CuO@S-doped g-C3N4 composites, and (g and h) cubic shaped CuO NPs at different magnifications. | ||
From the HR-SEM image (Fig. 6), quantitative analysis of CuO@S-doped g-C3N4 NCs (CuO = 29%) reveals atomic weight percentages of N, C, S, Cu and O elements as 35.7, 29.3, 0.1, 17.6 and 11.4 wt%, respectively. These values are close to the theoretical percentage of CuO (30%). This indicated that Cu and O atoms were distributed in the entire host of the S-doped g-C3N4 NC. Where Cu and O were present in the form of CuO, these analyses revealed CuO to be integrated firmly with S-doped g-C3N4 NCs, creating hybrid structures.
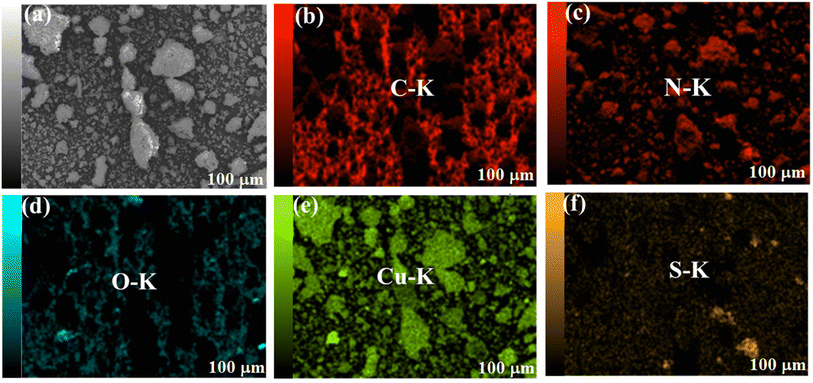
Distribution of the elements in the CuO@S-doped g-C3N4 NC was further inspected using elemental mapping images of CuO@S-doped g-C3N4 from HR-SEM/EDS (Fig. 7). The outcome confirmed a considerable amount of C, N, S, Cu and O elements homogeneously distributed in the CuO@S-doped g-C3N4 NC and only a very small amount of impurity on the upper surface of the CuO@S-doped g-C3N4 NC. In CuO@S-doped g-C3N4 NCs, cubic CuO NPs aggregation on the surface of S-doped g-C3N4 is clearly visible. On the surface of the bulk g-C3N4, on the other hand, S was sparsely scattered.
From the above HR-SEM/EDS analyses, it was observed that the C/N ratio varies from 0.75 to 0.83 in bulk g-C3N4 and S-doped g-C3N4, giving average molecular formula's, C3.5N4 and C3.7N3.8, respectively. The C/N ratio in the CuO@S-doped g-C3N4 NCs is 0.82, which is higher than the theoretical values of 0.75![[thin space (1/6-em)]](https://www.rsc.org/images/entities/char_2009.gif) 46,47 and reported C/N = 0.67 corresponds to the composition of melon annealing at 600 °C.48
46,47 and reported C/N = 0.67 corresponds to the composition of melon annealing at 600 °C.48
3.7 Surface area analysis
Nitrogen adsorption isotherms of pure g-C3N4, S-doped g-C3N4, and CuO@S-doped g-C3N4 samples were measured to gain information about the specific surface area, as shown in Fig. 8. We examined the surface features of synthesized semiconducting NCs by the Brunauer–Emmett–Teller (BET) and Barrett–Joyner–Halenda (BJH) methods. The CuO@S-doped g-C3N4 NC shows remarkable properties in SBET and pore features. The pore size distribution of the samples shows that most of the pores fall into a size range of 2 to 50 nm. Adsorption isotherms are type IV and type H3 hysteresis loops.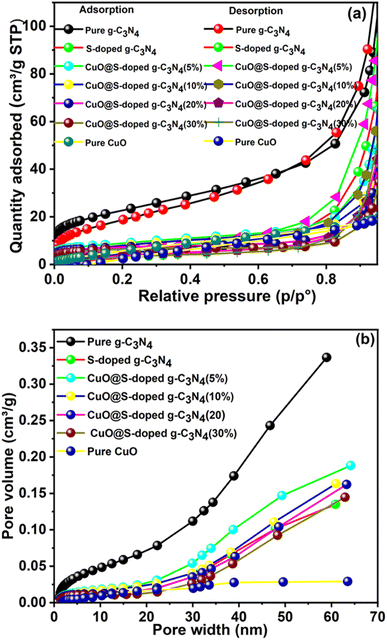 | ||
| Fig. 8 (a) N2 adsorption–desorption BET isotherms, and (b) pore size distribution curves of pure g-C3N4, S-doped g-C3N4, CuO@S-doped g-C3N4 NCs, and pure CuO, measured at 77 K. | ||
For pure g-C3N4, the larger adsorption capacity is found in the high pressure range (P/P° > 0.2), indicating that it has mainly mesopores, while the other NCs achieve most of their N2 adsorption before P/P° = 0.2, an indication of microporosity.49 The specific surface areas of CuO@S-doped g-C3N4 for (5, 10, 20, and 30% of CuO) NCs and pure CuO NPs were calculated to be 30.7, 28.6, 26.6, 22.9 and 28.2 m2 g−1, respectively.
The surface specific area of NC was found to be lower than that of pure g-C3N4 (81.6 m2 g−1), but higher than that of the S-doped g-C3N4 (24.4 m2 g−1). The decreased surface area after doping by S is attributed to disappearance of the small pores, but was gradually enhanced by the appearing of additional small pores when CuO was confined within the NC. This is confirmed by the pore size distribution, shown in Table 3 and Fig. 8b. At the same time, the BJH pore size and volume of CuO@S-doped g-C3N4 NC semiconductors were also increased, implying cavities or tunnels developing in CuO@S-doped g-C3N4 NCs. Therefore, CuO@S-doped g-C3N4 NC has appealing features such as a large specific surface area and a mesoporous structure, allowing for higher degree of absorption, which may be beneficial for aqueous penetration in the photocatalytic reaction. In general, the SBET results illustrate that enhanced photocatalytic performance is not only due to improved electron–hole recombination rate, but also the result of changes in BET surface areas of the samples.
| Samples | SBET (m2 g−1) | Pore volume (cm3 g−1) | Pore size (nm) | ||
|---|---|---|---|---|---|
| BJH adsorption | BJH desorption | BJH adsorption | BJH desorption | ||
| g-C3N4 | 81.6 | 0.33 | 3.74 | 12.7 | 35.9 |
| S-doped g-C3N4 | 24.4 | 0.13 | 0.75 | 15.1 | 23.5 |
| CuO@S-doped g-C3N4 (5%) | 30.7 | 0.19 | 0.23 | 15.9 | 21.2 |
| CuO@S-doped g-C3N4 (10%) | 28.6 | 0.16 | 0.22 | 14.4 | 27.0 |
| CuO@S-doped g-C3N4 (20%) | 26.6 | 0.16 | 0.26 | 16.6 | 45.5 |
| CuO@S-doped g-C3N4 (30%) | 22.9 | 0.14 | 0.26 | 15.4 | 41.6 |
| Pure CuO | 28.2 | 0.04 | 0.06 | 4.1 | 10.0 |
3.8 XPS analysis
The surface chemical compositions of the CuO@S-doped g-C3N4 nanocomposite were investigated by using X-ray photoelectron spectroscopy (Fig. 9). The survey spectrum of g-C3N4 (Fig. 9a) clearly shows that g-C3N4 is composed of only C and N, which is consistent with the chemical analysis. The C 1s and N 1s peaks situated at 288.1 eV and 398.7 eV correlates well with reported values in the g-C3N4 bond.50 The S-doped g-C3N4 (Fig. 9b) sample also reveals prominent peaks for C 1s and N 1s at the same binding energy positions as in Fig. 9a. It is important to note that S was not detected, since the S concentration was below the detection limit of the instrument. High-resolution XPS for C 1s, N 1s, O 1s and S 2p are presented in the SI. The N 1s peak around 397.2 eV was attributed to deprotonated N atoms of C![[double bond, length as m-dash]](https://www.rsc.org/images/entities/char_e001.gif) N–C bonds,51,52 whereas the peak around 398 eV was assigned to the C
N–C bonds,51,52 whereas the peak around 398 eV was assigned to the C![[double bond, length as m-dash]](https://www.rsc.org/images/entities/char_e001.gif) N–C bonds of the melon structure of the graphitic carbon nitride.51,52 In the XPS spectra of S-doped g-C3N4 for S 2p (Fig. S1f†), a peak located around 164.2 eV was assigned to C–S.40,53 The peak around 283.7 eV in the C 1s spectrum (Fig. S1c†) was also assigned to the C–S bond of S-g-C3N4, whereas the peak around 286.6 eV was assigned to the N
N–C bonds of the melon structure of the graphitic carbon nitride.51,52 In the XPS spectra of S-doped g-C3N4 for S 2p (Fig. S1f†), a peak located around 164.2 eV was assigned to C–S.40,53 The peak around 283.7 eV in the C 1s spectrum (Fig. S1c†) was also assigned to the C–S bond of S-g-C3N4, whereas the peak around 286.6 eV was assigned to the N![[double bond, length as m-dash]](https://www.rsc.org/images/entities/char_e001.gif) C–N bond.54,55 This overall analysis is in line with previous reports.19,40,51–53
C–N bond.54,55 This overall analysis is in line with previous reports.19,40,51–53
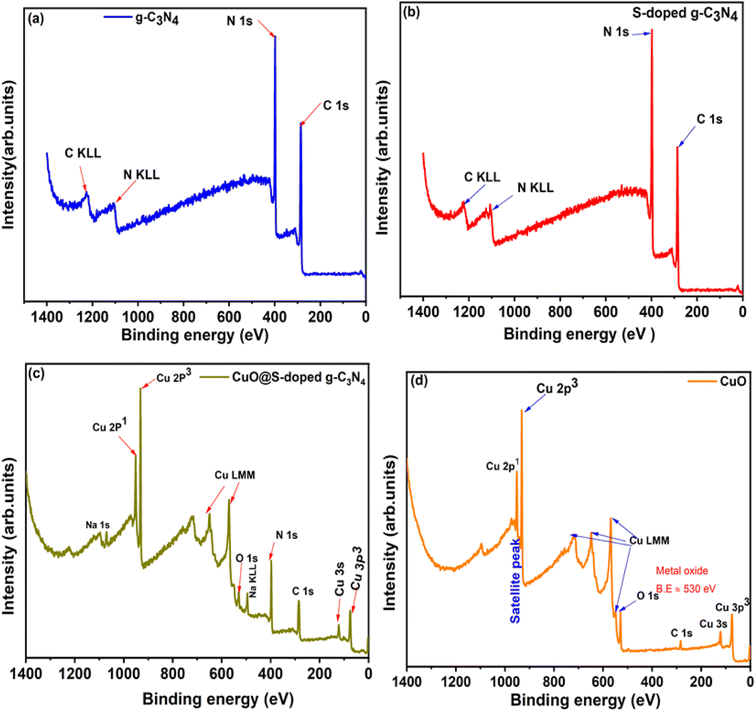 | ||
| Fig. 9 XPS survey spectra for (a) pure g-C3N4, (b) S-doped g-C3N4, (c) CuO@S-g-C3N4 NCs and (d) pure CuO. | ||
Cu 2p, 3s and 3p peaks were clearly detected for the CuO@S-doped g-C3N4 NC and pure CuO samples in Fig. 9c and d. O 1s was detected in the CuO sample (Fig. 9d) at 529.6 eV and this correlated well with the binding energy value of O 1s in CuO.56 In Fig. 9d, C 1s was detected, which is ascribed to an impurity. High-resolution peaks for Cu 2p were recorded in order to investigate the bonding environment in the CuO@S-doped g-C3N4 NC and pure CuO matrix. In CuO@S-g-C3N4 NC (Fig. 10a) the two peaks at 932.7 and 952.3 eV were assigned to the Cu 2p3/2 and Cu 2p1/2 spin orbit splitting peaks of Cu.56 Fig. 10b shows the Cu 2p peak for pure CuO NPs. The Cu 2p3/2 peak is seen at 933.7 eV and this together with the peak shape clearly indicates the CuO bond. The O 1s peak in the CuO sample (Fig. 9d) is situated at 529.6 eV, which correlates well with O 1s in CuO.56 Fig. 10b suggests that Cu is in the 2+ oxidation state, while Fig. 10a suggests a metallic state of Cu. The reason for this may be due to thermal decomposition of CuO at elevated temperatures during the pyrolysis process.
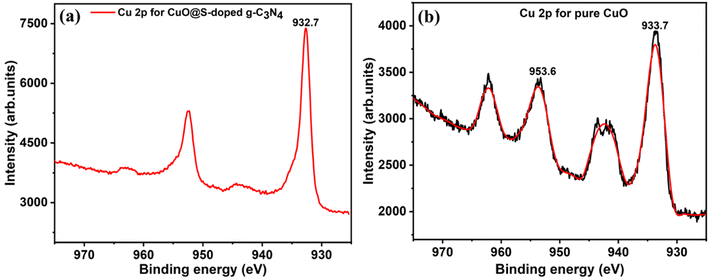 | ||
| Fig. 10 XPS high resolution spectra of (a) Cu 2p peaks for CuO@S-doped g-C3N4, and (b) Cu 2p peaks for pure CuO NP. | ||
3.9. Electrochemical characterizations of the modified electrodes
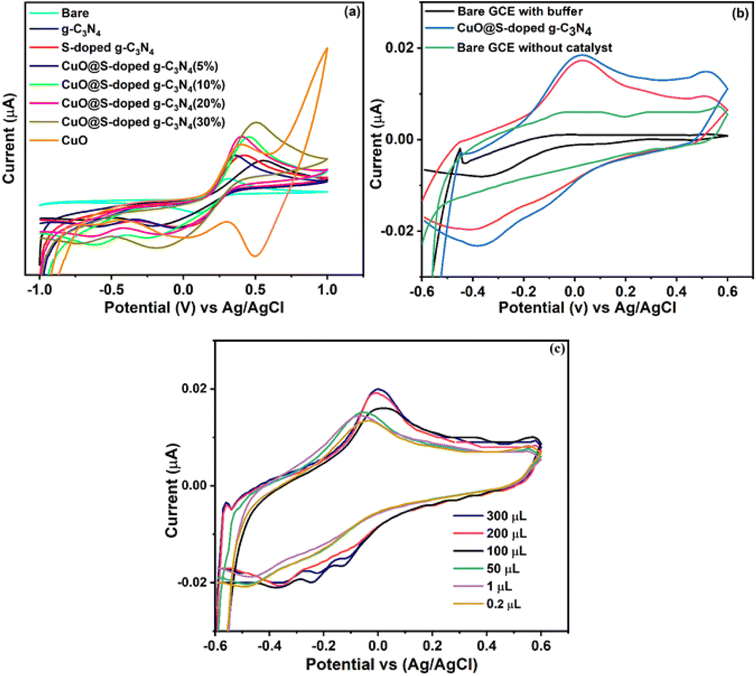
CuO@S-doped g-C3N4/GCE was characterized by cyclic voltammetry in 5 mM [Fe(CN)6]3−/4− redox probe electrolyte solution containing 0.1 M KCl as shown in Fig. 11a, in the range, −0.8 to 1.0 V, at a scan rate of 50 mV s−1. The modified CuO@S-doped g-C3N4/GCE electrode (CuO = 30%) results exhibit a well-defined redox peak with high electron transfer capability when compared to g-C3N4/GCE, S-doped g-C3N4/CPE, CuO/CPE and bare GCE. Herein, S-doped g-C3N4/GCE shows low electron transfer when compared to other electrodes, which is ascribed to its low electrical conductivity that restricts the electron transfer probe [Fe(CN)6]3−/4− along the surface of the GCE. When the CuO@S-doped g-C3N4/GCE electrode was introduced, electrical conductivity was enhanced and peak-to-peak separation (reversible process) was reduced due to the large surface area provided by g-C3N4. The redox process probed by the electrode at scan rates varying from 20 to 100 mV s−1 was shown to be enhanced in the cyclic voltammetry results. The electron transfer mechanism between the electrolyte and the bare glassy carbon electrode is substantially facilitated by the synergistic impact of CuO and S-doped g-C3N4 as co-modifiers, as shown in Fig. 11a. The NC with 30% CuO performed better in terms of sensing than the others. According to Table 3, bulk g-C3N4 has a surface area of 81.6 m2 g−1. The surface area reduced to 24.4 m2 g−1 after sulfur doping and further decreased to 22.9 m2 g−1 after adding CuO. This amply demonstrated the alteration of the S-doped g-C3N4 and offers a favorable environment for the binder-free decorated electrode with hazardous pollutant sensing behavior. We tested the modified electrode to sense 4-nitrophenol in order to verify such an observation.3.10. Electrochemical behavior of 4-NP at the modified electrode
Cyclic voltammetry was used to study electrochemical characteristics of CuO@S-doped g-C3N4/GCE, bulk g-C3N4 GCE, S-doped g-C3N4/GCE, and CuO/GCE in 0.1 M Na2HPO4/NaH2PO4 buffer solution of pH = 7 at a scan rate of 50 mV s−1 (Fig. 11a). Using bare GCE, no oxidation peak was observed, however, CuO@S-doped g-C3N4/GCE (20 and 30% of CuO) and pure S-doped g-C3N4/GCE exhibits oxidation of 4-NP when using the 30% CuO electrode in the composite. The oxidation peak in Fig. 11b is that of 4-NP. At +0.030 V, the oxidation peak current, Ipa = −4.85 × 10⁻⁶ A, is recorded for the bare GCE. The 4-NP oxidation peak current, Ipa = 1.78 × 10⁻⁵ A, increased with negatively shifted peak potential to −0.020 V at CuO@S-doped g-C3N4/GCE, indicating that the electrochemical oxidation of 4-NP was significantly improved. This demonstrates that CuO@S-doped g-C3N4/GCE has a greater redox peak current than the other modified electrodes. This high oxidation peak current when using CuO@S-doped g-C3N4/GCE, is attributed to the production of a synergistic effect due to CuO. There are two reasons for this improvement. Firstly, the BET analyses showed that CuO@S-doped g-C3N4 has a large surface area, which allows for abundant active sites. Secondly, CuO@S-doped g-C3N4 NC has electron-rich O and N atoms that could interact with 4-NP. CuO@S-doped g-C3N4 NC allows for a strong electrocatalytic mediation effect, which significantly increased the current (−4.85 × 10⁻⁶ A to 1.78 × 10⁻⁵ A). Therefore, CuO@S-doped g-C3N4/GCE was considered as the working electrode.3.11. Effect of pH
The influence of pH when using a 0.1 M phosphate buffer solution (0.1 M Na2HPO4 – 0.1 M NaH2PO4) (PBS) on the electrode reaction of 100 μM of 4-NP was recorded at pH 5, 7 and 9 at the favored scan rate of 50 mVs−1. The effect of pH on the oxidation of 100 μM 4-NP at CuO@S-doped g-C3N4/GCE was investigated using cyclic voltammetry at a pH range 3 to 9, also at 50 mVs−1. As shown in Fig. 11c, the oxidation peak current of 4-NP gradually shifted to the right when increasing pH from 4 to 9, however, maximum current was achieved at pH 7 with oxidation peak shift towards negative potentials. Thus, pH 7 was chosen for the subsequent analytical experiments.3.12. Effect of concentration
The sensing behavior of CuO@S-doped g-C3N4/GCE was also investigated by cyclic voltammetry at diverse concentrations of 4-NP varying from 0.1 to 300 μM in the presence of 0.1 M PBS (pH = 7) and scan rate of 50 mV s−1, see Fig. 11c. It is seen that the oxidation peak current response of 4-NP was gradually increased when the concentration of 4-NP was increased from 0.02 to 300 μM. When a concentration of 0.1 μM was reached, the peak shift occurred. These observations suggest that the CuO@S-doped g-C3N4/GCE modified electrode has an excellent detection activity at lower concentrations of 4-NP.573.13. Computational results
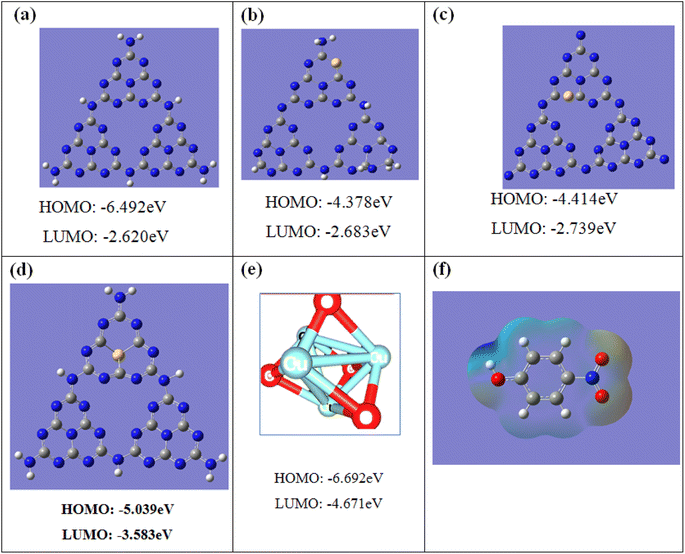
Since the exact position for S and CuO substitution cannot be identified experimentally, we did DFT calculations to elucidate the electronic structure of CuO@S-doped C3N4. Geometric optimizations of pure g-C3N4, S-doped g-C3N4, and CuO models were performed with the DFT/B3LYP/6-31+G(d,p) method. An atomic structure model of pure g-C3N4 composed of melon units (S-triazine) was constructed as shown in Fig. 12. In this model, three types of periodic N atoms exist in the melon system, indicated as N1, N2, and N3 numbered based on their positions for S substitution. The DFT-calculated band gap of S-doped g-C3N4 is slightly underestimated. Although Eg results are found to depend on the doping condition and type of basis set, the overall DFT result is that all considered doping scenarios are unfavorable; hence all calculated values presented in Table 4 are lower than the corresponding experimental values. It is nevertheless seen that the gap narrows down to ∼1.5 eV upon doping compared to experimental value. It is worth mentioning that DFT calculations show narrowing of the band gap upon doping. Since S is a much larger atom than N and C, it was found that for the optimized geometries, substitution of N with S caused a significant lattice distortion, which in turn changed the Eg values, while in all the other cases of substitution of N with S, the structure kept a planar geometry, in agreement with a previous study.8| Sample | Band gap (Eg) (eV) | |
|---|---|---|
| DFT | Experimental | |
| Pure g-C3N4 | 3.87 | 2.61 |
| S-center out | 1.66 | 2.63 |
| S-in-between | 1.46 | — |
| S-outside | 1.70 | — |
4. Conclusions
In this study, pyrolysis and elementary chemical techniques were used to successfully produce CuO@S-doped g-C3N4 nanocomposites. The structural characterization, pore sizes, morphology, crystallinity, photoluminescence, formation energy, charge analysis, and band gap data for CuO@S-doped g-C3N4 NCs were examined using a variety of experimental and computational techniques. The outcomes confirmed the successful formation of CuO@S-doped g-C3N4 NCs. The HR-SEM/EDS investigations revealed that the C/N ratio in both bulk and S-doped g-C3N4 ranges from 0.75 to 0.83. Additionally, it was discovered that the CuO@S-doped g-C3N4 NC had desirable qualities, such as a sizable specific surface area and a mesoporous structure that permits a higher degree of absorption, which may be advantageous for aqueous penetration during photocatalytic processes. From the electrochemical studies, it was observed that the electron transfer mechanism between the electrolyte and the bare glassy carbon electrode is substantially facilitated by the synergistic impact of CuO and S-doped g-C3N4 as co-modifiers. BET results demonstrated alteration of S-doped g-C3N4, which offers a favorable environment for the binder-free decorated electrode with hazardous pollutant sensing behavior. As a result, the synthesized NCs were used to detect 4-nitrophenol, a recognized environmental pollutant. CuO@S-doped g-C3N4 NCs were demonstrated as promising candidates for binder-free electrode materials that may be manufactured for the purpose of monitoring environmental pollutants and for a variety of electrochemical applications employing low-cost cyclic voltammetry techniques.Conflicts of interest
The authors have no conflicts of interest to declare.Author contributions
NA, HCAM, BA and TBD designed and run the experiments, analyzed the data and wrote the original draft; NA, KGvE, EHGL and LCH run the characterization experiments; HCAM, BA and TBD supervised the work, and all authors reviewed and edited the article.Acknowledgements
The authors acknowledge Adama Science and Technology University (ASTU) for supporting this project through the Ministry of Education (MoE) of Ethiopia. The authors extend their acknowledgement to the Department of Construction Technology Management and Food Science and Engineering of Wolkite University, Departments of Chemistry of the University of Botswana, and the University of the Free State, South Africa, for research facilities. Computational resources were supplied by Metacentrum under the project ‘e-Infrastructure CZ’ (e-INFRA CZ LM2018140) supported by the Ministry of Education, Youth and Sports of the Czech Republic.References
- F. Magesa, Y. Wu, Y. Tian, J.-M. Vianney, J. Buza, Q. He and Y. Tan, Trends Environ. Anal. Chem., 2019, 23, e00064 CrossRef CAS.
- A. Sudhaik, P. Raizada, P. Shandilya, D.-Y. Jeong, J.-H. Lim and P. Singh, J. Ind. Eng. Chem. Res., 2018, 67, 28–51 CrossRef CAS.
- S. M. Hosseini H, R. Siavash Moakhar, F. Soleimani, S. K. Sadrnezhaad, S. Masudy-Panah, R. Katal, A. Seza, N. Ghane and S. Ramakrishna, Appl. Surf. Sci., 2020, 530, 147271 CrossRef CAS.
- W.-D. Oh, L.-W. Lok, A. Veksha, A. Giannis and T.-T. Lim, J. Chem. Eng., 2018, 333, 739–749 CrossRef CAS.
- M. Seredych, S. Łoś, D. A. Giannakoudakis, E. Rodríguez-Castellón and T. J. Bandosz, ChemSusChem, 2016, 9, 795–799 CrossRef CAS PubMed.
- Y. Duan, Mater. Res. Bull., 2018, 105, 68–74 CrossRef CAS.
- F. Dong, Z. Wang, Y. Sun, W.-K. Ho and H. Zhang, J. Colloid Interface Sci., 2013, 401, 70–79 CrossRef CAS.
- Q. Guo, Y. Zhang, J. Qiu and G. Dong, J. Mater. Chem. C, 2016, 4, 6839–6847 RSC.
- J. Zou, Y. Yu, W. Yan, J. Meng, S. Zhang and J. Wang, J. Mater. Sci., 2019, 54, 6867–6881 CrossRef CAS.
- D. Zhu and Q. Zhou, Appl. Catal., B, 2021, 281, 119474 CrossRef CAS.
- J. Liu, J. Alloys Compd., 2016, 672, 271–276 CrossRef CAS.
- K. Zhang, M. Zhou, C. Yu, K. Yang, X. Li, W. Dai, J. Guan, Q. Shu and W. Huang, Dyes Pigm., 2020, 180, 108525 CrossRef CAS.
- S. Stolbov and S. Zuluaga, J. Condens. Matter Phys., 2013, 25, 085507 CrossRef PubMed.
- G. Chen and G. Shang-Peng, Chin. Phys. B, 2012, 21, 107101 CrossRef.
- J.-R. Zhang, X.-F. Wu, X. Tong, C.-X. Zhang, H. Wang, J.-Z. Su, Y.-N. Jia, M. Zhang, T.-L. Chang and Y.-X. Fu, J. Nanosci. Nanotechnol., 2020, 20, 3424–3431 CrossRef CAS PubMed.
- C. Tian, H. Zhao, J. Mei and S. Yang, Chem.–Asian J., 2019, 14, 162–169 CrossRef CAS PubMed.
- Y. Xu and S.-P. Gao, Int. J. Hydrogen Energy, 2012, 37, 11072–11080 CrossRef CAS.
- W.-J. Ong, L.-L. Tan, Y. H. Ng, S.-T. Yong and S.-P. Chai, Chem. Rev., 2016, 116, 7159–7329 CrossRef CAS.
- P. P. Singh and V. Srivastava, RSC Adv., 2022, 12, 18245–18265 RSC.
- R. S. Chouhan, I. Jerman, D. Heath, S. Bohm, S. Gandhi, V. Sadhu, S. Baker and M. Horvat, Nano Sel., 2021, 2, 712–743 CrossRef CAS.
- B. Zhu, B. Cheng, L. Zhang and J. Yu, Carbon Energy, 2019, 1, 32–56 CrossRef CAS.
- L.-w. Ruan, Y.-j. Zhu, L.-g. Qiu and Y.-x. Lu, Vacuum, 2014, 106, 79–85 CrossRef CAS.
- Y. Wang, Y. Tian, L. Yan and Z. Su, J. Phys. Chem. C, 2018, 122, 7712–7719 CrossRef CAS.
- Y. Miyamoto, M. L. Cohen and S. G. Louie, Solid State Commun., 1997, 102, 605–608 CrossRef CAS.
- K. Sharma, P. Raizada, A. Hosseini-Bandegharaei, P. Thakur, R. Kumar, V. K. Thakur, V.-H. Nguyen and S. Pardeep, Process Saf. Environ. Prot., 2020, 142, 63–75 CrossRef CAS.
- Y. Gu, A. Bao, X. Zhang, J. Yan, Q. Du, M. Zhang and X. Qi, Mater. Chem. Phys., 2021, 266, 124542 CrossRef CAS.
- C. Rajkumar, P. Veerakumar, S.-M. Chen, B. Thirumalraj and K.-C. Lin, ACS Sustainable Chem. Eng., 2018, 6, 16021–16031 CrossRef CAS.
- V. Nisha, S. Moolayadukkam, A. Paravannoor, D. Panoth, Y.-H. Chang, S. Palantavida, S. J. Hinder, S. C. Pillai and B. K. Vijayan, Inorg. Chem. Commun., 2022, 142, 109598 CrossRef CAS.
- H. Guo, Z. Shu, D. Chen, Y. Tan, J. Zhou, F. Meng and T. Li, Chem. Phys., 2020, 533, 110714 CrossRef CAS.
- P. J. Stephens, F. J. Devlin, C. F. Chabalowski and M. J. Frisch, J. Phys. Chem., 1994, 98, 11623–11627 CrossRef CAS.
- C. Lee, W. Yang and R. G. Parr, Phys. Rev. B, 1988, 37, 785–789 CrossRef CAS PubMed.
- A. D. Becke, J. Chem. Phys., 1993, 98, 5648–5652 CrossRef CAS.
- M. J. Frisch, G. W. Trucks, H. B. Schlegel, G. E. Scuseria, M. A. Robb, J. R. Cheeseman, G. Scalmani, V. Barone, G. A. Petersson, H. Nakatsuji, X. Li, M. Caricato, A. V. Marenich, J. Bloino, B. G. Janesko, R. Gomperts, B. Mennucci, H. P. Hratchian, J. V. Ortiz, A. F. Izmaylov, J. L. Sonnenberg, D. Williams-Young, F. Ding, F. Lipparini, F. Egidi, J. Goings, B. Peng, A. Petrone, T. Henderson, D. Ranasinghe, V. G. Zakrzewski, J. Gao, N. Rega, G. Zheng, W. Liang, M. Hada, M. Ehara, K. Toyota, R. Fukuda, J. Hasegawa, M. Ishida, T. Nakajima, Y. Honda, O. Kitao, H. Nakai, T. Vreven, K. Throssell, J. A. Montgomery Jr, J. E. Peralta, F. Ogliaro, M. J. Bearpark, J. J. Heyd, E. N. Brothers, K. N. Kudin, V. N. Staroverov, T. A. Keith, R. Kobayashi, J. Normand, K. Raghavachari, A. P. Rendell, J. C. Burant, S. S. Iyengar, J. Tomasi, M. Cossi, J. M. Millam, M. Klene, C. Adamo, R. Cammi, J. W. Ochterski, R. L. Martin, K. Morokuma, O. Farkas, J. B. Foresman and D. J. Fox, Gaussian16, Revision C.01, Gaussian, Inc., Wallingford CT, 2016 Search PubMed.
- J. Liu, T. Zhang, Z. Wang, G. Dawson and W. Chen, J. Mater. Chem., 2011, 21, 14398–14401 RSC.
- K. Wang, Q. Li, B. Liu, B. Cheng, W. Ho and J. Yu, Appl. Catal., B, 2015, 176–177, 44–52 CAS.
- D. Liu, C. Lu and J. Wu, J. Nanopart. Res., 2018, 20, 277 CrossRef.
- Y. Huang, Y. Tan, C. Feng, S. Wang, H. Wu and G. Zhang, Microchim. Acta, 2018, 186, 10 CrossRef PubMed.
- A. C. Pradhan, B. Nanda, K. M. Parida and G. R. Rao, J. Phys. Chem. C, 2015, 119, 14145–14159 CrossRef CAS.
- M.-H. Vu, M. Sakar, C.-C. Nguyen and T.-O. Do, ACS Sustainable Chem. Eng., 2018, 6, 4194–4203 CrossRef CAS.
- A. Mohammad, M. E. Khan and M. H. Cho, J. Alloys Compd., 2020, 816, 152522 CrossRef CAS.
- D. Long, L. Wang, H. Cai, X. Rao and Y. Zhang, Catal. Lett., 2020, 150, 2487–2496 CrossRef CAS.
- M. Li, L. Zhang, M. Wu, Y. Du, X. Fan, M. Wang, L. Zhang, Q. Kong and J. Shi, Nano Energy, 2016, 19, 145–155 CrossRef CAS.
- M. Zarei, Sens. Int., 2020, 1, 100029 CrossRef.
- H.-Y. Xu, L.-C. Wu, H. Zhao, L.-G. Jin and S.-Y. Qi, PLoS One, 2015, 10, e0142616 CrossRef PubMed.
- M. A. Hanif, J. Akter, Y. S. Kim, H. G. Kim, J. R. Hahn and L. K. Kwac, Catalysts, 2022, 12, 151 CrossRef CAS.
- Q. Su, J. Sun, J. Wang, Z. Yang, W. Cheng and S. Zhang, Catal. Sci. Technol., 2014, 4, 1556–1562 RSC.
- K. Akaike, K. Aoyama, S. Dekubo, A. Onishi and K. Kanai, Chem. Mater., 2018, 30, 2341–2352 CrossRef CAS.
- T. S. Miller, A. B. Jorge, T. M. Suter, A. Sella, F. Corà and P. F. McMillan, Phys. Chem. Chem., 2017, 19, 15613–15638 RSC.
- Y. Li, W. Ho, K. Lv, B. Zhu and S. C. Lee, Appl. Surf. Sci., 2018, 430, 380–389 CrossRef CAS.
- L. Tan, J. Xu, X. Zhang, Z. Hang, Y. Jia and S. Wang, Appl. Surf. Sci., 2015, 356, 447–453 CrossRef CAS.
- M. H. Vu, C. C. Nguyen and T.-O. Do, ChemPhotoChem, 2021, 5, 466–475 CrossRef CAS.
- C. Fettkenhauer, X. Wang, K. Kailasam, M. Antonietti and D. Dontsova, J. Mater. Chem. A, 2015, 3, 21227–21232 RSC.
- D. A. Burns, A. Benavidez, J. L. Buckner and V. S. Thoi, Adv. Mater., 2021, 2, 2966–2970 RSC.
- C. Xu, Q. Han, Y. Zhao, L. Wang, Y. Li and L. Qu, J. Mater. Chem. A, 2015, 3, 1841–1846 RSC.
- S. Cao, B. Fan, Y. Feng, H. Chen, F. Jiang and X. Wang, Chem. Eng. J., 2018, 353, 147–156 CrossRef CAS.
- C. D. Wagner, W. M. Riggs, L. E. Davis, J. F. Moulder and G. E. Muilenberg, Handbook of X-ray Photoelectron Spectroscopy, ULVAC-PHI, Chigasaki Japan and Physical Electronics USA, Minnesota USA, 1995 Search PubMed.
- R. Nehru, P. K. Gopi and S.-M. Chen, New J. Chem., 2020, 44, 4590–4603 RSC.
Footnote |
| † Electronic supplementary information (ESI) available. See DOI: https://doi.org/10.1039/d2ra04752g |
| This journal is © The Royal Society of Chemistry 2022 |

