 Open Access Article
Fabrication of graphene-based sensor for exposure to different chemicals
Usama Afzal a,
Muhammad Zahid Aminb,
Bilal Arshadc,
Fatima Afzald,
Kanza Maryam
 *d,
Qayyum Zafar
 e,
Naveed Ahmadf,
Nazakat Alif and
Mashal Firdousf
aSchool of Microelectronics, Tianjin University, Tianjin, China. E-mail: mohammadusamafzal7@gmail.com
bCentre of Excellent Solid State, University of the Punjab, Lahore, Pakistan. E-mail: muhammadzahid7681@gmail.com
cCentre for High Energy Physics, University of the Punjab, Lahore, Pakistan. E-mail: bilalarshadbilalarshad87@gmail.com
dSchool of Chemistry, University of the Punjab, Lahore, Pakistan. E-mail: f.afzal.edu@gmail.com; k.maryam.edu@gmail.com
eDepartment of Physics, University of Management and Technology, Lahore 54000, Pakistan. E-mail: qayyumzafar@gmail.com
fDepartment of Physics, University of Education Township, Lahore, Pakistan. E-mail: dr.naveedahmadsammar@ue.edu.pk; nazakatuoe46@gmail.com; firdousmashal@gmail.com
First published on 24th November 2022
Abstract
Opto-chemical sensors are the most significant type of sensors that are widely used to detect a variety of volatile organic compounds and chemicals. This research work demonstrates the fabrication and characterization of an opto-chemical sensor based on a graphene thin film. A 300 nm graphene thin film was deposited on clean glass with the help of RF magnetron sputtering. The structure, surface and quality of the graphene thin film were characterized using XRD, SEM and Raman spectroscopy. For optical characterization, the thin film was exposed to IPA, acetone and toluene (separately) for five, ten and fifteen minutes. The optical transmission was then observed via UV-NIR spectroscopy in the near-infrared range (900 to 1450 nm). The thin film of graphene has expressed a sharp response time and recovery time with high sensitivity for each chemical. However, by comparing the output of the graphene thin film in response to each chemical, it was observed that graphene thin film has a better transmission and sensing rate for exposure to toluene.
1. Introduction
The control and detection of gases as well as chemicals is a very important factor in pharmaceuticals manufacturing, meteorology and the electronics industry.1 Thus, a number of sensors are used for this purpose, such as opto-chemical sensors.2 Numerous materials have been used in the fabrication of opto-chemical sensors. Graphene is one of the best candidates3 for use in the fabrication of sensors such as temperature sensors4 and opto-chemical sensors due to its remarkable structural and electronic properties.5 Different varieties of opto-chemical sensors have been proposed by researchers. Palanisamy Kalimuthu et al. developed an opto-chemical sensor for the detection of hydrochloric gas (HCl) by using the coating method, which was based on a porphyrin thin film.6 Monro, T. M. et al. used a mixture of sulfur dioxide (SO2) and wine in the fabrication of an opto-chemical sensor.7 Kim et al. made transparent and modifiable sensors based on a graphene material by using the chemical vapor deposition (CVD) technique.8 For the fabrication of polymer-fiber-based sensors, Yan Jin et al. predicted two techniques. One was the drawing process and the other was the extrusion technique.9 Helwig, A. et al.10 proposed health monitoring based on opto-chemical sensor technologies and multi-channel non-dispersive (NDIR) systems for monitoring aviation hydraulic fluids. Mamun, M. A. A. and Yuce, M. R.11 worked on a wearable chemical sensor based on nano-materials. They proposed wearable chemical environmental sensors working on the chemical transduction principle and summarized their electrical, photo-chemical and electrochemical behavior. Similarly, Kim, Y. et al.12 proposed a flexible chemical sensor based on a 2D material, i.e., graphene. They obtained micro-patterns of graphene on a polymer substrate with the help of wafer-scale direct transformation. The proposed sensor demonstrated a quick response time. Alshoaibi, A. and Islam, S.13 proposed a thermally stable opto-chemical sensor. The sensor was based on a ZnO-doped SiO2–TiO2 nano-composite material. The sensor demonstrated a sharp response time. Moreover, numerous researchers have worked on opto-chemical sensors and have found good results, as can be seen in ref. 14–16.In this research, we worked on a graphene thin film and tried to use it in the fabrication of an opto-chemical sensor. The graphene thin film was deposited on a clean glass substrate with the help of the RF magnetron sputtering technique and exposed to acetone, IPA and toluene, separately; we selected the exposure chemicals based on their structural properties and their availability. The transmission of the samples was observed through UV-NIR spectroscopy, because we wanted to study how much light could be transmitted through the graphene thin film when it was exposed to said chemicals. The thin film was also characterized using various techniques. The main purpose of this study is to determine for which chemical exposures the graphene thin film shows a fast transmission rate and sensitivity.
2. Experimental
2.1. Cleaning the glass substrate
First, the glass substrate cleaning process was performed with the help of acetone, an ultrasonic bath and isopropyl alcohol. For cleaning purposes, the substrate was dipped into a beaker filled with acetone and the beaker was placed into the ultrasonic bath for 15 to 20 minutes. Subsequently, isopropyl alcohol was used and the beaker was again placed into the ultra-sonic bath for the same amount of time. When the sample was clean, a nitrogen gun was used to dry it.2.2. Deposition of graphene thin film
A graphene thin film was deposited on a glass substrate of 25 × 75 mm with 99.9% pure graphene power. All chemicals and materials (graphene) in their pure forms were brought from Lahore, Pakistan. The deposition of graphene on the substrate was performed using an RF magnetron sputtering technique. The clean glass slide was loaded on the substrate holder, and a target of graphene of about 1.5 g (also cleaned with acetone and dried with nitrogen) was loaded in the working chamber of the RF magnetron sputtering apparatus (the distance between the substrate and target was about 7 cm). A vacuum of approximately 10−3 Pa was created inside the chamber with rotary and turbo-molecular pumps. After this, about 50 sccm of argon as the sputtering gas was injected into the chamber and a 13.56 MHz radio frequency was generated at a power of 150 W to ionize the sputtering gas. After 5 to 10 minutes, the deposition of the thin film (for a thickness of 300 nm) was started on the glass substrate with a sputtering angle of about 80°. In this way, we prepared a graphene thin film with a thickness of 300 nm on a glass substrate with dimensions of 25 × 75 mm. The whole experiment was performed at room temperature, i.e., 20 °C.2.3. Characterization of graphene thin film
The structure of the graphene thin film was characterized through the X-ray diffraction (XRD) technique with Cu Kα radiation (λ = 1.5406 °A) as the X-ray source, the surface morphology through SEM, the thin-film optical absorption through UV-vis spectroscopy, and the quality of the graphene thin film through Raman spectroscopy with a 488 nm laser excitation wavelength.17 Similarly, the optical transmission was studied using UV-NIR spectroscopy in the near-infrared region (approximate range of 900 to 1450 nm) with a halogen light source (AVANTES enlightening spectroscopy model: Avaspec-ULS2048L-RS-USB2), UA-300 Lines/mm grating, a bandwidth range from 200 nm to 1100 nm and a fiber optic spectrometer detector attached to a computer on which the spectral graphs were recorded.2.4. Exposure methodology
First of all, we carefully cut the fabricated sample with dimensions of 25 × 75 mm into three 25 × 25 mm samples with the help of a diamond scribe tool. We then placed 100 ml of three chemicals, i.e., IPA (isopropyl alcohol), acetone (CH3COCH3, C3H6O; 99% pure with Mw = 58 g mol−1), and toluene (C7H8) in three clean glass cups, separately. After that, the three samples made by cutting the full slide of graphene were placed in the three cups in such a way that each cup contained only one sample for different lengths of time, i.e., five, ten and fifteen minutes. The transmission of samples was then analyzed with the help of UV-NIR. We repeated the whole experiment several times, but found only 1.5 to 2% variation, which can be neglected.3. Results and discussion
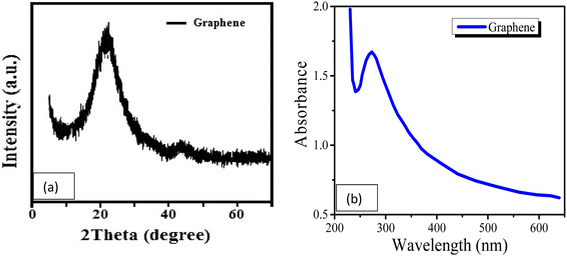
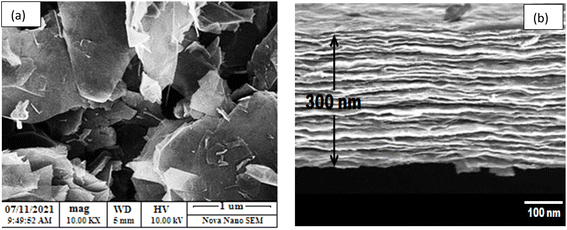
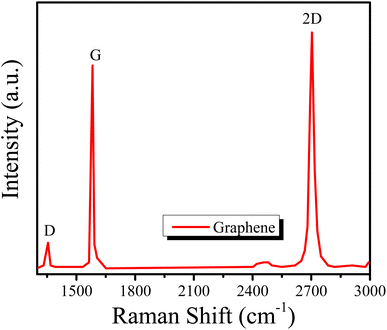
The structure of the graphene thin film was studied using the XRD technique,18 and the XRD pattern can be seen in Fig. 1(a). The pattern was observed in the range 5° < 2θ < 70°. The pattern is in agreement with the standard values in JCPDS ICDD card no. 75-2078. There is a sharp peak, i.e., (002), at about 25°, which demonstrates the d002 spacing increase based on Bragg's law and also provides information about the size of the lattices.Similarly, Fig. 1(b) presents the UV-vis spectrum of the graphene thin film. The peak of the spectrum is found at a wavelength of 280 nm, which indicates that graphene thin film is a good absorber of UV-C. The absorption efficiency indicates that it can also be used in light sensing, LEDs or solar cell applications. The surface of the graphene thin film was characterized by SEM at a scale of 1 μm with a magnification of 10k× , as shown in Fig. 2(a). The figure shows the roughness of the graphene thin film, as many voids are observed on its surface. These voids are very helpful in the absorption when the graphene thin film is placed in chemicals. Fig. 2(b) shows the thickness of the graphene thin film, which is about 300 nm, which is observed through cross-sectional SEM. Similarly, Fig. 3 presents the Raman spectrum of the graphene thin film. We observed the three peaks D, G and 2D at wavenumbers of about 1356, 1609 and 2735 cm−1, respectively. ‘D’ is the defect peak, which highlights the defects as well as the disorder between layers of graphene. ‘G’ is the characteristic peak of the sp2 carbon structure, which highlights the symmetry as well as the crystallization of the graphene structure. Similarly, ‘2D’ is a double-phonon-resonance peak, which expresses the graphene stacking degree, i.e., identifying the presence of graphene.19,20
To measure the optical transmission of the graphene thin film, we have used UV-NIR spectroscopy. Generally, UV-NIR spectroscopy is used to measure the UV absorption of a thin film.21–23 This absorption may be either the reflection or the transmission mode;24 in the following research work, we have only studied the transmission. To measure the transmission T of a sample, two types of reference spectra are necessary; one is a ‘blank’ spectrum (I0) and the other is a ‘black’ spectrum (IB). The result of the transmission is given by T = (I – IB)/(I0 – IB); here ‘I’ is the obtained spectrum. The transmission of the sample depends on the lamp spectrum emission, detector efficiency and grating absorption.25 In this work, an A-alight D(H)-S light source was used because it has a combined deuterium and halogen light source and is capable of emitting light in the UV/VIS/NIR range. Through the transmission of the graphene thin film, the response and recovery times and the sensitivity have been investigated. The graphene thin film was exposed to IPA, acetone and toluene, and three graphs were prepared, i.e., for five, ten and fifteen minutes, for each chemical.
First, we studied the transmission of light for the graphene thin films exposed to IPA. The graphs in Fig. 4(a–c) present the transmission for five minutes, ten minutes and fifteen minutes of exposure of the graphene thin film to IPA. It can be seen from the graphs that no change is observed in the response time of the sample, i.e., the response times for all exposure times is the same, 3 s. However, the recovery time is different for each exposure time, i.e., for five minutes of exposure the recovery time is 28 minutes, for ten minutes of exposure the recovery time is 33 minutes and for fifteen minutes of exposure the recovery time is 45 minutes.
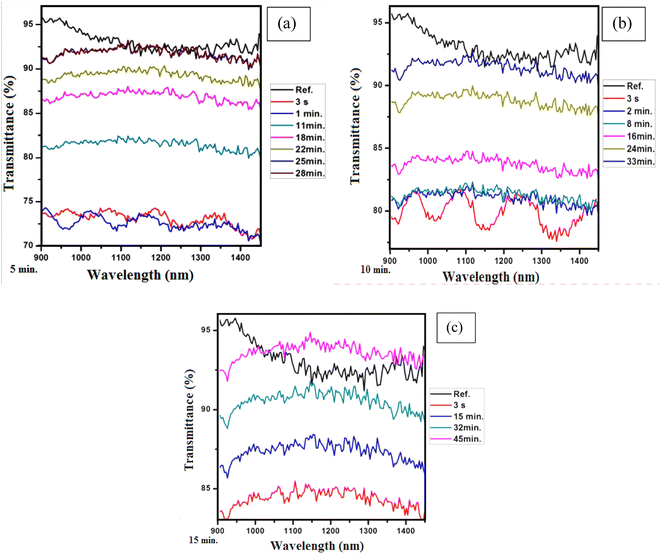 | ||
| Fig. 4 (a) Five minutes of exposure to IPA, (b) ten minutes of exposure to IPA and (c) fifteen minutes of exposure to IPA. | ||
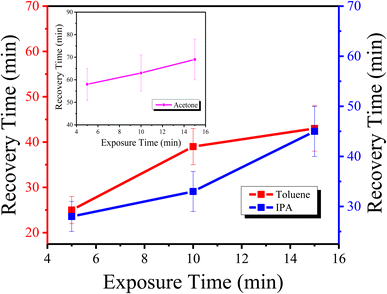
Similarly, the plots in Fig. 5(a–c) show the transmission of the graphene thin films exposed to acetone for five minutes, ten minutes and fifteen minutes, respectively. It is seen that the response time is 5 s for all exposure times, but the recovery time varies with changing exposure time, i.e., for five minutes of exposure, the recovery time is 58 minutes, for ten minutes of exposure, the recovery time is 63 minutes, and for fifteen minutes of exposure, the recovery time is 69 minutes. The plots in Fig. 6(a–c) present the transmission of the graphene thin films exposed to toluene for five, ten and fifteen minutes, respectively. The response time for each exposure is 5 s, but they show different recovery times, i.e., for five minutes of exposure the recovery time is 25 minutes, for ten minutes of exposure the recovery time is 39 minutes, and for fifteen minutes of exposure the recovery time is 43 minutes.
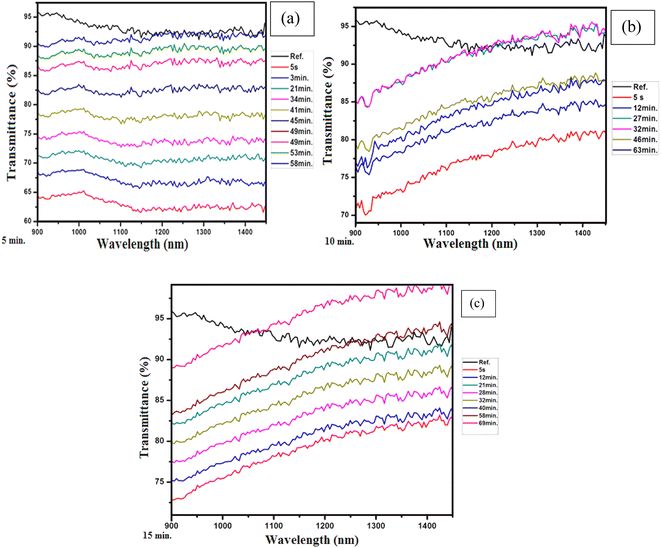 | ||
| Fig. 5 (a) Five minutes of exposure to acetone, (b) ten minutes of exposure to acetone and (c) fifteen minutes of exposure to acetone. | ||
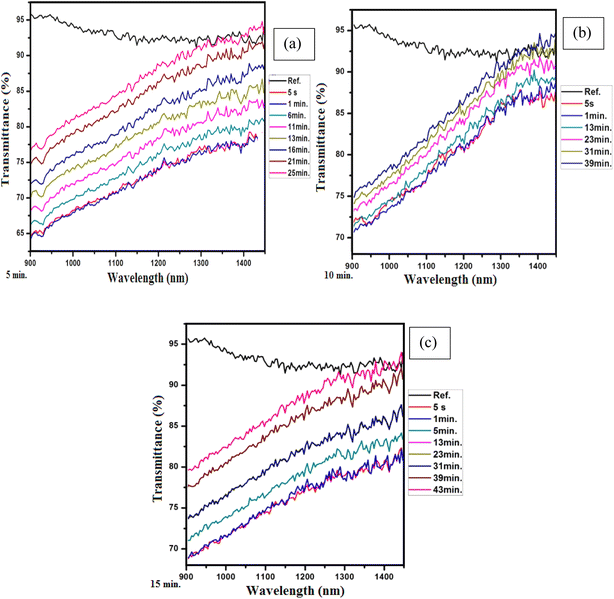 | ||
| Fig. 6 (a) Five minutes of exposure to toluene, (b) ten minutes of exposure to toluene and (c) fifteen minutes of exposure to toluene. | ||
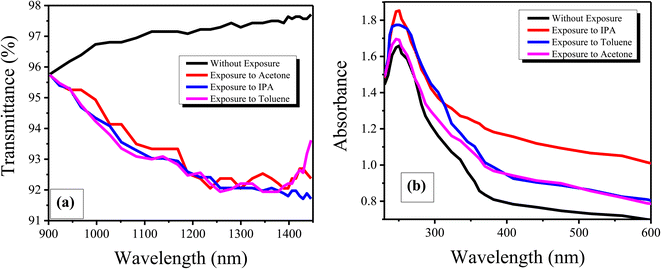
We now briefly discuss the transmission plots for IPA, acetone and toluene. We studied the transmission of all the samples in the near-infrared region at wavelengths of 900 to 1450 nm. From the reference lines of the graphs, it is observed that the transmission spectrum of the samples decreased as the exposure time was increased. Initially, high transmission of light was observed for all the samples because they were exposed to the chemicals for a short amount of time, i.e., five minutes, and a low quantity of the chemicals was absorbed by the thin films. Thus, the maximum light was transmitted due to less reflection. Initially, the graphene films have a low thickness, so the transparency of the thin films is not much affected by the chemical atoms/molecules. Hence, initially, the refractive index of the graphene thin films is also high. That is why the transmission of light for ten and fifteen minutes of exposure is lower. Moreover, it was found that the change in the exposure time did not affect the response times of the samples of the graphene thin film, i.e., the response time was the same for all samples, but the recovery time was affected by changing the exposure time, i.e., the recovery time continually increases with increasing exposure time. The response time is the specific time at which the first transmitted light is detected on the detector. However, all chemicals are different in nature. Thus, each chemical required a different amount of time to evaporate from the surface of the graphene thin film. That is why the recovery times for the graphene thin film are different. We then compared the absorption and transmission of light between the graphene thin films without and with exposure to chemicals, as shown in Fig. 7(a and b).
The plots in Fig. 7(a and b) show comparisons of the transmittance and absorbance. The transmission was measured through UV-NIR spectroscopy in the wavelength range of 900 to 1450 nm and the absorbance was measured through UV-vis spectroscopy in the wavelength range of 230 to 600 nm. It is seen that the transmittance of light decreased due to increased absorption of chemicals. Similarly, the absorbance of light first increased, then decreased gradually. However, comparing the results for the graphene thin film without exposure to chemicals, it can be seen that the light transmission and absorption have an inverse relationship for the graphene thin film.26
Similarly, the recovery time for each sample with respect to its exposure time is shown in Fig. 8.
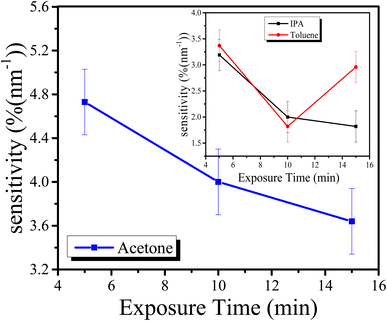
From the above plots in Fig. 8, it is seen that with an increase in the exposure time of each sample, the recovery time is also increased. As the sensitivity of the sensor is a very important factor, it was also measured for each exposure time. The sensitivity of the graphene thin films exposed to IPA, acetone and toluene is shown in Fig. 9. The sensitivity of the sensor was measured using the following formula:
 | (1) |
From Fig. 9, it can be seen that the opto-chemical sensor based on the graphene thin film exposed to acetone has the highest sensitivity. The sensitivity for five minutes of exposure is 4.73 (%(nm−1)). Similarly, for ten minutes of exposure, the sensitivity is 4.00 (%(nm−1)), and for fifteen minutes of exposure, the sensitivity is 3.64 (%(nm−1)). In short, the average sensitivity of the graphene thin film exposed to acetone is about 4.12 (%(nm−1)). Similarly, the IPA-exposure-based sensor has the lowest sensitivity. The sensitivity for five minutes of exposure is 3.19 (%(nm−1)). Similarly, for ten minutes of exposure, the sensitivity is 2.00 (%(nm−1)) and for fifteen minutes of exposure, the sensitivity is 1.82 (%(nm−1)). The average sensitivity of the graphene thin film exposed to IPA is about 2.34 (%(nm−1)). Moreover, the sensitivity of the opto-chemical sensor based on graphene thin film exposed to toluene falls between those of the acetone and IPA exposure sensors. The sensitivity for five minutes of exposure is 3.37 (%(nm−1)). Similarly, for ten minutes of exposure, the sensitivity is 1.82 (%(nm−1)) and for fifteen minutes of exposure, the sensitivity is 2.91%. The average sensitivity of the graphene thin film exposed to toluene is about 2.70 (%(nm−1)). Essentially, sensitivity relates to how well the quantity or concentration of the chemicals is detected and can be measured. The above sensitivities of the graphene thin films exposed to chemicals indicates that the graphene thin film absorbed specific amounts of the chemicals at different exposure times, i.e., five, ten and fifteen minutes.
From the sensitivity plots, it is found that the sensitivity for acetone and IPA is inverse to the exposure time, i.e., as exposure time increases, sensitivity decreases. However, in the case of toluene, the sensitivity first decreases, i.e., for five and ten minutes, but after some time, it starts to increase again, i.e., for fifteen minutes. This is due to the structure of the chemical toluene. Toluene has a similar structure to graphene, i.e., a honeycomb-like structure. This is why the absorption of toluene on the graphene thin film does not strongly affect the transmission of light. Moreover, the molar mass of toluene (92.14 g mol−1) is greater than that of other chemicals. Thus, the voids in the graphene thin film surface are filled earlier than others. Due to this, the transmission of light first decreased. However, when there are no voids for toluene absorption, the transmission starts to increase. This is a reason that the sensitivity of toluene first decreased and after some time started to increase.
A comparison of the opto-chemical sensors based on graphene thin films exposed to the chemicals acetone, IPA and toluene with respect to response time, recovery time and sensitivity is shown in Table 1. It can be seen that the response time of all sensors has negligible variation, i.e., only a two-second variation was observed, which can be neglected. However, in terms of recovery time and sensitivity, there are large differences. This is due to the volatility of the chosen solvents. Because all the chemicals have different volatility rates, great differences in recovery time were observed. The graphene thin film sensor exposed to toluene showed a low recovery time and more flexibility in sensitivity. Based on the comparison, we recommend the graphene thin film exposed to toluene for the fabrication of the opto-chemical sensor. Similarly, a comparison of the sensitivity (based on the transmission with respect to wavelength) of this work with previously published work can be seen in Table 2.
| Exposure chemical | Response time (s) | Recovery time (min) | Sensitivity (%) | ||||
|---|---|---|---|---|---|---|---|
| Five min | Ten min | Fifteen min | Five min | Ten min | Fifteen min | ||
| Acetone | 5 | 58 | 63 | 69 | 4.73 | 4.00 | 3.64 |
| IPA | 3 | 28 | 33 | 45 | 3.19 | 2.00 | 1.82 |
| Toluene | 5 | 25 | 39 | 43 | 3.37 | 1.82 | 2.91 |
| Material | Sensitivity %(nm−1) |
|---|---|
| Phenol red dye on mesoporous silica matrix27 | 0.5 |
| Sol–gel based mesoporous SiO2–TiO2 hybrid nanoparticles (heated at 250 °C)28 | 1.2 |
| Crack-free high surface area silica–titania nanocomposite coating29 | 2.7 |
| Sol–gel based phenolphthalein encapsulated heterogeneous silica–titania30 | 2.1 |
| Graphene thin film exposed to toluene (present) | 3.37–1.82 |
| Graphene thin film exposed to IPA (present) | 3.19–1.82 |
| Graphene thin film exposed to acetone (present) | 4.73–3.64 |
4. Conclusions
The present work described the fabrication of an opto-chemical sensor based on graphene. A thin film of graphene was deposited on a clean glass substrate. The structure, surface, optical absorption and quality of the thin film were studied using different techniques including XRD, SEM, UV-vis and Raman spectroscopy. For the fabrication of the sensor, the thin film was carefully divided into three equal parts and exposed to different chemicals, i.e., IPA, acetone and toluene. The transmission and sensitivity of these samples for exposure times of five minutes, ten minutes and fifteen minutes were observed with the help of UV-NIR spectroscopy. Exposure to all the chemicals resulted in a good response time, but a faster recovery time was reported for toluene exposure. Similarly, toluene exposure also resulted in good sensitivity in the present study, which highlights that the graphene thin film exposed to toluene exhibited better performance than for other chemicals.Data Availability
The data is available in this paper.Conflicts of interest
There are no conflicts to declare.Acknowledgements
The authors are thankful to the editor and reviewers for their valuable suggestions to improve the quality and presentation of the paper. The authors are also thankful to Mr Usama Afzal, a PhD scholar at the School of Microelectronics, Tianjin University, China, for working with us on this publication.References
- P. V. Lambeck, Integrated opto-chemical sensors, Sens. Actuators, B, 1992, 8, 103–116 CrossRef CAS.
- S. Paul, et al., Opto-chemical sensor system for the detection of H2 and hydrocarbons based on InGaN/GaN nanowires, Sens. Actuators, B, 2012, 173, 120–126 CrossRef CAS.
- U. Afzal, M. Aslam and A. H. Al-Marshadi, Analyzing imprecise graphene foam resistance data, Mater. Res. Express, 2022, 9(4), 045007 CrossRef.
- U. Afzal, F. Afzal, K. Maryam and M. Aslam, Fabrication of flexible temperature sensors to explore indeterministic data analysis for robots as an application of Internet of Things, RSC Adv., 2022, 12, 17138–17145, 10.1039/D2RA03015B.
- P. Kim, L. Shi, A. Majumdar and P. L. McEuen, Thermal transport measurements of individual multiwalled nanotubes, Sens. Actuators, B, 2001, 87, 215502 CAS.
- P. Kalimuthu, A. Sivanesan and S. A. John, Fabrication of optochemical and electrochemical sensors using thin films of porphyrin and phthalocyanine derivatives, J. Chem. Sci., 2012, 124, 1315–1325 CrossRef CAS.
- T. M. Monro, et al., Sensing free sulfur dioxide in wine, Sensors, 2012, 12, 10759–10773 CrossRef CAS PubMed.
- D. Kim, G. Shin, Y. J. Kang, W. Kim and J. S. Ha, Fabrication of a stretchable solid-state micro-supercapacitor array, ACS Nano, 2013, 7, 7975–7982 CrossRef CAS PubMed.
- Y. Jin and A. Granville, Polymer fiber optic sensors-a mini review of their synthesis and applications, J. Biosens. Bioelectron., 2016, 7, 1–11 Search PubMed.
- A. Helwig, G. Müller and S. Paul, Health monitoring of aviation hydraulic fluids using opto-chemical sensor technologies, Chemosensors, 2020, 8, 131 CrossRef CAS.
- M. A. A. Mamun and M. R. Yuce, Recent progress in nanomaterial enabled chemical sensors for wearable environmental monitoring applications, Adv. Funct. Mater., 2020, 30, 2005703 CrossRef CAS.
- Y. Kim, et al., Tailored Graphene Micropatterns by Wafer-Scale Direct Transfer for Flexible Chemical Sensor Platform, Adv. Mater., 2021, 33, 2004827 CrossRef CAS PubMed.
- A. Alshoaibi and S. Islam, Thermally stable ZnO doped SiO2–TiO2 nanocomposite based Opto-chemical sensor, Mater. Chem. Phys., 2021, 267, 124687 CrossRef CAS.
- S. Sanjabi, J. K. Rad and A. R. Mahdavian, Spiropyran and spironaphthoxazine based opto-chemical probes for instant ion detection with high selectivity and sensitivity to trace amounts of cyanide, J. Photochem. Photobiol., A, 2022, 424, 113626 CrossRef CAS.
- S. T. Berdybaeva, E. Tel’minov, T. Solodova and E. Nikonova, Oscillation and Sensor Properties of Integrated Opto-Chemical Sensors in Different Solvents, Russ. Phys. J., 2022, 64, 2147–2150 CrossRef CAS.
- S. Islam, et al., Thermally stable mesoporous pH dyes encapsulated titania nanocomposites for opto-chemical sensing, Mater. Res. Bull., 2022, 146, 111605 CrossRef CAS.
- U. Afzal, M. Aslam, K. Maryam, A. H. AL-Marshadi and F. Afzal, Fabrication and Characterization of a Highly Sensitive and Flexible Tactile Sensor Based on Indium Zinc Oxide (IZO) with Imprecise Data Analysis, ACS Omega, 2022, 7(36), 32569–32576 CrossRef CAS PubMed.
- U. Afzal, et al., Fabrication of a graphene-based sensor to detect the humidity and the temperature of a metal body with imprecise data analysis, RSC Adv., 2022, 12, 21297–21308 RSC.
- A. C. Ferrari, et al., Raman spectrum of graphene and graphene layers, Sens. Actuators, B, 2006, 97, 187401 CAS.
- B. Qin, et al., Crystalline Molybdenum Carbide–Amorphous Molybdenum Oxide Heterostructures: in situ Surface Reconfiguration and Electronic States Modulation for Li–S Batteries, Energy Storage Mater., 2022, 132(9), 3572–3576 Search PubMed.
- M. El-Nahass, H. Zeyada, M. Aziz and M. Makhlouf, Optical absorption of tetraphenylporphyrin thin films in UV-vis-NIR region, Spectrochim. Acta, Part A, 2005, 61, 3026–3031 CrossRef CAS PubMed.
- W. Fountain, K. Dumstorf, A. E. Lowell, R. A. Lodder and R. J. Mumper, Near-infrared spectroscopy for the determination of testosterone in thin-film composites, J. Pharm. Biomed. Anal., 2003, 33, 181–189 CrossRef CAS PubMed.
- A. Ferlauto, et al., Analytical model for the optical functions of amorphous semiconductors from the near-infrared to ultraviolet: applications in thin film photovoltaics, J. Appl. Phys., 2002, 92, 2424–2436 CrossRef CAS.
- G. P. Martin, Boris. UV-VIS-NIR spectroscopy: what is it & what does it do?, Conservation, 1991, 1, 13–14 Search PubMed.
- M. Hunault, et al., Assessment of transition element speciation in glasses using a portable transmission ultraviolet–visible–near-infrared (UV-Vis-NIR) spectrometer, Appl. Spectrosc., 2016, 70, 778–784 CrossRef CAS PubMed.
- Y. Chen, J. Zhu, Y. Xie, N. Feng and Q. H. Liu, Smart inverse design of graphene-based photonic metamaterials by an adaptive artificial neural network, Nanoscale, 2019, 11, 9749–9755 RSC.
- S. Islam, et al., Surface functionality and optical properties impact of phenol red dye on mesoporous silica matrix for fiber optic pH sensing, Sens. Actuators, A, 2018, 276, 267–277 CrossRef CAS.
- S. Islam, N. Bidin, S. Riaz, S. Naseem and F. Marsin, Correlation between structural and optical properties of surfactant assisted sol–gel based mesoporous SiO2–TiO2 hybrid nanoparticles for pH sensing/optochemical sensor, Sens. Actuators, B, 2016, 225, 66–73 CrossRef CAS.
- S. Islam, et al., Crack-free high surface area silica-titania nanocomposite coating as opto-chemical sensor device, Sens. Actuators, A, 2018, 270, 153–161 CrossRef CAS.
- S. Islam, N. Bidin, S. Riaz and S. Naseem, Sol–gel based phenolphthalein encapsulated heterogeneous silica–titania optochemical pH nanosensor, J. Ind. Eng. Chem., 2016, 34, 258–268 CrossRef CAS.
| This journal is © The Royal Society of Chemistry 2022 |

