 Open Access Article
Facile preparation of mesoporous silica coated nitrogen doped carbon dots for sensitive detection of picric acid
Hongbo Wu*,
Liu Yang,
Wei Sun,
Ping Yang * and
Honglong Xing
School of Chemical Engineering, Anhui University of Science & Technology, Huainan 232001, China. E-mail: hbwu@aust.edu.cn; pyang8066@163.com
First published on 24th November 2022
Abstract
In this work, a nanocomposite suitable for long-term storage was constructed for efficient and highly selective detection of picric acid (PA). For this purpose, nitrogen-doped carbon dots (N-CDs) were synthesized by a simple hydrothermal reaction one-step method, and the synthesized nitrogen-doped carbon dots were loaded into amine-modified mesoporous silica nanoparticles (MSN-NH2) to form N-CDs@MSN-NH2 nanocomposites. The as-synthesized N-CDs@MSN-NH2 was detected by X-ray photoelectron spectroscopy (XPS) and the Fourier transform infrared (FT-IR) analysis methods. After being coated with MSNs, the as-synthesized N-CDs@MSN-NH2 exhibits excellent photo-stability in storage for 60 days at room temperature. Furthermore, PA can significantly quench the fluorescence signal of N-CDs@MSN-NH2 through the fluorescence resonance energy transfer (FRET) effect, while other metal ions and nitro compounds only cause little change. The a-synthesized composites were used to detect PA with a detection limit of 50 nM in an aqueous solution. These results indicate that the synthesized composites have promise for application in PA detection in aqueous solution.
1 Introduction
Picric acid (PA), before the advent of trinitrotoluene (TNT), was the most important military explosive1 and is still widely used in fireworks, medicine, dyes, pesticides, and other fields.2,3 With the rapid development of industry, the emissions of PA near military bases or factories has increased. Due to the high toxicity and difficult biodegradation,4 it will cause symptoms such as dizziness and vomiting after long-term exposure,5,6 and has the characteristics of carcinogenesis, malformation and mutagenesis, seriously endangering human health.7 Considering the harm of PA to the environment and the human body,8–10 it is necessary to find a method that can quickly, conveniently and stably detect PA in water.At present, the detection methods of PA mainly include surface-enhanced Raman spectroscopy,11,12 electrochemical technology,13,14 flow injection,15 gas mass spectrometry16,17 and high-performance liquid chromatography.16,18 However, these methods have the defects of high cost, difficulty in operation, lack of selectivity and repeatability.19 Detection methods based on fluorescence have been developed widely for the detection of PA because of their good repeatability, high sensitivity and fast response time.20 Many sensors-based fluorescence quenching has been reported in recent years, including fluorescent nanofibers,21 nanofilms,22 fluorescent-labeled polymers23 and metal–organic frameworks.24,25 However, the high cost of materials and complex preparation methods seriously limit their further applications. The fluorescence analysis method established by quantum dots as fluorescent materials were widely used because of the good detection effectivity for explosives. At the same time, most of these contain toxic elements such as Cd and Pb, which leak from quantum dots and may endanger human health and break the ecological environment, resulting in environmental and ecological safety issues. Carbon dots has been widely used in environmental detection because of their simple synthesis, low toxicity, excellent optical properties and easy surface modification.26 Wu et al.27 used water-soluble amine-capped carbon dots as a sensor for trace PA and selective detection. They found that PA− and carbon dots surface NH2+ can form an anion pair through electrostatic interaction, improving the selective response of the carbon dots to PA in an aqueous solution. Luo et al.28 synthesized N/P co-doped carbon spots with adenosine derivatives as precursors to achieve efficient quenching of PA. They think that the fluorescence quenching mechanism was the inner filtration effect and static quenching. However, considering the extremely high surface energy and the large contact surface,29 carbon dots tend to agglomerate and making the above-mentioned developed sensors often difficult to store for a long time. Thus, it is very meaningful to develop a sensor with rapid response and long-term stability.
Recently, mesoporous silica has been applied widely in the fields of drug transportation and biosensors with the merits of the high comparative area, special pore structure, nearly uniform pore size distribution, and adjustable size range and porosity.30,31 Liu's team32 modified the mesoporous silica nanoparticles with dopamine and studied its dual response to light and temperature. Lei et al.30 grafted carbon dots onto the mesoporous silica material to develop a promising oxygen sensing system.
Herein, nitrogen-doped carbon dots (N-CDs) were synthesized by the facile hydrothermal method. To improve the optical stability, the as-synthesized N-CDs were loaded into the MSN-NH2 nanosphere. The as-synthesized N-CDs@MSN-NH2 composites exhibit good fluorescence properties and can be stored for a long time with little fluorescence quenching. Furthermore, the NH2 group was modified onto the surface of the MSNs nanosphere for good selectivity to PA. Then the as-synthesized N-CDs@MSN-NH2 composites were used as a sensor for the detection of PA in an aqueous solution quickly and sensitively. The wide line ranges from 0.4 μM to 80 μM and low LOD of 50 nM for PA detection suggest the potential application of N-CDs@MSN-NH2 composites.
2 Experimental
2.1 Materials
Glucose, urea, ethanol, cetyltrimethylammonium bromide (CTAB), triethanolamine (TEA), sodium dihydrogen phosphate and disodium hydrogen phosphate were obtained from Guoyao Chemicals Co., Ltd. (Shanghai, China). Triethanolamine (TEA) and PA were provided by Xilong Chemical Industry Co., Ltd. 3-Aminopropyl triethoxysilane (APTES) was supplied by Aladdin Reagents Co., Ltd. (Shanghai, China). All the chemicals were used as analytical grade without further purification. Distilled water was used throughout the experiment.2.2 Characterizations
The morphology and size of N-CDS@MSN-NH2 were analyzed by transmission electron microscopy (FEI Talos F200X G2). The EDX elemental analysis and mapping were obtained by Scanning Electron Microscopy (TESCAN VEGA3). The infrared spectra of MSNs, MSN-NH2 and N-CDs@MSN-NH2 in the range of 400–4000 cm−1 were obtained by Nicolet is50 FT-IR spectrometer. Powder X-ray diffraction (XRD) patterns of products were collected on the Rigaku Smartlab 3 kW diffractometer in the 2θ range from 10° to 80°. Ultraviolet-visible spectroscopy of N-CDS solution and N-CDs@MSN-NH2 solution was recorded with a UV spectrophotometer (UV-2500 Shimadzu, Japan). A fluorescence spectrophotometer (F-4600, Hitachi) was used to record fluorescence spectra.2.3 Preparation of MSNs with different size
2 g of cetylammonium bromide (CTAB) and an amount of (0.04, 0.06, 0.08 and 0.12 g) triethanolamine (TEA) were dissolved in 20 mL water and mixed evenly by ultrasound. After heating and stirring at 95 °C for 6 h, then 3 mL of n-tetrasiliconethyl ester (TEOS) was slowly added to the mixture and the reaction continued for 3 h, the product was centrifuged and cleaned several times, and silica nanospheres with different size were obtained after vacuum drying at 60 °C. The 200 mg silica nanospheres were dispersed into a 100 mL ethanol solution, and the pH was adjusted to about 4 h with hydrochloric acid. The dispersion was heated and refluxed at 78 °C for 6 h, followed by centrifugal cleaning several times and vacuum drying at 60 °C to obtain MSNs.2.4 Synthesis of amine-modified MSNs (MSN-NH2)
The 150 mg MSNs prepared with 0.08 g TEA above was dispersed in 75 mL ethanol solution, heated to 78 °C and slowly added into 7.5 mL APTES solution. After 6 h of reflux, the precipitate was obtained by centrifugation and cleaned with ethanol and deionized water to remove the excess APTES. Finally, MSN-NH2 was obtained after vacuum drying at 60 °C.2.5 Preparation of N-CDs
In order to prepare N-CDs, 0.12 g glucose and 0.01 g urea were added to 25 mL deionized water, which was dispersed evenly and then transferred to the reaction kettle. The brown N-CDs solution was obtained at 180 °C for 6 h. After filtration and centrifugation, the N-CDs solution was freeze-dried to give an N-CDs concentration of 1.925 mg mL−1.2.6 Synthesis of N-CDs@MSN-NH2
Disperse 20 mg of the above-synthesized MSN-NH2 into 4 mL N-CDs solution and stir the adsorption at room temperature for 4 h. The product was centrifuged and washed with deionized water several times and then vacuum dried at 60 °C to obtain N-CDs@MSN-NH2.2.7 Detection of PA
To study the effect of the material on PA, 2 mg of the prepared N-CDs@MSN-NH2 was dispersed into a 2 mL PBS buffer solution, then 1 mL of PA with different concentrations was added to the above solution, and the fluorescence spectrum of the mixture was measured after mixing well. The actual samples were analyzed using lake water and tap water from Huainan, Anhui province. After filtration and centrifugation, different concentrations of PA were added to the water samples and tested in accordance with the above steps.3 Results and discussion
3.1 Structure and characterization of N-CDs@MSN-NH2
As shown in Scheme 1, nitrogen-doped carbon dots were synthesized by a simple hydrothermal method using urea as the nitrogen source and glucose as the carbon source. Then, MSN-NH2 with good dispersion, uniform particle size and large specific surface area was prepared by the sol–gel method. The amino group was further modified on the surface of MSNs by APTES. Finally, the prepared N-CDs were loaded into MSNs-NH2 to obtain N-CDs@MSN-NH2 composites.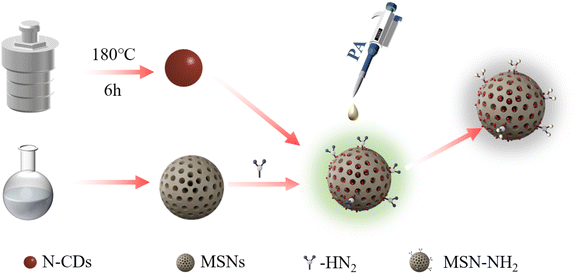 | ||
| Scheme 1 Schematic diagram of the preparation and fluorescence quenching process of N-CDs@MSN-NH2 to PA. | ||
The morphology of N-CDs@MSN-NH2 was studied using transmission electron microscopy (TEM), and as shown in Fig. 1. The porous spherical particles with monodispersity can be clearly seen, and mesoporous silicon with different sizes can be successfully prepared through a change in the amount of TEA (Fig. 1a–d). These TEM images can also clearly see that the prepared materials are uniform in size and the average size varies from 32 nm to 56 nm. Elemental mapping (Fig. 2a–e) and EDX analysis (Fig. 2f) strongly indicate the N-CDs are successfully loaded into the MSN-NH2 as element C appears in large quantities in the prepared composites.
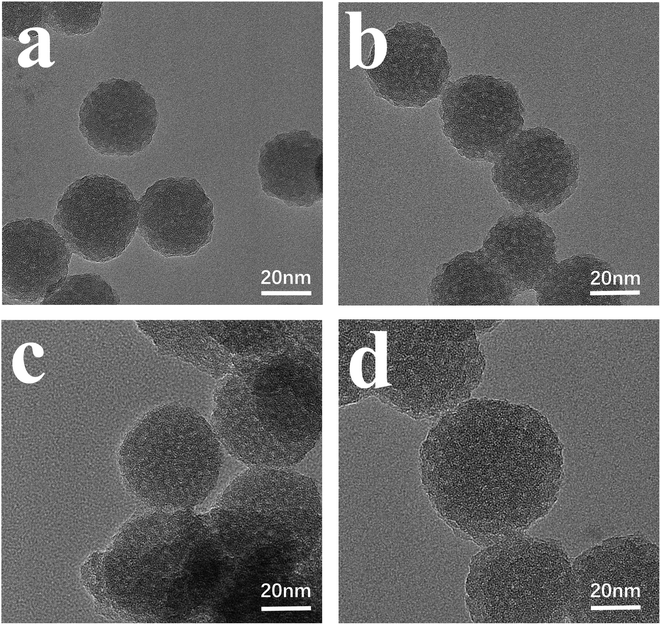 | ||
| Fig. 1 The TEM images of N-CDs@MSN-NH2 of different sizes synthesized with different TEA content (a) 0.04 g, (b) 0.06 g, (c) 0.08 g, (d) 0.12 g. | ||
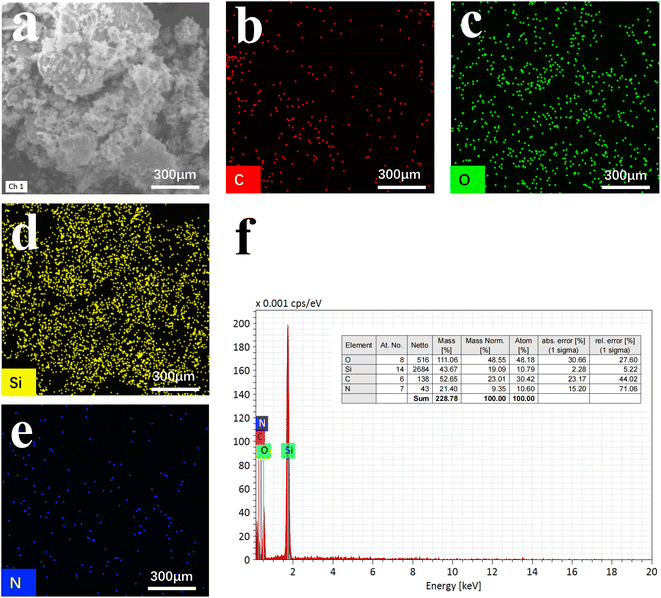 | ||
| Fig. 2 SEM image (a), the EDX mapping (b–e) and the elemental analysis (f) of N-CD@MSN-NH2 composites. | ||
Fig. 3a shows the X-ray diffraction (XRD) spectrum of the as-synthesized N-CDs@MSN-NH2 composites. As shown in the curve, N-CDs@MSN-NH2 has a peak at 2θ = 22°, and this is a typical peak of MSNs.33 It is worth mentioning that this also includes the distribution peaks of the CDs.26 Thus, the peak may be formed by the superposition of the two of them. Furthermore, the broad dispersion peaks indicate that the synthesized composite has a non-crystalline structure.
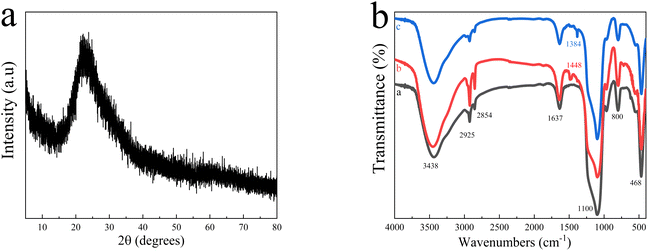 | ||
| Fig. 3 (a) XRD patterns of N-CDs@MSN-NH2, (b) the Fourier transform infrared (FTIR) spectra of MSNs (line (a)), MSN-NH2 (line (b)), N-CDs@MSN-NH2 (line (c)). | ||
The FT-IR spectra of MSNs, MSN-NH2 and N-CDs@MSN-NH2 are shown in Fig. 3b. As shown in curve a, a strong absorption peak appears at 3438 cm−1 is ascribed to the typical Si–OH suction vibration peak of mesoporous silica materials. The absorption peaks at 2925 cm−1 and 2854 cm−1 are related to the telescopic vibration of C–H in CTAB, and the absorption peaks at 1637 cm−1 and 962 cm−1 belong to the telescopic vibration and bending vibration peaks of Si–OH. The absorption peaks of 465 cm−1 and 800 cm−1 are assigned to the characteristic signals of Si–O symmetrical tensile vibrations, while the absorption peaks at 1110 cm−1 are caused by the asymmetrical tensile vibrations of Si–O–Si. In curve b, the new absorption peaks appearing at 1448 cm−1 are caused by NH2 groups in functional monomer APTES, indicating that NH2 groups are successfully modified onto the MSNs nanosphere.34 As shown in curve c, the characteristic absorption peak of the NH2 group in N-CDs@MSN-NH2 has little shifted, and the absorption peak strength of Si–OH has been significantly weakened, indicating that the N-CDs@MSN-NH2 composites were successfully formed.31
To study the chemical composition and electronic states of the as-synthesized N-CDs@MSN-NH2 composites, the XPS spectrum was measured. As shown in Fig. 4a, the XPS survey spectra clearly have four peaks at 532.26, 400.98, 285.10 and 103.02 eV, which were assigned to O 1s, N 1s, C 1s and Si 2p, respectively. The high-resolution fitted peaks spectrum of C 1s (Fig. 4b) displays three obvious peaks at 284.8, 286.4, and 288.4 eV, which correspond to the C–C, C–N and C–O binding states, respectively, indicating that nitrogen was successfully doped into the carbon dots. The N 1s spectrum (Fig. 4c) has three peaks at 401.5, 399.9 and 402.5 eV, which belong to the bands of N–H, C–N–C and NSiO2, respectively. The Si 2p spectra have a peak of 103.3 eV, which is attributed to the SiO2. All the result demonstrates that the carbon dots were successfully coated into the mesoporous silicon.
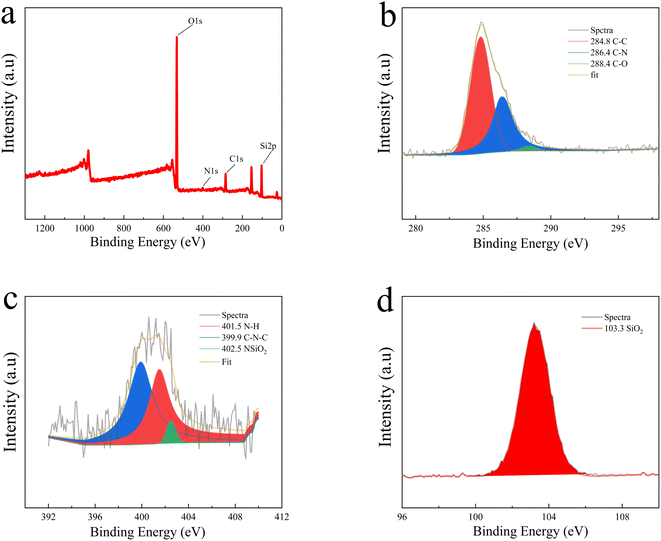 | ||
| Fig. 4 (a) Full scan XPS spectrum of N-CDs@MSN-NH2, (b) C 1s spectra, (c) N 1s spectra. (d) Si 2p spectra. | ||
3.2 Optical properties of N-CDs@MSN-NH2
The absorption spectrum of N-CDs, MSN-NH2, and N-CDs@MSN-NH2 was measured. As shown in Fig. 5a, there is no absorption peak of MSN-NH2 appears and N-CDs generate the absorption peak at 284 nm. After coating N-CDs into MSN-NH2, a noticeable peak at 284 nm could be observed under the same conditions, indicating the successful synthesis of N-CDs@MSN-NH2 composites. Fig. 5b shows the fluorescence spectrum of N-CDs and N-CDs@MSN-NH2, respectively. As shown in Fig. 4b, the N-CDs can emit green fluorescence at about 500 nm. However, the fluorescence peak has some red-shift from 500 nm to 452 nm after coating N-CDs into the MSN-NH2, which may be attributed to the increase of nitrogen-related energy levels in N-CDs.35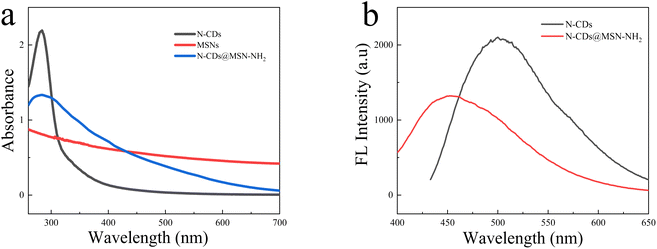 | ||
| Fig. 5 (a) Absorption spectrum of N-CDs, MSN-NH2 and N-CDs@MSN-NH2 (b) emission spectrum of N-CDs and N-CDs@MSN-NH2. | ||
The result also indicates that the N element was successfully modified into the carbon dots. Furthermore, the fluorescence intensity of the N-CDs@MSN-NH2 composites decreases greatly due to the shelter of the MSNs shell to the N-CDs. Furthermore, the emission wavelength of the composites has little shift.
3.3 Storage time test
In order to study the fluorescence stability of the as-synthesized N-CDs@MSN-NH2 composites, the fluorescence intensity of the composites after storage at room temperature for 30 d and 60 d were tested and compared with N-CDs solution, respectively. As shown in Fig. 6a, the fluorescence intensity of N-CDs decreased by about 35.7% after storage for 30 d, and about 53.6% decrease after 60 d storage. However, after 60 days of storage, the fluorescence intensity of N-CDs@MSN-NH2 (Fig. 6b) decreased by only 11.9% under the same conditions. Considering that the aggregation effect of N-CDs occurs at a higher concentration, resulting in fluorescence quenching. Because of their special pore structure, carbon dots are loaded in MSN-NH2, and they can effectively reduce the aggregation of N-CDs, thereby avoiding the fluorescence quenching caused by aggregation. Furthermore, the composites can be fast collected and cleaned with facile centrifugal treatment after coating N-CDs into the MSNs nanosphere.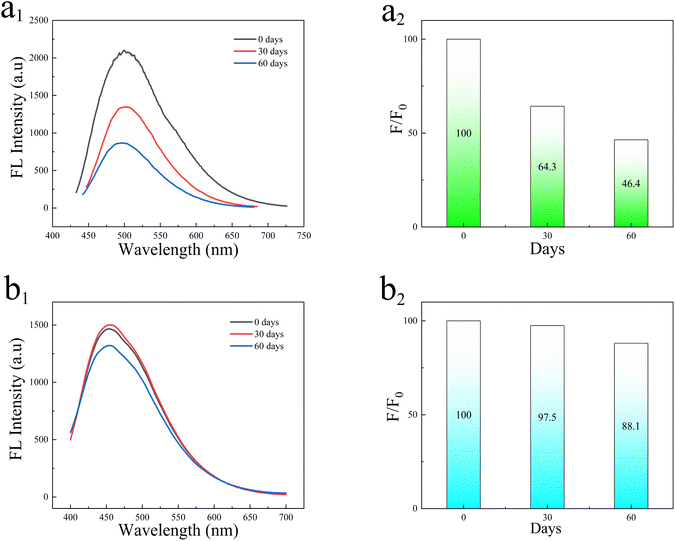 | ||
| Fig. 6 (a1) Fluorescence intensity of N-CDs, (a2) fluorescence attenuation of N-CDs. (b1) Fluorescence intensity of N-CDs@MSN-NH2, (b2) fluorescence attenuation N-CDs@MSN-NH2. | ||
3.4 Condition optimization
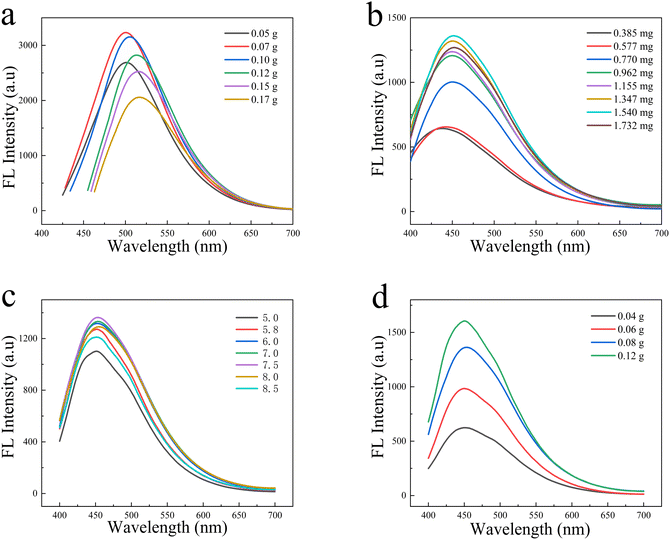
In order to obtain the optimal fluorescence intensity of the as-synthesized N-CDs, the effect of the ratio of urea and glucose in N-CDs on the fluorescence properties was studied. The mass of urea was fixed and the ratio of urea and glucose was changed by adjusting the mass of glucose. As shown in Fig. 7a, the spectrum has some red-shifted fluorescence intensity that gradually increased as the mass of glucose increased. This is mainly attributed to the introduction of more nitrogen-related energy levels under the higher urea ratios, which changes the band structure of CDs, resulting in a blue shift in emission. The maximum fluorescence intensity occurs when the mass of glucose reaches 0.12 g, which may be attributed to the increase of carbon source, making the increased concentration of N-CDs, but the fluorescence decreases to a certain extent as the glucose continues to increase, which may be caused to the aggregation of N-CDs due to the high concentration and result in the fluorescence quenching. Therefore, the mass of glucose and urea were chosen to be 0.12 and 0.01 g, respectively. Fig. 7b shows the effect of the amounts of N-CDs on the fluorescence intensity of N-CDs@MSN-NH2. The result shows that the fluorescence intensity of the composites increases with the amounts of N-CDs in the range from 0.385 mg to 1.540 mg. However, the fluorescence intensity decreased greatly when the number of N-CDs was over 1.540 mg. Thus, the amount of 1.540 mg N-CDs was chosen in the latter experiment. Fig. 7c shows the fluorescence effect of N-CDs@MSN-NH2 in different pH values in phosphate buffer saline (PBS) solution. It can be seen that the fluorescence intensity of the as-prepared composites increases with the increased pH value changed from 5 to 7.5. However, the fluorescence intensity decreases greatly once the pH value is over 8. Thus, the pH of 7.5 value PBS solution was finally selected in the detection of PA.Further, the effect of different size MSNs on the adsorption of N-CDs was studied. As shown in Fig. 7d, the fluorescence effect of N-CDs@MSN-NH2 is improved with the increased amount of TEA in the synthesis of MSNs, implying the size of MSNs has a great effect on the adsorbed N-CDs. The larger size of the MSNs can adsorb more N-CDs, resulting the better fluorescence intensity. However, we found that the large size of MSNs can bring serious aggregation due to its larger weight of itself, which is bad for detecting PA in an aqueous solution. Therefore, thinking of the good fluorescence intensity and dispersion in solution, the size of 41 nm MSNs prepared with 0.08 g TEA was selected in the latter experiment.
3.5 Detection and selectivity of PA
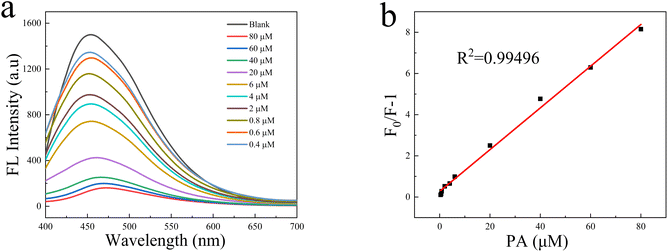
Due to the strong electron-withdrawing ability of the nitro group, PA has become a typical electron-deficient nitroaromatic compound. Therefore, when PA is in contact with an electron-rich fluorescence group, electron transfer will occur immediately, resulting in fluorescence quenching. The solution-based fluorescence quenching experiment was used to detect PA in water. Fig. 8a is the fluorescence spectrum of PA with different concentrations of N-CDs@MSN-NH2 composites under optimal experimental conditions. When excited at 370 nm, the N-CDs@MSN-NH2 solution showed a strong emission peak at 450 nm. When the different amount of PA was mixed with it, the fluorescence intensity decreased with the increased PA in the optimal conditions.As previously reported,27 the relationship between FL intensity and the quencher concentration in the range of 0.4 μM to 80 μM is established by the Stern–Volmer equation F/F0 = 1 + KSV[Q], where F0 and F are the fluorescence intensity of N-CDs@MSN-NH2 before and after the addition of PA, KSV is quenching constant, [Q] is the concentration of PA. The value of KSV, obtained from the slope of linear fit (Fig. 8b), was found to be 1.0133 × 10⁵ M−1, and the linear correlation coefficient (R2) is 0.99496. The high quenching constant indicates the composites have a high sensitivity to PA. The detection limit (LOD) is calculated by 3σ/k, where σ is the standard deviation of the blank sample and k is the slope of the SV plot. The LOD is found to be 50 nM.
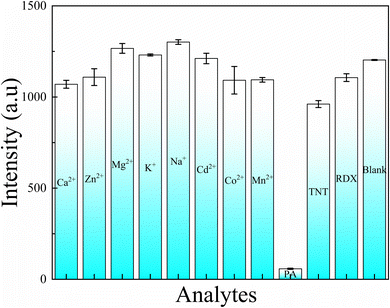
Furthermore, the selectivity of the as-synthesized N-CDs@MSN-NH2 composites was tested by mixing the different metal ions and other nitro explosives (1 mL, 1 × 10⁻² M) with the 2 mL N-CDs@MSN-NH2 composites in the optimal conditions, respectively. Fig. 9 shows that except for PA with the amount of (1 mL, 1 × 10⁻³ M), some analytes with an amount of 10 fold of PA exhibit a little effect on the fluorescence intensity of N-CDs@MSN-NH2 composites, which demonstrates the excellent selectivity of the composites to PA.
3.6 Real sample testing
To evaluate the potential application of the as-synthesized composites in actual sample detection, the tap water and lake water in Huainan, Anhui Province, were collected as samples with filtered and centrifuged treatment. The recovery rate of PA determined by this method was 99.93–109.88%, and the relative standard deviation was 1.4–3.0%. The results show that this method has high accuracy and can be used for the detection of PA in actual samples (Table 1).| Sample | Add/(μmol L) | Found/(μmol L) | Recovery/(%) | RSD/(%) |
|---|---|---|---|---|
| Tap water | 0 | — | — | — |
| 20 | 21.01 | 105.05 | 2.8 | |
| 30 | 29.98 | 99.93 | 2.6 | |
| 40 | 40.36 | 102.70 | 1.4 | |
| River | 0 | — | — | — |
| 20 | 21.97 | 109.88 | 3.0 | |
| 30 | 30.23 | 100.76 | 2.6 | |
| 40 | 40.53 | 101.13 | 1.7 |
3.7 Possible mechanism
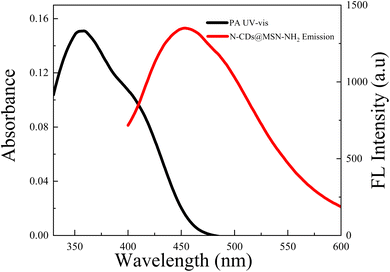
To investigate the possible quenching mechanism of PA on the fluorescence of N-CDs@MSN-NH2 composites, the UV absorption spectrum of PA and the emission spectrum of N-CDs@MSN-NH2 were tested. As shown in Fig. 10, there is a large effective overlap between the emission band of the N-CDs@MSN-NH2 and the absorption peaks of PA. It is believed that the main reason for the fluorescence quenching is the FRET effect. When N-CDs@MSN-NH2 are excited, they will generate fluorescence, but in the presence of PA, the fluorescence energy resonance energy will be transferred to PA. After PA absorbs energy, N-CDs@MSN-NH2 will generate fluorescence quenching. In addition, compared with the emission spectrum of N-CDs, the blue shift of the emission spectrum makes the overlap between the emission band of N-CDs@MSN-NH2 and the absorption band of PA more obviously, so the prepared composites are beneficial to enhancing the FRET effect.4 Conclusion
In conclusion, N-CDs were synthesized by a facile hydrothermal method using urea and glucose as precursors. Furthermore, the N-CDs were loaded into MSN-NH2 nanoparticles, forming well-dispersed, regular mesopores, uniform size and average size. When the N-CDs@MSN-NH2 nanoparticles with a particle size of about 41 nm, the as-synthesized composites have good fluorescence stability, which has only an 11.9% quenching ratio after 60 days of storage. In addition, the composite exhibits high sensitivity and excellent selectivity to PA detection. The good liner range of PA from 0.4 μM to 80 μM and low LOD of 50 nM can be obtained with the as-synthesized composites. It is believed that the quenching is mainly caused by the FRET mechanism between PA and N-CDs@MSN-NH2 nanosphere. Moreover, the PA in tap water and lake water were measured with a satisfying result, which demonstrates the potential application of the as-synthesized N-CDs@MSN-NH2 in real sample detection.Conflicts of interest
There are no conflicts to declare.Acknowledgements
This work was supported by the Anhui Province Natural Science Foundation Project (No. KJ2020A0280), the Key Research and Development Projects of Anhui Province (202104d07020013); the Launching Scientific Research funds for doctors of Anhui University of Science and Technology (No. 11109) and University Synergy Innovation Program of Anhui Province (GXXT-2019-028).References
- D. S. Moore, Rev. Sci. Instrum., 2004, 75, 2499–2512 CrossRef CAS.
- J. Li, L. Zhang, P. Li, Y. Zhang and C. Dong, Sens. Actuators, B, 2018, 258, 580–588 CrossRef CAS.
- D. G. Babar and S. S. Garje, ACS Omega, 2020, 5, 2710–2717 CrossRef CAS PubMed.
- K. Wollin and H. H. Dieter, Arch. Environ. Contam. Toxicol., 2005, 49, 18–26 CrossRef CAS PubMed.
- M. Wang, M. Gao, L. Deng, X. Kang, K. Zhang, Q. Fu, Z. Xia and D. Gao, Microchem. J., 2020, 154, 104590 CrossRef CAS.
- Priya, A. K. Sharma, B. S. Kaith, Vipula, K. Chandel, A. Singh and Isha, Int. J. Biol. Macromol., 2020, 147, 582–594 CrossRef CAS PubMed.
- G. Sabbioni, Y. Y. Liu, H. Yan and O. Sepai, Carcinogenesis, 2005, 26, 1272–1279 CrossRef CAS PubMed.
- M. E. Germain and M. J. Knapp, Chem. Soc. Rev., 2009, 38, 2543–2555 RSC.
- H. S. Toh, A. Ambrosi and M. Pumera, Catal. Sci. Technol., 2013, 3, 123–127 RSC.
- B. K. Ong, H. L. Poh, C. K. Chua and M. Pumera, Electroanalysis, 2012, 24, 2085–2093 CrossRef CAS.
- A. Hakonen, F. Wang, P. O. Andersson, H. Wingfors, T. Rindzevicius, M. S. Schmidt, V. R. Soma, S. Xu, Y. Li, A. Boisen and H. Wu, ACS Sens, 2017, 2, 198–202 CrossRef CAS PubMed.
- M. Liu and W. Chen, Biosens. Bioelectron., 2013, 46, 68–73 CrossRef CAS PubMed.
- H. X. Zhang, A. M. Cao, J. S. Hu, L. J. Wan and S. T. Lee, Anal. Chem., 2006, 78, 1967–1971 CrossRef CAS PubMed.
- L. Agui, D. Vega-Montenegro, P. Yanez-Sedeno and J. M. Pingarron, Anal. Bioanal. Chem., 2005, 382, 381–387 CrossRef PubMed.
- M. Miró, A. Cladera, J. M. Estela and V. c. Cerdà, Anal. Chim. Acta, 2001, 438, 103–116 CrossRef.
- M. Walsh, Talanta, 2001, 54, 427–438 CrossRef CAS PubMed.
- C. Mullen, A. Irwin, B. V. Pond, D. L. Huestis, M. J. Coggiola and H. Oser, Anal. Chem., 2006, 78, 3807–3814 CrossRef CAS PubMed.
- K. Bratin, P. T. Kissinger, R. C. Briner and C. S. Bruntlett, Anal. Chim. Acta, 1981, 130, 295–311 CrossRef CAS.
- H. Sohn, M. J. Sailor, D. Magde and W. C. Trogler, J. Am. Chem. Soc., 2003, 125, 3821–3830 CrossRef CAS PubMed.
- V. Bhalla, S. Kaur, V. Vij and M. Kumar, Inorg. Chem., 2013, 52, 4860–4865 CrossRef CAS PubMed.
- A. Santos, G. O. Deokaran, C. V. Costa, L. Gama, E. G. Mazzini Junior, A. M. L. de Assis, J. D. de Freitas, W. R. de Araujo, R. P. Dias, J. C. S. da Silva, L. M. M. Costa and A. S. Ribeiro, Forensic Sci. Int., 2021, 329, 111056 CrossRef CAS PubMed.
- A. B. Schvval, P. G. Del Rosso, M. F. Almassio and R. O. Garay, Opt. Mater., 2021, 112, 110737 CrossRef CAS.
- C. M. Darr, V. Korampally, B. Chen, K. Gangopadhyay and S. Gangopadhyay, Sens. Actuators, B, 2014, 202, 1088–1096 CrossRef CAS.
- Z. Sun, Y. Bao, C. Wang, Z. Lin, A. Shi and H. Li, Inorg. Chim. Acta, 2019, 494, 266–270 CrossRef CAS.
- Y. Zhang, Z. Gao, W. Liu, G. Liu, M. Zhu, S. Wu, W. Yao and E. Gao, Inorg. Chem. Commun., 2021, 134, 109017 CrossRef CAS.
- H. Li, Z. Kang, Y. Liu and S.-T. Lee, J. Mater. Chem., 2012, 22, 24175–24478 RSC.
- Q. Niu, K. Gao, Z. Lin and W. Wu, Anal. Methods, 2013, 5, 6228 RSC.
- N. Li, S. G. Liu, Y. Z. Fan, Y. J. Ju, N. Xiao, H. Q. Luo and N. B. Li, Anal. Chim. Acta, 2018, 1013, 63–70 CrossRef CAS PubMed.
- J. Liu, R. Li and B. Yang, ACS Cent. Sci., 2020, 6, 2179–2195 CrossRef CAS PubMed.
- L. Wang, H. Zhang, X. Zhou, Y. Liu and B. Lei, J. Colloid Interface Sci., 2016, 478, 256–262 CrossRef CAS PubMed.
- S. S. Zhang, X. Xu, Q. Y. Yue, W. G. Wang and B. Y. Gao, Desalin. Water Treat., 2019, 169, 294–304 CrossRef CAS.
- W.-s. Xu, Z.-x.-s. Yang, G.-y. Zhang and H. Liu, J. Cent. South Univ., 2022, 29, 397–409 CrossRef CAS.
- J. Chen, Y. Wei, X. Yang, S. Ni, F. Hong and S. Ni, Colloids Surf., B, 2020, 190, 110910 CrossRef CAS PubMed.
- B. K. Sodipo and A. A. Aziz, Ultrason. Sonochem., 2018, 40, 837–840 CrossRef CAS PubMed.
- H. Ding, S. B. Yu, J. S. Wei and H. M. Xiong, ACS Nano, 2016, 10, 484–491 CrossRef CAS PubMed.
| This journal is © The Royal Society of Chemistry 2022 |

