 Open Access Article
Cathode diffusion layer and current collector with slotted foam stainless steel for a micro direct methanol fuel cell
Zhengang Zhao ab,
Ziten Wanga,
Kang Li
 a and
Dacheng Zhang*ac
aFaculty of Information Engineering and Automation, Kunming University of Science and Technology, Kunming 650500, China. E-mail: dacheng.zhang@kust.edu.cn
bYunnan Key Laboratory of Green Energy, Electric Power Measurement Digitalization, Control and Protection, Kunming 650500, China
cYunnan Key Laboratory of Computer Technology, Kunming 650500, China
First published on 10th October 2022
Abstract
In order to reduce the contact and mass transfer impedance of the diffusion layer and current collector of a Micro Direct Methanol Fuel Cell (μDMFC), a novel Membrane Electrode Assembly (MEA) structure is designed by using Foam Stainless Steel (FSS) with a slotting rate of 38.47% for both the cathode diffusion layer and the current collector. Electrochemical tests are performed on the Foam Stainless Steel Membrane Electrode Assembly (FSS-MEA) and the Conventional Carbon Paper Membrane Electrode Assembly (CCP-MEA) μDMFCs. The experimental results show that the maximum power density of FSS-MEA μDMFC is 46.55 mW cm−2 at 343 K, which is 42.88% higher than that of CCP-MEA μDMFC, and the optimum working concentration of FSS-MEA μDMFC is 2.5 mol L−1, which is 1 mol L−1 higher than that of CCP-MEA μDMFC. Electrochemical Impedance Spectroscopy (EIS) test results show that the contact impedance of FSS-MEA μDMFC is 0.55 Ω cm−2, which is 15.38% lower than that of CCP-MEA μDMFC. The mass transfer impedance of FSS-MEA μDMFC is 0.99 Ω cm−2, which is 25.56% lower than that of CCP-MEA μDMFC. This implies that the novel slotted FSS-MEA structure alleviates the methanol crossover and reduces the contact and mass transfer impedance, thus improving μDMFC power density.
1 Introduction
A Micro Direct Methanol Fuel Cell (μDMFC), as a novel clean energy source, has compelling prospects for application in portable electronics energy due to its high energy density, easy storage and abundant sources of fuel, easy start-up, and eco-friendly.1–5 A conventional μDMFC mainly consists of the current collector, diffusion layer, microporous layer, catalytic layer, and proton exchange membrane, among which the diffusion layer and current collector play essential roles in the electron and mass transport of the cell.6–9 When using a conventional perforated stainless steel current collector to provide encapsulation pressure, there is a large contact impedance and uneven pressure distribution between the diffusion layer and the current collector, as well as a large mass transfer dead zone, which leads to μDMFC performance degradation.10–12 Therefore, optimizing the material and structure of the diffusion layer and current collector could help reduce the contact and mass transfer impedance.13–16 Zhu et al.17 used Three-Dimensional Graphene (3DG) as a gas diffusion layer for DMFC, and the experimental results showed that the structure of 3DG can provide lower contact impedance and sufficient fuel diffusion paths, which improved the performance of μDMFC. Alrashidi et al.18 composed a novel anode gas diffusion layer with hydrophobic and hydrophilic pathways formed using Laser Perforation (LP) to enhance the mass transfer of methanol and carbon dioxide. Experimental results showed that the novel perforated anode gas diffusion layer improved the cell's performance by 32% over the unperforated one. It is proven that the material and structural improvement of the diffusion layer can reduce the contact impedance and mass transfer impedance, which improves the performance of μDMFC.Moreover, porous metals with considerable thermal and electrical conductivity are widely used for μDMFC diffusion layers and current collectors.11,12 Li et al.19 used Stainless Steel Fiber Felt (SSFF) for the DMFC cathode diffusion layer and current collector. The experimental results showed that the novel structure could reduce methanol crossover and obtain higher energy efficiency at higher methanol concentrations, but the contact impedance increases due to the lower mechanical strength of SSFF. Xue et al.20 used stainless steel fiber felt that deposited reduced graphene oxide (rGO-SSFF) as a DMFC cathode diffusion layer and current collector. The novel cathode structure enhanced the water return rate and reduced methanol crossover. Yuan et al.21 used super hydrophilic or superhydrophobic Copper Fiber Sintered Felt (CFSF) for DMFC cathode current collector. The super hydrophilic water field facilitated water removal at lower methanol concentrations. The superhydrophobic mode enhanced water reflux from the cathode to the anode at high concentration operation, reducing methanol crossover and improving fuel efficiency. It can be proven that using metal fiber felt as a diffusion layer and current collector can slow down the methanol penetration and achieve better cathode water management. However, as a porous metal material, the mechanical strength of metal fiber felt is lower and provides less encapsulation pressure.22
Foam metals are widely used as DMFC current collectors compared to metal fiber felts due to their superior mechanical strength.10,22 Zhao et al.12,23,24 compared hole-type foam stainless steel and hole-type stainless steel as cathode current collectors for μDMFC. It is found that the hole-type foam stainless steel cathode current collectors have a greater power density than the hole-type stainless steel current collectors. The μDMFC with foam stainless steel current collector has less mass transfer impedance than the one with stainless steel current collector, while their contact impedances are nearly the same. In their later works, Foam Stainless Steel (FSS) and Foam Titanium (FT) were tested as cathode current collectors. The results showed that the μDMFC with FSS current collectors has a greater power density than the μDMFC of FT current collectors. The gradient wettability of FSS could accelerate the discharge of cathode water. Using FSS as the current collector can provide sufficient encapsulation pressure and reduce the mass transfer impedance. However, the contact impedance was almost unchanged compared with the conventional structure. Reducing the contact impedance of μDMFC could be a feasible way to further improve its performance.
This work proposes a novel structure that uses FSS (316L) as both the cathode diffusion layer and current collector for the MEA. It can provide less contact and mass transfer impedance. In order to ensure that the FSS can provide both high mechanical strength and better mass transfer, a pore-type groove is drilled on one side, and a microporous layer and catalytic layer are made on the unslotted side. The methanol concentration, temperature, penetration, impedance, and constant current discharge tests are performed for the μDMFC with the proposed structure and compared with conventional ones.
2 Experiment
2.1 Single cell preparation
A hole-type grooved FSS with a diameter of 1 mm and a depth of 0.7 mm was obtained with a slotting rate of 38.47% by machining, as shown in Fig. 1(a). It is corroded using a 50 wt% KOH solution at 298 K and sintered with the microporous layer in a vacuum tube furnace. The treated FSS is used as the diffusion layer and current collector.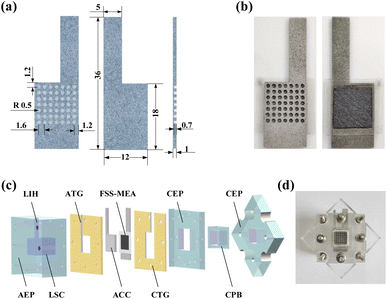 | ||
| Fig. 1 μDMFC preparation: (a) FSS front, back, and profile views in mm; (b) FSS-MEA cathode surface and anode surface; (c) μDMFC decomposition diagram; (d) assembled μDMFC. | ||
FSS-MEA anode uses carbon paper (TGP-H-060, Toray) as the diffusion layer, and the cathode uses corroded FSS as the diffusion layer and current collector. Carbon powder (XC-72, Cabot) and 10 wt% PTFE (Chemours) solution are mixed using ethylene glycol as the dispersant. The mixed slurry is scraped onto the unslotted side of the cathode FSS and the surface of the anode carbon paper several times uniformly using a squeegee, with a loading of 2 mg cm−2 after drying. Then it is sintered in a vacuum tube furnace as the microporous layer. A mixture of isopropyl alcohol, deionized water, 40 wt% Pt/C (Shanghai Hesen Electric Co., Ltd) and 5 wt% Nafion (Chemours) solution is sprayed on the cathode FSS microporous side as the catalytic layer with a Pt loading of 2 mg cm−2 after drying. 60 wt% PtRu/C (atomic ratio Pt![[thin space (1/6-em)]](https://www.rsc.org/images/entities/char_2009.gif) :
:![[thin space (1/6-em)]](https://www.rsc.org/images/entities/char_2009.gif) Ru = 1
Ru = 1![[thin space (1/6-em)]](https://www.rsc.org/images/entities/char_2009.gif) :
:![[thin space (1/6-em)]](https://www.rsc.org/images/entities/char_2009.gif) 1, Shanghai Hesen Electric Co., Ltd) is used as the catalyst for the anode, and the catalytic layer is prepared in the same way as the cathode. Meanwhile, CCP-MEA with conventional carbon paper as the cathode and anode diffusion layer is prepared for comparison.19 Nafion 117 membrane (Chemours) is pretreated by placing in a water bath for one hour at 353 K in 5 wt% H2O2, deionized water, 0.5 mol L−1 H2SO4 and deionized water.25 The carbon paper with catalytic layer side, Nafion 117 membrane, and FSS with catalytic layer side are stacked sequentially, wrapped with tinfoil, and hot-pressed for 4 min at 408 K, 1 MPa to form an effective area of 1 cm2 FSS-MEA, as shown in Fig. 1(b).
1, Shanghai Hesen Electric Co., Ltd) is used as the catalyst for the anode, and the catalytic layer is prepared in the same way as the cathode. Meanwhile, CCP-MEA with conventional carbon paper as the cathode and anode diffusion layer is prepared for comparison.19 Nafion 117 membrane (Chemours) is pretreated by placing in a water bath for one hour at 353 K in 5 wt% H2O2, deionized water, 0.5 mol L−1 H2SO4 and deionized water.25 The carbon paper with catalytic layer side, Nafion 117 membrane, and FSS with catalytic layer side are stacked sequentially, wrapped with tinfoil, and hot-pressed for 4 min at 408 K, 1 MPa to form an effective area of 1 cm2 FSS-MEA, as shown in Fig. 1(b).
μDMFC mainly consists of Anode Extremity Plate (AEP), Anode Teflon Gaskets (ATG), Anode Current Collector (ACC), FSS-MEA, Cathode Teflon Gaskets (CTG), Cathode Extremity Plate (CEP), and Cathode Pressure Block (CPB), as shown in Fig. 1(c). The APE has a Liquid Storage Cavity (LSC) with a volume of 2.2 ml and a Liquid Injection Hole (LIH) with a diameter of 3 mm. The FSS-MEA μDMFC uses grid-type stainless steel as the anode current collector with an open ratio of 42% and a thickness of 1.5 cm. The CCP-MEA μDMFC uses the same anode current collector as the FSS-MEA, and for the cathode, a perforated stainless steel current collector with a 38.47% open ratio and 1.5 cm thickness is used.
The MEA is brought into close contact with the anode current collector and cathode current collector by applying pressure through the extremity plate, where the PTFE spacers buffer the current collector and extremity plate. The liquid storage cavity provides the anode reaction of μDMFC, and its cathode reactant is provided by air. The assembled cell is shown in Fig. 1(d). Before the electrochemical tests, a constant current gradient discharge is performed using 2 mol L−1 methanol at 343 K for activation.
2.2 Physical characterization and electrochemical test
Scanning Electron Microscope (SEM) measurements and X-ray Diffraction (XRD) are performed for surface morphology characterization and physical phase structure of materials. Contact angle measurements are performed by using automatic titration with 16 μL size water droplets for static contact angle measurements of CCP and treated FSS. The porosity test is applied by using the water saturation method. The treated FSS is dried and weighed on an electronic balance for initial weight, placed in ultra-pure water, and weighed again after ultrasonic shaking. The porosity of the FSS is calculated from the weight difference.12The power density tests of μDMFC are performed with an electronic load (PV8500). The polarization tests for μDMFCs with CCP-MEA and FSS-MEA are carried out at 343 K with methanol concentrations from 0.5 mol L−1 to 3.5 mol L−1 to study the impact of methanol concentration. μDMFCs with CCP-MEA and FSSMEA are tested at 343 K and 298 K with 2 mol L−1 methanol concentration to study the temperature impact on the performance. μDMFCs with CCP-MEA and FSS-MEA are discharged under a constant current density of 100 mA cm−2 at 343 K and 2 mol L−1 to investigate their stabilities under operation.
Linear Sweep Voltammetry (LSV) test of μDMFC is performed by using an electrochemical workstation (CHI660e). The cathode is sealed and discharged for a long time until the open circuit voltage drops to 0 V, indicating that the oxygen of the cathode is depleted. 1 mol L−1, 2 mol L−1, and 3 mol L−1 methanol are injected successively. LSV test is then swept from 0 V to 1.4 V with a scan rate of 50 mV s−1 at 298 K.
Electrochemical Impedance Spectroscopy (EIS) tests of μDMFC are performed using the electrochemical workstation and electronic load. 2 mol L−1 methanol is injected into μDMFC and placed at 343 K. A steady discharge with a current density of 80 mA cm−2 is maintained to electronic load. The corresponding voltage is input as the initial voltage, the frequency range is from 0.01 Hz to 100 kHz, and eight points of equal frequency band are taken every ten times the frequency changed interval for recording.12
3 Results and discussion
3.1 FSS surface morphology and wettability
SEM measurements are performed to analyze the modification of FSS surface morphology and XRD are performed to analyze the physical phase and crystal structure of substances. The results are shown in Fig. 2.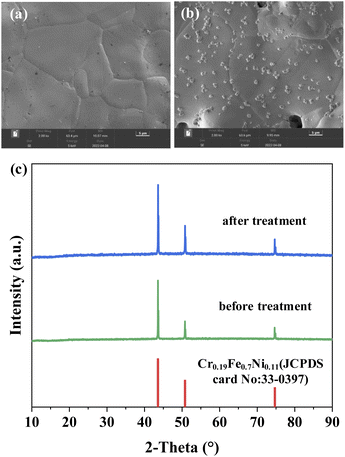 | ||
| Fig. 2 Surface morphology of the FSS: (a) before treatment; (b) after treatment; (c) XRD of the FSS. | ||
Fig. 2(a) shows FSS after corrosion with 50 wt% KOH solution and sintering. Spherical granular material can be seen generated on its surface. The roughness increased compared with the untreated FSS shown in Fig. 2(b). Fig. 2(c) shows the main crystal phase of FSS after treatment does not change significantly, which implies that the original properties are maintained.26
The physical properties of CCP and treated FSS are compared in Fig. 3.
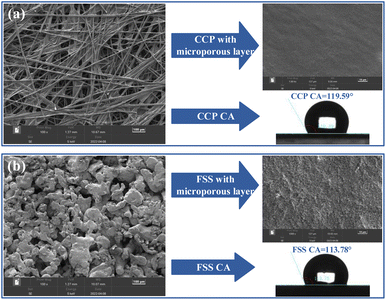 | ||
| Fig. 3 Surface morphology and contact angle: (a) conventional carbon paper; (b) flotted stainless steal. | ||
Fig. 3(a) shows that the CCP has a porous structure and its average pore diameter between carbon fibers is about 80 μm.27 Its contact angle is 119.59° (>90°), which implies a certain hydrophobicity. Fig. 3(b) shows that the treated FSS also has a porous structure, and the average pore diameter is 20 μm. CCP can be replaced by the FSS with a porous structure for the diffusion layer and the FSS has a smaller pore structure than CCP. The porosity of the treated FSS is 39.08%, as measured by the water saturation method. This porosity is smaller than that of CCP (78%). The treated FSS with a microporous layer has a more significant surface roughness due to the spherical particle matter generated on the surface of the FSS after treatment, indicating that the treated FSS has more reaction sites than CCP during subsequent catalyst spraying.28 It can be seen that the treated FSS has a contact angle of 113.78°, which is comparable to CCP in terms of wettability. The management of the gas–liquid two-phase flow is not significantly different in terms of wettability.
3.2 μDMFC performance at different methanol concentrations
The power densities of μDMFC with CCP-MEA and FSS-MEA at 343 K with different methanol concentrations are tested to investigate the performance of μDMFC of different structures. Their polarization curves are shown in Fig. 4.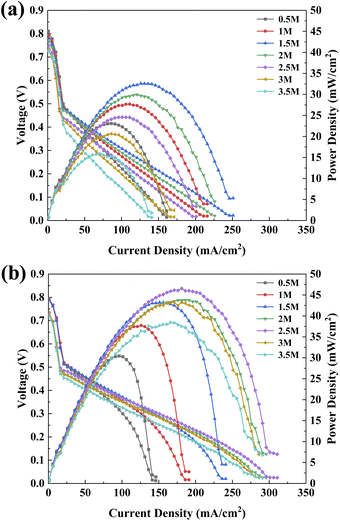 | ||
| Fig. 4 Polarization curves of μDMFC with different structures at different methanol solution concentrations: (a) CCP-MEA; (b) FSS-MEA. | ||
It can be seen in Fig. 4 that the power density and current density increase and then decrease with increasing methanol concentration, which is caused by the methanol supply not meeting the rate of electrochemical reaction at lower concentrations and more methanol penetration at higher concentrations.12 The power density of FSS-MEA μDMFC is higher than that of CCP-MEA at all concentrations. The limit current does not differ much at lower concentrations but increases more at higher concentrations. The optimal methanol concentration of FSS-MEA μDMFC is 2.5 mol L−1, which is higher than that of CCP-MEA (1.5 mol L−1). The maximum power density of FSS-MEA μDMFC is 46.55 mW cm−2, which is 42.88% higher than that of CCP-MEA (32.58 mW cm−2). Moreover, the difference between the maximum power density of FSS-MEA and CCP-MEA increases gradually with the increase of methanol concentration. The difference in maximum power density from 7.37 mW cm−2 at 0.5 mol L−1 to 22.64 mW cm−2 at 3 mol L−1. The specific values are listed in Table 1.
| Concentration (mol L−1) | CCP-MEA (mW cm−2) | FSS-MEA (mW cm−2) | Improvement (mW cm−2) |
|---|---|---|---|
| 0.5 | 23.08 | 30.45 | 7.37 |
| 1.0 | 27.69 | 37.71 | 10.02 |
| 1.5 | 32.58 | 43.20 | 10.62 |
| 2.0 | 29.95 | 43.77 | 13.82 |
| 2.5 | 24.59 | 46.55 | 21.96 |
| 3.0 | 20.61 | 43.25 | 22.64 |
| 3.5 | 15.93 | 38.45 | 22.52 |
The maximum power density comparison with recent works that use different materials and structures for DMFCs is summarized in Table 2. It can be seen that the FSS-MEA μDMFC obtains a larger power density at a higher optimum concentration Copt and obtains a better performance enhancement compared to other passive DMFCs, reflecting that the novel structure proposed in this paper can be better applied to DMFC.
The proposed structure of FSS-MEA improves the μDMFC power density. According to the reaction equation within μDMFC, the reactant oxygen and the product water in the cathode reaction are essential for the reaction to proceed. Passive μDMFC is prone to insufficient oxygen supply and water flooding due to the lack of external equipment on the cathode side and gas–liquid two-phase mass transfer by slow diffusion and other means if the ratio of direct exposure of the cathodic catalytic layer to the air is small, which can seriously hinder the oxygen reduction reaction.
Overall reaction:
 | (1) |
Anode reaction:
| CH3OH + H20 → CO2 + 6H+ + 6e− | (2) |
Cathodic reaction:
 | (3) |
It can be seen that increasing the transport channels of oxygen and water can accelerate the reaction. The direct exposure of the cathodic catalytic layer to the air of FSS-MEA is 39.08%, with the same porosity as that of FSS. In contrast, the CCP-MEA has 28.08% (calculated by multiplying the CPP porosity 73% with the current collector open ratio 38.47%).19 It can be seen that the FSS-MEA structure has a larger cathode catalytic layer exposure ratio and therefore provides more gas–liquid two-phase flow channels to the cathode of μDMFC, which reduces the mass transfer dead zone and improves the cell performance. The porous structure of FSS is more uniform than the perforated structure of the conventional current collector, which can effectively alleviate the blockage of mass transfer channels by water generated by local reactions at the cathode and the uneven heat caused by local reactions. Finally, the surface of the FSS microporous layer is rougher than that of the CCP microporous layer, providing more reaction sites and allowing more attachment points for the catalyst, thus improving the catalytic efficiency and enhancing the cell performance.28
To further investigate the effect of the FSS-MEA structure on methanol crossover, the LSV of μDMFCs of CCP-MEA and FSS-MEA are tested from methanol concentrations from 1 mol L−1 to 3 mol L−1 at 298 K to determine the crossover current density generated by the methanol penetrating from the anode to the cathode, as shown in Fig. 5. It can be seen that the crossover current densities increased with increasing methanol concentration. But the FSS-MEA μDMFC delivers lower crossover current densities than the conventional structure at all tested concentrations, and the percentage reductions increase from 6.66% at 1 mol L−1 to 16.08% at 3 mol L−1. The specific values are listed in Table 3.
 | ||
| Fig. 5 Crossover current densities of μDMFCs at different methanol concentrations: (a) 1 mol L; (b) 2 mol L; (c) 3 mol L−1. | ||
| Concentration (mol L−1) | CCP-MEA (mA cm−2) | FSS-MEA (mA cm−2) | Improvement (%) |
|---|---|---|---|
| 1 | 141.2 | 131.8 | 6.66 |
| 2 | 196.7 | 169.6 | 13.78 |
| 3 | 292.3 | 245.3 | 16.08 |
The FSS-MEA structure reduces methanol crossover due to the following two factors. First, the FSS-MEA structure has a more uniform encapsulation pressure than the conventional ones. The cathode encapsulation pressure is done by hot pressing, and the force surface is a whole surface of the unslotted surface. The FSS has more mechanical strength than the CCP. Secondly, FSS has a smaller pore diameter and almost the same contact angle as CCP, which can create higher capillary pressure in the cathode diffusion layer. It thus increases the water return rate from the cathode to the anode and, to some extent, alleviates methanol permeation.27
3.3 μDMFC performance at different temperatures
The power density of μDMFCs of CCP-MEA and FSS-MEA at operating temperature 343 K and room temperature 298 K are tested, as shown in Fig. 6.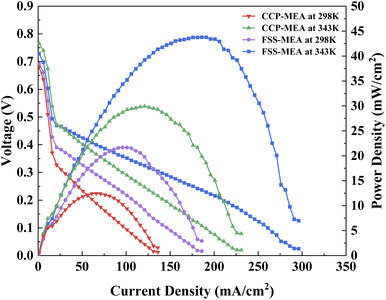 | ||
| Fig. 6 Power density curves of μDMFC at different temperatures and 2 mol L−1 methanol concentration. | ||
Fig. 6 shows that at the FSS-MEA structure provides higher power and limit current densities than the conventional one at 343 K and 298 K. The μDMFC power and limit current densities at 298 K decayed by almost half compared to 343 K. This is because the catalyst activity is not optimal at room temperature and the product water from the cathode blocks the oxygen transfer channel.24,29
It can be seen in Table 4 that the increase of maximum power density of FSS-MEA μDMFC than CCP-MEA is 74.06% at 298 K, which is higher than that at 343 K (46.14%). It indicates that The FSS-MEA μDMFC has a better drainage effect than the conventional one at room temperature.
| Temperature (K) | CCP-MEA (mW cm−2) | FSS-MEA (mW cm−2) | Improvement (%) |
|---|---|---|---|
| 343 | 29.95 | 43.77 | 46.14 |
| 298 | 12.45 | 21.67 | 74.06 |
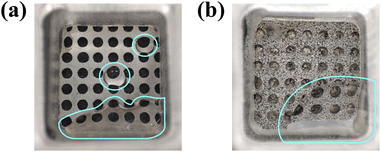
The μDMFCs of CCP-MEA and FSS-MEA are discharged for an extended period at maximum power to observe the cathode drainage, as shown in Fig. 7.
It can be seen in Fig. 7 that FSS-MEA μDMFC has a larger effective area of the cathode to air contact than CCP-MEA μDMFC even in the case of cathode flooding, which is a larger catalytic layer exposure ratio. The water in both MEAs are mainly collected in the lower part of the current collector. The difference is that the water in the FSS-MEA structure is more concentrated, which forms a better drainage channel. In contrast, the conventional structure is mainly distributed at the open hole. It implies that the FSS-MEA structure has better water management than the conventional structure, which is mainly attributed to three factors. First, the direct exposure of the catalytic layer of FSS-MEA to air is larger than that of CCP-MEA, which provides more gas–liquid two-phase flow channels, even when water flooding occurs. Secondly, FSS-MEA has a more uniform pore structure than CCP-MEA. It can provide a more uniform liquid distribution, which forms drainage channels more rapidly under gravity and capillary forces to alleviate the water accumulation blockage caused by local reactions, thus reducing the reaction dead zone.30 Third, FSS-MEA μDMFC has minor methanol crossover and will produce less water from methanol permeation from the anode to the cathode than CCP-MEA μDMFC.19
3.4 Electrochemical Impedance Spectroscopy
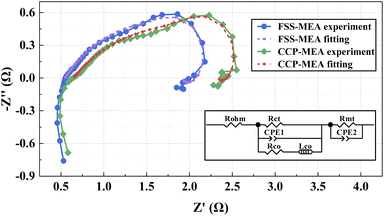
The EIS tests are applied to investigate the impedance of different structures at 2 mol L−1, 80 mA cm−2 and 343 K, as shown in Fig. 8.The high-frequency field of the Nyquist Plot is related to ohm loss, the mid-frequency field is related to activation loss, and the low-frequency field is related to quality transmission loss.4,7,31 The corresponding Equivalent Circuit Model (ECM)32 is shown in Fig. 8. Rohm denotes the ohmic resistance of the MEA, which is the sum of the contact resistances between each component (anode, cathode, and proton exchange membrane), visible as the intersection of the leftmost (high-frequency) of EIS with the real axis. Rct denotes the charge transfer resistance of the MEA electrode reaction, which is the electrochemical reaction resistance of the three-phase reaction interface in the MEA. Rmt denotes the mass transfer impedance of the MEA.25,33 Rco and low-frequency impedance of Lco represent the relaxation process of the CO product in the anode electrode.34 The Constant Phase Element (CPE) describes the realistic reaction conditions with the porous electrode and rough interface structures of cathode and anode.35 The ECM parameters can be identified by fitting the model to the EIS curves. The results are listed in Table 5.
| Impedances | CCP-MEA (Ω cm−2) | FSS-MEA (Ω cm−2) (%) | Improvement |
|---|---|---|---|
| Rohm | 0.65 | 0.55 | 15.38 |
| Rct | 1.74 | 1.58 | 9.20 |
| Rmt | 1.33 | 0.99 | 25.56 |
All the impedances of FSS-MEA μDMFC are smaller than the conventional CCP-MEA structure, which might be due to the following factors. First, the FSS has superior mechanical strength and higher conductivity than CCP. The integrated structure of FSS-MEA μDMFC cathode current collector and diffusion layer reduces the ohmic loss.11 Secondly, FSS-MEA structure has a smaller Rct than the conventional structure due to its rougher microporous layer surface of the cathode, providing more reaction sites for the catalytic layer and thus reducing the activation loss.25,28 Third, FSS-MEA structure has a smaller Rmt due to its uniform pore distribution of FSS and larger cathode catalytic layer exposure rate, providing adequate gas–liquid two-phase flow paths to the cathode.
3.5 Discharging
The discharging for μDMFCs of CCP-MEA and FSS-MEA are tested to investigate the energy efficiency of μDMFC at 343 K and 2 mol L−1 (2 ml) under a discharge current density of 100 mA cm−2. The discharge voltage versus discharge duration curves is plotted in Fig. 9.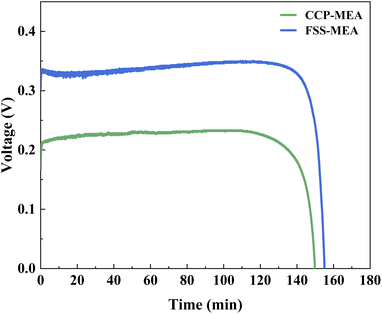 | ||
| Fig. 9 Long-time discharge of μDMFCs at 343 K and 2 mol L−1 under a discharge current density of 100 mA cm−2. | ||
It can be seen that the discharge voltage of FSS-MEA μDMFC is 0.34 V under 100 mA cm−2, while that of CCP-MEA μDMFC is 0.23 V. The discharge voltage of the FSS-MEA structure is 47.83% higher than that of the conventional structure. The discharge time of FSS-MEA is 155 min, five minutes more than the conventional structure. Those indicate that the FSS-MEA structure of μDMFC has a higher energy efficiency than the conventional structure at the same methanol concentration, mainly due to the following two facts. First, the FSS-MEA structure has a higher power density than the conventional structure due to its more reactive sites in the catalytic layer, more uniform pore structure for pressure distribution, larger exposure rate of the cathode catalytic layer, and less methanol penetration. Secondly, The FSS-MEA μDMFC has a minor impedance loss in terms of ohmic loss, activation loss, and mass transfer loss.
4 Conclusion
A novel MEA with slotted FSS as cathode diffusion layer and current collector was proposed and prepared in this work to reduce the contact impedance and mass transfer impedance of μDMFC. The SEM and electrochemical tests were carried out to verify the performance of the proposed structure. The results showed that the proposed FSS-MEA structure could improve the performance of μDMFC in the following aspects.1. In terms of power density, at operating temperature, the maximum power density of FSS-MEA μDMFC is 42.88% higher than that of CCP-MEA μDMFC. The optimal methanol concentration is 1 mol L−1 higher. At room temperature and 2 mol L−1 methanol concentration, the FSS-MEA μDMFC delivered 74.06% higher maximum power density with better water management during long-time discharge.
2. In terms of impedance, the ohmic impedance of FSS-MEA μDMFC is 15.38% smaller than that of CCP-MEA μDMFC. Its mass transfer impedance is 25.56% smaller than that of CCP-MEA μDMFC.
3. In terms of energy efficiency, under the same conditions, the discharge voltage of SS-MEA μDMFC is 47.83% higher than CCP-MEA μDMFC, and the discharge time is 5 min longer.
Author contributions
Conceptualization, Z. Z. and Z. W.; methodology, Z. Z. and Z. W.; software, Z. W.; validation, Z. W. and K. L.; formal analysis, D. Z.; investigation, Z. W. and K. L.; resources, Z. Z. and D. Z.; data curation, Z. W.; writing—original draft preparation, Z. Z. and Z. W.; writing—review and editing, Z. Z. and D. Z.; visualization, Z. W.; supervision, Z. Z. and D. Z.; project administration, Z. Z.; funding acquisition, Z. Z. and D. Z.Conflicts of interest
There are no conflicts to declare.Acknowledgements
This work was partly supported by the National Science Foundation of China (NSFC, Grant No. 62162035 and 62103174) and Applied Basic Research Foundation of Yunnan Province (Grant No. 202201AT070107).Notes and references
- B. G. Abraham and R. Chetty, Int. J. Hydrogen Energy, 2021, 46, 6845–6856 CrossRef.
- M. S. Alias, S. K. Kamarudin, A. M. Zainoodin and M. S. Masdar, Int. J. Hydrogen Energy, 2020, 45, 19620–19641 CrossRef.
- X. Chen, T. Li, J. Shen and Z. Hu, Renewable Sustainable Energy Rev., 2017, 80, 669–678 CrossRef.
- S. Su, J. Liang, Y. Luo, Z. Liu, X. Li, P. Yin, L. Chen, Y. Cui and D. Wang, Energy Convers. Manage., 2021, 246, 114665 CrossRef.
- L. Wang, L. Yin, W. Yang, Y. Cheng, F. Wen, C. Liu, L. Dong and M. Wang, Int. J. Hydrogen Energy, 2021, 46, 2594–2605 CrossRef.
- M. A. Abdelkareem, E. T. Sayed and N. Nakagawa, Energy, 2020, 209, 118492 CrossRef.
- F. Jing, R. Sun, S. Wang, Y. Li, C. Yang, W. Ma, H. Sun and G. Sun, Fuel Cells, 2019, 19, 731–739 CrossRef CAS.
- S. Osman and M. Ahmed, Energy Convers. Manage., 2022, 251, 114958 CrossRef CAS.
- G. Rambabu, D. B. S and F. M. L. Figueiredo, Nanomater., 2019, 9, 1292 CrossRef CAS.
- W. C. Tan, L. H. Saw, H. S. Thiam, J. Xuan, Z. Cai and M. C. Yew, Renewable Sustainable Energy Rev., 2018, 96, 181–197 CrossRef.
- W. Yuan, Y. Tang, X. Yang and Z. Wan, Appl. Energy, 2012, 94, 309–329 CrossRef CAS.
- Z. Zhao, F. Zhang, Y. Zhang and D. Zhang, Energies, 2021, 14, 6608 CrossRef CAS.
- B. A. Braz, C. S. Moreira, V. B. Oliveira and A. M. F. R. Pinto, Electrochim. Acta, 2019, 300, 306–315 CrossRef CAS.
- B. A. Braz, V. B. Oliveira and A. M. F. R. Pinto, Int. J. Hydrogen Energy, 2019, 44, 19334–19343 CrossRef CAS.
- B. A. Braz, V. B. Oliveira and A. M. F. R. Pinto, Energy, 2020, 208, 118394 CrossRef CAS.
- W. Hao, H. Ma, G. Sun and Z. Li, Energy, 2019, 168, 80–87 CrossRef CAS.
- Y. Zhu, X. Zhang, J. Li and G. Qi, Int. J. Mod. Phys. B, 2018, 32, 1850145 CrossRef CAS.
- A. Alrashidi and H. Liu, Int. J. Hydrogen Energy, 2021, 46, 17886–17896 CrossRef CAS.
- Y. Li, X. Zhang, L. Nie, Y. Zhang and X. Liu, J. Power Sources, 2014, 245, 520–528 CrossRef CAS.
- R. Xue, Y. Zhang and X. Liu, Energy, 2017, 139, 535–541 CrossRef CAS.
- W. Yuan, F. Han, Y. Chen, W. Chen, J. Hu and Y. Tang, J. Electrochem. Energy Convers. Storage, 2018, 15, 031003 CrossRef.
- Y. Zhang, Y. Tao and J. Shao, J. Power Sources, 2021, 492, 229664 CrossRef CAS.
- F. Zhang, Y. Zhang, C. Luo, D. Zhang and Z. Zhao, RSC Adv., 2022, 12, 4145–4152 RSC.
- F. Zhang, Y. Zhang and Z. Zhao, Nanomater., 2022, 12, 948 CrossRef PubMed.
- W. Sun, W. Zhang, H. Su, P. Leung, L. Xing, L. Xu, C. Yang and Q. Xu, Int. J. Hydrogen Energy, 2019, 44, 32231–32239 CrossRef.
- H. Jain, G. Gupta, D. P. Mondal and A. Pandey, Mater. Chem. Phys., 2022, 288, 126353 CrossRef.
- H. Deng, Y. Zhang, X. Zheng, Y. Li, X. Zhang and X. Liu, Energy, 2015, 82, 236–241 CrossRef.
- M. Chen, M. Wang, Z. Yang, X. Ding, Q. Li and X. Wang, Electrochim. Acta, 2018, 263, 201–208 CrossRef.
- Y. Cheng, J. Zhang, S. Lu and S. P. Jiang, J. Power Sources, 2020, 450, 227620 CrossRef.
- A. Fly, D. Butcher, Q. Meyer, M. Whiteley, A. Spencer, C. Kim, P. R. Shearing, D. J. L. Brett and R. Chen, J. Power Sources, 2018, 395, 171–178 CrossRef CAS.
- S. S. Munjewar and S. B. Thombre, Renewable Energy, 2019, 138, 272–283 CrossRef CAS.
- Q. Xu, W. Sun, J. Zhang, W. Zhang, Q. Ma, H. Su and L. Xing, Int. J. Green Energy, 2020, 18, 566–577 CrossRef.
- F. Baştürk, H. Yüksel and R. Solmaz, Int. J. Hydrogen Energy, 2019, 44, 14235–14242 CrossRef.
- Y. Zhu, L. Gao and J. Li, Micromachines, 2019, 10, 658 CrossRef.
- M. Boni, S. R. Surapaneni, N. S. Golagani and S. K. Manupati, Chem. Pap., 2020, 75, 27–38 CrossRef.
| This journal is © The Royal Society of Chemistry 2022 |

