 Open Access Article
Tracing carbonation in cementitious slurry using anthocyanin extracted from fresh or stale petals
Dong Cui†
 *a,
Wenya Liu†b,
Jing Wanga,
Chunping Guc,
Yi Wan
 *d and
Junsong Wang
 *b
*b
aDepartment of Civil Engineering, School of Science, Nanjing University of Science & Technology, Nanjing 210094, China. E-mail: cuidong@njust.edu.cn
bSchool of Environmental and Biological Engineering, Nanjing University of Science & Technology, Nanjing 210094, China
cCollege of Civil Engineering and Architecture, Zhejiang University of Technology, Hangzhou 310023, China
dDepartment of Applied Physics and Institution of Energy & Microstructure, Nanjing University of Science & Technology, Nanjing 210094, China. E-mail: wang.junsong@gmail.com
First published on 14th November 2022
Abstract
Tracing carbonation in cementitious slurries is very necessary, as it helps to accurately design the durability of infrastructure and achieve carbon neutrality. In this study, anthocyanins extracted from fresh or stale Orychophragmus violaceus (O. violaceus) flowers on campus were prepared, and their capability as substitute of phenolphthalein, to trace carbonation in cementitious materials was studied. Anthocyanin extracted from stale petal had undergone significant deterioration, while that extracted from fresh petal could be cryo-preserved effectively for at least one year. Combining pH, chemical and porosity analysis, the reliability of the novel anthocyanin indicator in tracing carbonation was verified. With the increase of discoloration pH, the carbonation depth read from anthocyanin contained partial carbonated zone, thus was larger than those read from phenolphthalein. Moreover, the varied evolving pattern on the spatial distribution of local saturation degree in cementitious slurries during carbonation was studied, based on which factors affecting the broadness of partial carbonated zone were offered, and circumstances under which anthocyanin would be more accurate than phenolphthalein were offered. For conditions where a broad partial carbonated zone is presented or a condition where higher standard on human safety is required, the new-developed O. violaceus indicator is more competitive over phenolphthalein.
Introduction
Tracing carbonation in reinforced concrete is very important.1–4 Through continuous absorption of CO2, the pH environment of the pore solution inside a reinforced concrete structure gradually shifts from alkaline to neutral after decades of service in the air, “sabotaging” the stability of the de-passivation layer on the reinforced surface.5 Subsequently, without the protection of the protective layer, the reinforcement rapidly corrodes, losing its loading capacity, and causing the protective layer to crack and flake, eventually failure.6,7 Unfortunately, due to ongoing global climate change, the entire world is now suffering from increases on CO2 concentration and global temperature, both of which accelerate the carbonation process described above.8–10 Therefore, tracing carbonation in reinforced concrete is very significant, as it can help accurately evaluate the durability of concrete structures.From the perspective of achieving carbon neutralization, tracing carbonation also seems indispensable. By promoting engineering technologies such as concrete waste carbonation,11 carbonation curing,12 etc., the concrete-related CO2 emission can be significantly reduced, and the “role” of cement industry may thus change from the largest CO2 emitter to the largest carbon sink.12–14 Therefore, for the purpose of carbon sequestration in cement industry, tracing carbonation is also essential, as it can help tune the engineering techniques associated with carbon sequestration.
Up to date, in civil engineering, phenolphthalein spray is the most commonly used method for carbonation characterization.15–17 There is basically no substitute for phenolphthalein spray due to its high efficiency, low cost and good reproducibility. Besides, phenolphthalein shows obvious chromatic aberration in carbonation (remaining colourless when tested at a pH below 9, but turning pink fuchsia when higher alkaline is encountered). Despite that, opposition to use phenolphthalein in spray testing has never ceased.18 For one thing, phenolphthalein is not safe to use because it is toxic to humans.18,19 For the other, in practical circumstances, the carbonation fronts may not be fully carbonated, and the local reduced pH within the front may thus be limited, exceeding the detectable range of pH for phenolphthalein.18,19 Nonetheless, ignorance of the partial carbonated area is inappropriate, as the corrosion of rebars is still accelerated within the zone.20 Meanwhile, the degree of carbon sequestration may also be underestimated regardless of the partial carbonated area.
In order to make up for the deficiency, the search for an alternative pH indicator has never stopped. In this study, inspired by biologists,21,22 anthocyanin extracted from petals of Orychophragmus violaceus (O. violaceus) was prepared, and its potential to replace phenolphthalein in tracing carbonation was investigated. O. violaceus is a member of the Cruciferae family, with high yield, non-toxicity, and good insect resistance. Also, it is the most-common ground cover plant in Asian countries.23,24 Anthocyanin in O. violaceus petals exhibits a high sensitivity to ambient pH and presents a wide range of colours as a function of pH value.25 Besides, anthocyanin is readily soluble in water, thus promising as a pH indicator.21 Anthocyanin was used previously by Chinchón-Payá et al.26 to study carbonation, but to the authors' knowledge, this is first use of anthocyanin extracted from O. violaceus petals in tracing carbon footprint of cementitious slurries, and the reliability, durability as well as reproducibility of the new indicator would be systematically examined in present study.
In consideration of the perishable nature of anthocyanin, both O. violaceus flowers collected from current year and from the year before (stored at −80 °C) were used to formulate pH indicators in this study, and the carbonation depths read by anthocyanin and by phenolphthalein were compared, based on which the reliability of anthocyanin was verified, and the optimal method to preserve anthocyanin was obtained as well. Carbonation depths read from anthocyanin indicator were further verified by X-ray attenuation method (XRAM), where local carbonation product and local porosity were used as clue for carbonation characterization. Furthermore, according to the evolving pattern of spatial distribution of local saturation degree during carbonation, factors which lead to broader partial carbonated zone were discussed, and circumstances under which the novel anthocyanin indicator would be more accurate as compared to phenolphthalein in tracing carbonation were offered.
Experimental
Preparation of the pH indicator
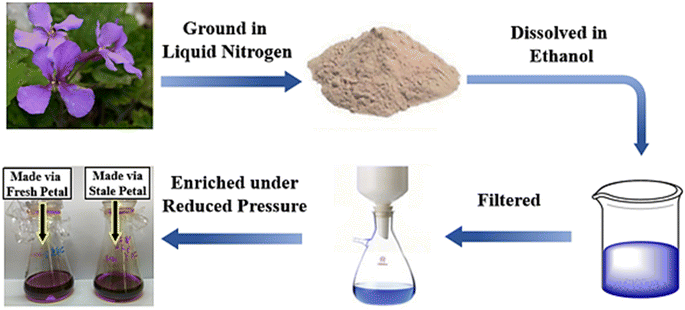
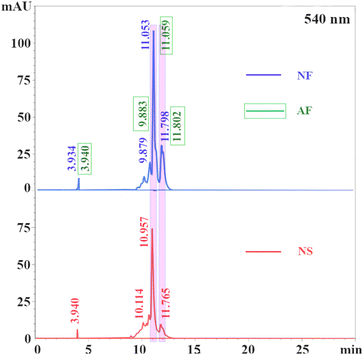
All petals were carefully collected from flowers, rinsed, and crushed into a homogeneous powder with a mortar and pestle under liquid nitrogen. Next, 50 g of frozen powder was weighed and dissolved in 100 mL ethanol for 24 h at 4 °C. The dissolved solution was then filtered and decompressed for enrichment. Finally, ethanol was added into the solution to balance the final concentration of the newly formulated indicator. The concentration of anthocyanin was determined based on chromatograms obtained through high performance liquid chromatography (HPLC, see Fig. 4), where the peak height at about 10 min was balanced to approximately 10 mAU. The detailed indicator preparation process is shown in Fig. 1. As shown, there was no significant colour difference between the dye solutions extracted from fresh and stale petals, again suggesting that the anthocyanins were only partially ineffective after 1 year of refrigeration.Preparation of partly carbonated specimens
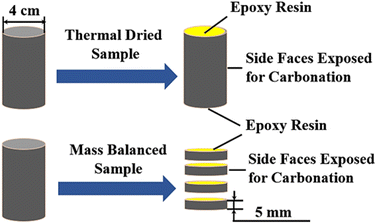
PII 42.5 cement was used. The water to cement ratio was chosen to be 0.5. Cylindrical moulds with an inner diameter of 4 cm were used for casting. Next, slurries were cast in moulds, covered with plastic sheet for 24 h at ambient condition before de-moulding, and further cured under standard curing condition (20 ± 1 °C, and relative humidity of above 95%) for 28 days. Noted here that cementitious slurries were used in present study, with the aim to create a relatively uniform microstructure, so the difference in carbonation depths could be well identified using pH indicator. Besides, the transport characteristics of CO2 and moisture, which served as the controlling factors determining the carbonation behaviour of cementitious materials,27,28 could be better characterized if cementitious slurry was adopted, and the reason behind the different carbonation depths read from variant indicators could be offered.As mentioned earlier, migrations of CO2 and moisture significantly affect the carbonation behaviour. Therefore, it is necessary to control the humidity level during pre-treatment. In this study, two pre-treating schemes (thermal drying and mass balancing) were adopted. To be detailed, for thermal-dried specimens, they were transferred to a vacuum oven of 45 °C for 14 days immediately after curing; while for mass-balanced specimens, they were mass-balanced in a climate chamber with 65% relative humidity (RH) for three months. During mass balancing period, nitrogen gas was injected periodically into the climate chamber to avoid air carbonation. Moreover, sliced samples with a thickness of approximately 5 cm were used for mass balancing, aiming at accelerating the balancing progress.
After preconditioning, the top and bottom surfaces of all specimens were sealed with epoxy resin, and the remained faces were exposed for accelerated carbonation (see Fig. 2). The carbonation test was performed in a carbonation chamber with a climate of 65 ± 5% RH, 20 ± 2 °C and 3 ± 1% CO2 concentration. The samples at different carbonation ages were used then for the reliability evaluation of the new-developed anthocyanin indicator.
Results and discussion
Chromatograms obtained through HPLC
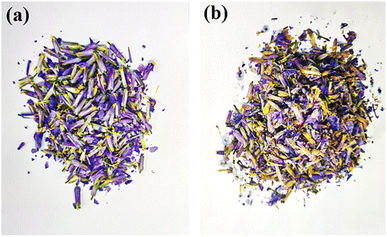
Petals from fresh (right after plucking) and stale (plucked and stored for one year) O. violaceus flowers were collected respectively from the flower beds on campus. To avoid deterioration of anthocyanin, all flowers were preserved immediately in a refrigerating cabinet at −80 °C immediately after plucking. The typical photographs of fresh and stale flowers are shown in Fig. 3. As shown, the flowers harvested one year earlier showed a symptom of wilting compared to flowers harvested recently. The results demonstrated that anthocyanin kept deteriorating during long-term storage, even cryo-preserved. Nevertheless, anthocyanin might not be fully degraded, as exhibited in Fig. 3, the fading degree of colour from stale petals seemed limited.For convenience, new indicator extracted from fresh O. violaceus petals, aged indicator extracted from fresh O. violaceus petals, and new indicator extracted from stale O. violaceus petals were denoted as “NF”, “AF” and “NS”, respectively in the following. According to the naming scheme, Fig. 4 shows the chromatograms of NF, AF and NS. As shown, compared with NF and AF, the peaks representing anthocyanin (marked in pink bars) attenuated significantly on the chromatogram of NS. The result signed again an ongoing deterioration of anthocyanin inside petals, even preserved under −80 °C. Fortunately, if an extraction of anthocyanin was performed instantly on fresh petals, even after one-year of cryo-storage, the decomposition of anthocyanin was minimal (see the overlapped chromatograms of NF and AF at the top figure of Fig. 4). Judging from the result, the internal environment of O. violaceus petal was suspected “unfriendly” to anthocyanin, but those detrimental substances (e.g., enzyme) could be excluded after an in-time extraction.19 Considering that the durability of anthocyanin must be maximized if promoting anthocyanin indicator as a carbonation tracer, immediate extraction of anthocyanin from fresh petals, and cryo-preservation next is recommended here as the optimal scheme for indication formulation.
Colour variation of anthocyanin and phenolphthalein
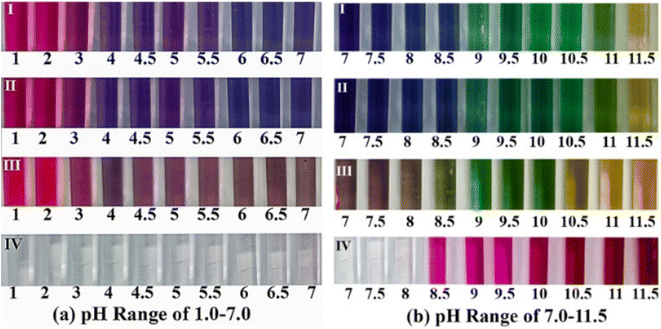
Fig. 5 shows the colour variation of NF, AF, NS and phenolphthalein in pH range of 1.0–11.5. Apparently, phenolphthalein remained colourless at pH below 8, while turned pink in a higher alkaline environment. For anthocyanin indicators, they presented wider range of chromatic aberration: all anthocyanin indicators exhibited red when the surrounding pH was below 4 (forming flavylium cation under strong acid condition, a reversible process), blue or khaki in the pH range of 4.0–8.5 (forming quinonoidal anhydrobase, a reversible process), green when the surrounding pH was above 9, and eventually yellow (forming chalcone, failure of anthocyanin, irreversible).29–31According to Fig. 5, NF and AF had similar chromatic aberrations, while NS demonstrated significant difference. Compared with NF and AF, NS had a weaker colour intensity and presented yellow earlier, indicating failure of anthocyanin in advance. Even so, anthocyanin in NS still seemed trustable, as the discoloration pH in the range of 7–10 was fixed on approximately 9 for all three types of anthocyanin indicators. The result highlighted the reliability of anthocyanin to indicate the carbonation front of cementitious slurry, even partly degraded.
Notably, the discoloration pH for anthocyanin was slightly ahead of that for phenolphthalein (approximately 8.5). Considering that the initial pH of pore solution in cementitious slurry was usually higher than 12,6 anthocyanin might be more suitable than phenolphthalein in reading the partial carbonated zone, as the pH of the area was usually higher than 8.5, but lower than 9.7,9
Carbonation zones read from variant indicators
To vividly evaluate the reliability of the new-developed indicator in tracing carbonation, anthocyanin and phenolphthalein were sprayed respectively on the cross sections of cementitious slurries pre-treated with mass balancing (see Fig. 6) or thermal drying (see Fig. 7). As shown, after phenolphthalein spray, the pore solution of carbonated area remained colourless, while that of the non-carbonated area turned pink fuchsia (agrees with Fig. 5). However, after anthocyanin spray, even though the reaction also occurred in pore solution, the carbonated and non-carbonated areas turned khaki and green respectively, which seemed incompatible with Fig. 3: the pH of the pore solution for non-carbonated area was higher than 12, thus should turn yellow after anthocyanin indicator was sprayed according to Fig. 5. However, in both Fig. 6 and 7, these non-carbonated areas exhibited yellow after anthocyanin indicator spray. The most plausible reason for the inconsistency was the different volume ratio of the pH indicator to solution under test in both circumstances: as natural dye deteriorated easily under alkaline environment (readers may recall, turning yellow, an irreversible progress). In Fig. 5, trace amount of anthocyanin indicator (only a few drops) was dissolved in each dropper (filled with 2 mL pH solution), the anthocyanin was in complete contact with the high alkaline solution (pH > 11.5), thus degraded instantly; while in Fig. 6 and 7, anthocyanin indicators were sprayed on the exposed cross sections only, and with a larger volume ratio of the indicator to the solution under test, the degradation of anthocyanin was much slower, and green, instead of yellow, emerged.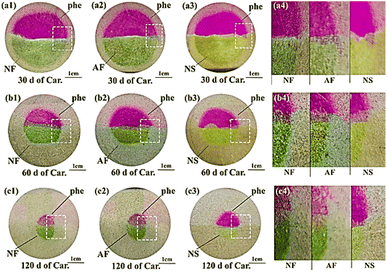 | ||
| Fig. 6 Typical cross sections of mass-balanced specimens after spraying. The upper and the bottom halves were sprayed with phenolphthalein and anthocyanin, respectively. | ||
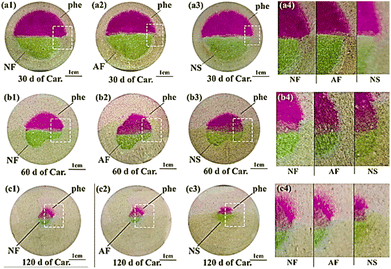 | ||
| Fig. 7 Typical cross sections of thermal-dried specimens after spraying. The upper and the bottom halves were sprayed with phenolphthalein and anthocyanin, respectively. | ||
As shown in Fig. 6 and 7, although khaki seemed blurred on grey cementitious slurries, the colour difference between the non-carbonated (green) and carbonated (khaki) area could still be easily recognized after spray of anthocyanin. The carbonated areas read from all anthocyanin indicators showed high consistency with each other, which served as compelling evidence that anthocyanin indicator was suitable in tracing carbonation. Nonetheless, compared with the sprayed cross section of NS, the colour intensity appeared stronger on the sprayed cross sections of NF and AF, which demonstrated again the ongoing failure of anthocyanin in NS. Besides, cryo-storage of fresh petal extract was evidenced again as the optimal strategy to preserve anthocyanin.
The carbonation depths read from phenolphthalein and anthocyanin, in general, were compatible with each other. However, on closer inspection, for the carbonation depths recorded at 30 d of carbonation for thermal-dried specimen, the result presented discrepancy: the carbonation depth of thermal-dried sample subjected to 30 d of carbonation, was relatively larger based on anthocyanin indicator. The result was reasonable revisiting Fig. 5: in the pH range of 7.0–10.0, the discoloration pH of anthocyanin (about 9) was greater than that of phenolphthalein (about 8.5), so the new-formulated anthocyanin indicator might individually include the partial carbonated zone, leading to a greater carbonation depth as compared to phenolphthalein.
To quantitatively illustrate the discrepancy, 20 radial profiles were randomly selected on each cross section sprayed separately with phenolphthalein and anthocyanin indicator, and the measured carbonation depths were then averaged and plotted as a function of square root of carbonation age, as shown in Fig. 8. Note that the carbonation depths read from NS were relatively harder to be correctly recorded, the carbonation depths plotted in Fig. 8 were read from NF and AF.
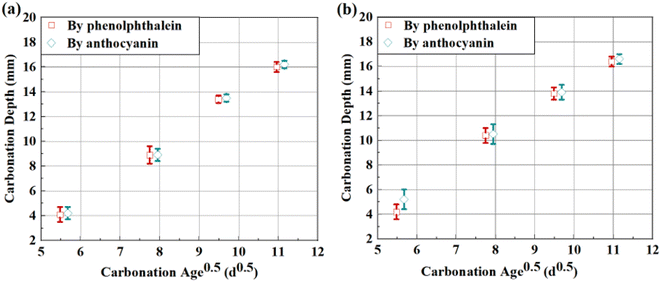 | ||
| Fig. 8 Carbonation depths vs. square root of carbonation ages for (a) mass-balanced and (b) thermal-dried cementitious slurries. | ||
As shown, compared with mass balancing, the carbonation rate of thermal-dried sample was slightly higher, and the standard variations of carbonation depths (marked as error bars in Fig. 8) were larger. Faster carbonation and severer fluctuation of carbonation depths all suggested that the microstructure near the sample surface might be less intact after thermal drying, and CO2 was therefore preferable to diffuse through these surface cracks.32 Also, the humidity level near the sample surface might be lower after thermal drying, the gaseous space in pores was larger, which also contributed to the faster carbonation.33
Based on the larger difference between the carbonation depths read from two pH indicators, partial carbonated zone at early carbonation age was suspected to be larger for thermal-dried sample. The broader partial carbonated zone was most-likely resulted from variant internal humidity:33 the surface of thermal-dried sample was relatively drier, while the RH in its core was still be high. Therefore, during early-age carbonation, CO2 binding near the sample surface might be less sufficient due to lack of liquid phase.34 With continuous absorption of moisture from the ambient environment, the carbonation degree near the sample surface gradually increased, and the carbonation degree within the local area enhanced accordingly. However, the migration rate of moisture was slower than that of CO2, so the increase on the carbonation degree by water supplement was relatively slower, and that leaded to the formation of broad partial carbonated zone.35 Later, when the carbonation reached the core area of the sample, as the local humidity there was initially high, carbonation could be complete once CO2 reached, and the partial carbonated zone was thus narrower.36 For mass-balanced samples, since the inner humidity maintained stable (approximately 65%) after pre-treatment, the lower carbonation degree due to low humidity was absent, and the partial carbonated zone was thus narrow throughout the carbonation test.35 The deduction here will be further validated by humidity test in the following paragraph.
Validation of carbonated zones read from variant indicators
To verify the carbonation results based on spray tests, the evolutions of local calcium carbonate (C![[C with combining macron]](https://www.rsc.org/images/entities/char_0043_0304.gif) ) formed during carbonation and local porosity were calibrated respectively using X-ray attenuation method (XRAM), and both 1D distributions of formed C
) formed during carbonation and local porosity were calibrated respectively using X-ray attenuation method (XRAM), and both 1D distributions of formed C![[C with combining macron]](https://www.rsc.org/images/entities/char_0043_0304.gif) and local porosity are shown in Fig. 9. As shown, the local porosity decreased from about 40% to approximately 32% during carbonation, and about 7 mol L−1 C
and local porosity are shown in Fig. 9. As shown, the local porosity decreased from about 40% to approximately 32% during carbonation, and about 7 mol L−1 C![[C with combining macron]](https://www.rsc.org/images/entities/char_0043_0304.gif) formed along the process. The so-called “pore clogging” effect has been widely reported,37–39 as calcium bearing materials transferred into C
formed along the process. The so-called “pore clogging” effect has been widely reported,37–39 as calcium bearing materials transferred into C![[C with combining macron]](https://www.rsc.org/images/entities/char_0043_0304.gif) (in the form of fine particles) during carbonation, the microstructure of cementitious slurry could be refined. Besides, the C
(in the form of fine particles) during carbonation, the microstructure of cementitious slurry could be refined. Besides, the C![[C with combining macron]](https://www.rsc.org/images/entities/char_0043_0304.gif) concentration appeared higher near the surface of thermal-dried sample, which was most probably due to absorption of water: as the sample surface was excessively dried during pre-treatment, the area was more likely to absorb moisture during carbonation, and the increased attenuation coefficient due to moisture absorption was also counted as “CO2 binding”.33 Nonetheless, a sharp change of porosity and C
concentration appeared higher near the surface of thermal-dried sample, which was most probably due to absorption of water: as the sample surface was excessively dried during pre-treatment, the area was more likely to absorb moisture during carbonation, and the increased attenuation coefficient due to moisture absorption was also counted as “CO2 binding”.33 Nonetheless, a sharp change of porosity and C![[C with combining macron]](https://www.rsc.org/images/entities/char_0043_0304.gif) could be witnessed every time on both curves entering the carbonation front, which served as a clue to trace carbonation, and the broadness of partial carbonated zone could be evaluated accordingly.
could be witnessed every time on both curves entering the carbonation front, which served as a clue to trace carbonation, and the broadness of partial carbonated zone could be evaluated accordingly.
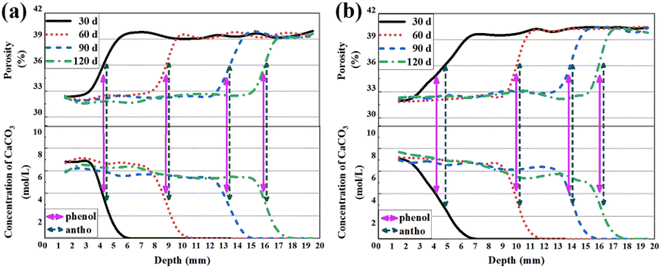 | ||
Fig. 9 1D distributions of calcium carbonate (C![[C with combining macron]](https://www.rsc.org/images/entities/char_0043_0304.gif) ) and porosity for (a) mass-balanced and (b) thermal-dried cementitious slurries. ) and porosity for (a) mass-balanced and (b) thermal-dried cementitious slurries. | ||
The carbonation depths read from phenolphthalein and anthocyanin at each carbonation age are also marked in Fig. 9. Even though the carbonation depths read from different pH indicators varied, both carbonation depths could be fitted within the carbonation fronts revealed by XRAM. The result again, validated that both pH indicators are reliable. For thermal-dried sample, the local porosity was less reduced at 30 d of carbonation, and the C![[C with combining macron]](https://www.rsc.org/images/entities/char_0043_0304.gif) formed was less, both of which validated less carbonated sample surface at 30 d of carbonation for thermal-dried sample. Under that circumstance, the partial carbonated zone was broader due to incomplete consumption of calcium bearing materials,33 and that zone was exclusively counted by anthocyanin.
formed was less, both of which validated less carbonated sample surface at 30 d of carbonation for thermal-dried sample. Under that circumstance, the partial carbonated zone was broader due to incomplete consumption of calcium bearing materials,33 and that zone was exclusively counted by anthocyanin.
In summary, anthocyanin indicator is reliable in tracing carbonation of cementitious slurries. Better yet, the new-developed pH indicator seems more competitive over phenolphthalein when handling samples with a broad partial carbonated zone.
Effect of saturation degree on the carbonation front shape
It is essential to trace the evolving pattern of local humidity during carbonation, as it can help unveil the effect of moisture content on the carbonation behaviour. Furthermore, circumstances where anthocyanin is more accurate than phenolphthalein can also be offered through such analysis. Thanks to XRAM, local saturation degree for mass-balanced or thermal-dried specimens at variant carbonation ages was also measurable through a dual CT scan of the same sample in the original state and in the dried state, separately.33 The obtained 1D saturation degree profiles are shown in Fig. 10. Similar with Fig. 9, the carbonation depths read from variant pH indicators are marked as well on the figures.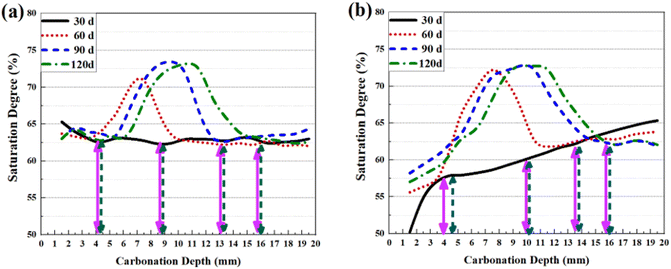 | ||
| Fig. 10 1D distributions of saturation degree for (a) mass-balanced and (b) thermal-dried cementitious slurries. | ||
As shown, right after 30 d of carbonation, the saturation degree of the sample surface was slightly higher than that inside for mass-balanced sample. The result agreed with previous investigation:32,33 as carbonation released moisture and refined the microstructure of cementitious slurry, the local saturation degree would gain a temporary increase. Besides, new peaks were generated on saturation curves, which was also resulted from the coupled effects of refined microstructure and increased moisture content.32 For thermal-dried samples, a gradient from the sample surface to the core was evident on the 1D saturation degree curve after 30 d of carbonation, which evidenced the excessively dried sample surface after thermal pre-treatment. Nonetheless, the low saturation degree at the sample surface gradually compensated through continuous absorption of water from the carbonation chamber, release of water by chemical reaction and pore refinement.33
In general, low saturation degree near the sample surface benefited the diffusion of gaseous CO2, and the carbonation of thermal-dried sample was thus faster compared with mass-balanced sample.34 Besides, as shown in Fig. 10(b), the saturation degree near the surface of thermal-dried sample was quite low at 30 d, which explained the low C![[C with combining macron]](https://www.rsc.org/images/entities/char_0043_0304.gif) concentration at early carbonation: due to lack of water, the calcium bearing materials could not be depleted at once when CO2 reached the area, so the whole carbonation process could not be regarded as diffusion controlled, and the partial carbonated zone was thus broader.37 Quite the contrary, for the carbonation carried out later, since the local saturation degree of the carbonation front was relatively higher, calcium bearing materials could be deplete once CO2 reached the carbonation front, and a narrow partial carbonated zone was thus formed.40
concentration at early carbonation: due to lack of water, the calcium bearing materials could not be depleted at once when CO2 reached the area, so the whole carbonation process could not be regarded as diffusion controlled, and the partial carbonated zone was thus broader.37 Quite the contrary, for the carbonation carried out later, since the local saturation degree of the carbonation front was relatively higher, calcium bearing materials could be deplete once CO2 reached the carbonation front, and a narrow partial carbonated zone was thus formed.40
As mentioned earlier, broad partial carbonated zone leaded to the difference on the carbonation depths read from phenolphthalein and from anthocyanin. Therefore, based on the saturation degree curves in Fig. 10, anthocyanin indicator seems more competitive over phenolphthalein when studying drier concrete (which is more likely to possess a broad partial carbonated zone).
Discussion
Applicability of the new-developed anthocyanin indicator
Anthocyanin was adopted previously by Chinchón-Payá et al.26 to characterize the carbonation behaviour of cement-based materials. Following the pioneering work, a “leap” was made in present study towards the application of anthocyanin in carbonation study. First of all, a reproducible formulating strategy of the anthocyanin indicator was proposed, which could effectively control the concentration of anthocyanin in O. violaceus indicator. Secondly, through comparison among chromatograms/chromatic aberrations of NF, AF and NS, the durability of O. violaceus indicator was evaluated, and the optimal preserving strategy of the new-developed pH indicator was built. Moreover, in situ comparison was made between the spray results of phenolphthalein and anthocyanin, based on which the fact that anthocyanin acquired higher reliability over phenolphthalein in characterizing the partial carbonated zone was revealed, and circumstances under which anthocyanin was more competitive than phenolphthalein were offered accordingly. All work mentioned above was done uniquely in present study, and reliability, reproducibility as well as applicability of the new-developed anthocyanin indicator could all be evaluated based on current experimental results.Despite that, when examining the carbonation behaviour of cement-based materials, decision to replace phenolphthalein by O. violaceus indicator should be made with caution. Although O. violaceus plant is non-toxic, the formulation of O. violaceus indicator is more complex compared with that of phenolphthalein. Besides, anthocyanin can easily deteriorate, so the cost performance of anthocyanin indicator may be relatively lower considering the adoption of cryo-storage. Fortunately, O. violaceus was selected as the anthocyanin source in present study, so the nature of the plant (easy to obtain, high yield, disease resistance and non-toxicity)23,24 guaranteed both higher safety (compared to phenolphthalein) and lower cost (compared to previous work, where anthocyanin was extracted from crops or vegetables26).
As far as carbonation is concerned, it also seems unnecessary to replace phenolphthalein by anthocyanin for all scenarios: as mentioned previously, the carbonated areas recognized through phenolphthalein and anthocyanin were almost identical in quite a lot of circumstances, and only under the condition where partial carbonated zone was relatively broader (e.g., drier concretes) could phenolphthalein and anthocyanin spray exhibit a difference. Therefore, combining the consideration of cost, durability, safety and discoloration pH, phenolphthalein is still suitable in most circumstances; and only for conditions where a broad partial carbonated zone is presented or a condition where higher standard on human safety is required, the new-developed O. violaceus indicator is more competitive over phenolphthalein, as the indicator can safely plot a clearer image on the carbon footprint inside concrete structures.
Conclusion and future work
In this study, anthocyanins extracted from both fresh and stale O. violaceus petals were used as a substitute of phenolphthalein in tracing carbonation of cementitious slurries. To testify the reliability of the anthocyanin, the carbonated areas read from both fresh and stale petals were compared with those read based on pH, chemical composition (formed calcium carbonate) and porosity. Besides, the evolving pattern of local saturation degree during carbonation was revealed, based on which the reason behind the varied carbonation depths read from variant pH indicators was figured out. Main conclusions are listed below.(1) Anthocyanin in petals degraded significantly after one year of storage, but no sign of degradation was revealed from the anthocyanin extracted from fresh petals and cryo-stored for 1 year.
(2) Anthocyanin extracted from both fresh and stale petals of O. violaceus can be trusted as a substitute of phenolphthalein in tracing carbonation.
(3) The carbonation depths read from anthocyanin and phenolphthalein were at a similar magnitude. Nonetheless, the carbonation depths read from anthocyanin were larger due to its higher pH value of discoloration.
(4) For thermal-dried sample subjected to 30 d of carbonation, the partial carbonated zone was broad due to lack of water. For thermal-dried samples at later carbonation ages or for mass-balanced samples, the partial carbonation zone was narrower.
(5) Broad partial carbonated zone could lead to significant difference on the carbonation depths read from anthocyanin and phenolphthalein, and the partial zone could be read by anthocyanin.
(6) For conditions where a broad partial carbonated zone is presented or a condition where high standard on human safety is required, the new-developed O. violaceus indicator is more competitive over phenolphthalein.
As a preliminary work, this work was restricted to ordinary cementitious slurry although the effectiveness and durability of anthocyanin indicator has been validated. In order to conform to practice, concrete specimens will be cast in the future for the reliability test of the new-developed anthocyanin indicator. Such work continues in our laboratory.
Methods
High performance liquid chromatography
High performance liquid chromatography (HPLC) is an important branch of chromatography. In a high-pressure infusion system, mobile phases of different polarity, such as single solvent or mixed solvent and buffer, are pumped into a column containing stationary phase. The separated groups were sent to the detector in the column for detection, so as to achieve the analysis of samples. In this study, the technique was used to control the concentration of the anthocyanin indicator. Besides, the experimental result could also be used to evaluate the durability of the new-developed O. violaceus indicator.The HPLC used in the present study was a Shimadzu LC-20AT machine equipped with a PDA detector. Anthocyanin separations were performed on an InertSustain C18 column (4.6 × 250 mm, 5 μm) maintained at 30 °C with a flow rate at 1 mL min−1. The detection wavelength was set at 540 nm. Gradient elution was performed using acetonitrile (solvent B) and 0.1% formic acid water (solvent A), starting at 5% B, linear gradient to 100% B for over 20 minutes, then holding 100% B for 10 minutes and rebalancing the column with 5% B for 10 minutes, followed by the next analysis.
Indicator spray method
New and aged (stored under −25 °C for one year) anthocyanin indicators extracted from fresh O. violaceus petals, new anthocyanin indicator extracted from stale O. violaceus petals (stored under −80 °C for one year), and phenolphthalein, were prepared respectively for spray tests in this study. Each indicator was sprayed on the exposed cross-sectional area of the tested specimen, and the carbonated zones were read according to the chromatic aberration. By comparing the spray results of anthocyanin and phenolphthalein, the reliability of the indicator was verified, and the best preservation strategy was determined according to the spray results of different indicators.X-Ray attenuation method
X-Ray attenuation method (XRAM) was used in this study to verify and “interpret” the carbonation traced by the new anthocyanin indicator. Under constant scanning condition, each sample before and after carbonation were scanned independently. The local calcium carbonate (C![[C with combining macron]](https://www.rsc.org/images/entities/char_0043_0304.gif) , the main carbonation product) formed during carbonation can then be calculated by the change of local X-ray attenuation coefficient during dual scan,32,33 as shown in eqn (1).
, the main carbonation product) formed during carbonation can then be calculated by the change of local X-ray attenuation coefficient during dual scan,32,33 as shown in eqn (1).
 | (1) |
Being versatile, XRAM has multiple functions to provide spatial distribution of local porosity and local saturation degree. Combined with the information of local C![[C with combining macron]](https://www.rsc.org/images/entities/char_0043_0304.gif) , local porosity and local saturation degree, the carbonation traced by anthocyanin can be well interpreted. The specific steps are as follows.
, local porosity and local saturation degree, the carbonation traced by anthocyanin can be well interpreted. The specific steps are as follows.
Step I: Take a sample instantly for an X-ray scan at certain carbonation age.
Step II: Place the sample in a desiccator filled with cooled boiling water, and a 2.0 CFM vacuum pump is connected to the desiccator to drive the air out from sample pores. The process should last at least two weeks, during which the sample weight is constant.
Step III: Take the saturated sample immediately for a second-time X-ray scan.
Step IV: Transfer the sample to a vacuum oven of 45 °C, and dry the sample for another two weeks, by which time the mass of the sample reaches constancy again.
Step V: Take the dried sample for the third-time X-ray scan.
The scanning conditions remained constant, so local porosity can be read from the altered attenuation coefficient of the sample under dry and saturated states, as shown in eqn (2):
 | (2) |
Similarly, the local water content can be obtained through the altered attenuation coefficient of a local area in the original and the dried states, and the local SD can then be calculated through eqn (3):
 | (3) |
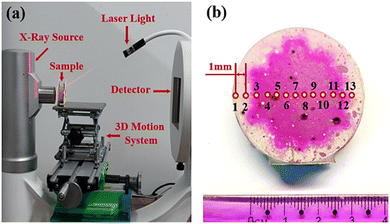
The X-ray scanner was manufactured from by Aoshi Testing Equipment Company, Guangdong, China. The operating voltage was set as 75 kV and the operating current at 0.6 mA for all X-ray scans. The filter element was a 1 mm aluminium plate. The geometrical motion was precisely controlled by a 3D motion system, and a laser light was used to match the geometric position in multiple scans [see Fig. 11(a)]. For each sample, 13 dots were selected from left to right at the same height as test points, and the horizontal distance between adjacent dots was 1 mm [see Fig. 11(b)].
Author contributions
Dong Cui: conceptualization, methodology, software, writing—original draft. Wenya Liu: conceptualization, methodology, software, writing—original draft. Jing Wang: acquisition, investigation, methodology, software. Chunping Gu: acquisition, investigation, methodology, funding. Yi Wan: conceptualization, writing—review & editing, supervision. Junsong Wang: conceptualization, writing—review & editing, supervision.Conflicts of interest
The authors declare no competing financial interest.Acknowledgements
This research was funded by the National Natural Science Foundation of China (Grant number: 52008210, 12004182), Jiangsu Province Science Foundation (Grant number: BK20200481), Zhejiang Provincial Natural Science Foundation of China (Grant number: LY22E080014), and Fundamental Research Fund for the Central Universities (Grant number: 30920021146).References
- J. N. Wang, R. Yu and W. Y. Xu, Constr. Build. Mater., 2021, 304, 124664 CrossRef CAS.
- T. M. Gao, L. Shen, M. Shen, L. T. Liu, F. N. Chen and L. Gao, Renewable Sustainable Energy Rev., 2017, 74, 522–537 CrossRef CAS.
- D. Coffetti, E. Crotti, G. Gazzaniga, M. Carrara, T. Pastore and L. Coppola, Cem. Concr. Res., 2022, 154, 106718 CrossRef CAS.
- W. Ashraf, Constr. Build. Mater., 2016, 120, 558–570 CrossRef CAS.
- V. Carević and I. Ignjatović, Constr. Build. Mater., 2019, 227, 116583 CrossRef.
- Z. G. Li and S. Li, Constr. Build. Mater., 2018, 163, 668–680 CrossRef CAS.
- Z. G. Shi, C. J. Shi and W. Shu, Cem. Concr. Res., 2018, 113, 55–64 CrossRef CAS.
- B. Lin and Y. Zuo, RSC Adv., 2019, 9(13), 7065–7077 RSC.
- S. Talukdar, N. Banthia and J. Grace, Cem. Concr. Compos., 2012, 34(8), 924–930 CrossRef CAS.
- S. Talukdar, N. Banthia, J. Grace and S. Cohen, Cem. Concr. Compos., 2012, 34(8), 931–935 CrossRef CAS.
- W. Ding, H. Yang and J. Ouyang, RSC Adv., 2015, 5(82), 67184–67194 RSC.
- S. Y. Pan, B. Lai and Y. Ren, RSC Adv., 2019, 9(53), 31052–31061 RSC.
- R. Pouhet and M. Cyr, Cem. Concr. Compos., 2016, 88, 227–235 Search PubMed.
- J. Lu, S. Ruan, Y. Liu, T. Wang, Q. Zeng and D. Yan, RSC Adv., 2022, 12(23), 14610–14620 RSC.
- J. Jiang, H. Chu, Y. Liu, D. Wang, D. Guo and W. Sun, RSC Adv., 2018, 8(30), 16626–16635 RSC.
- M. Askarian, Z. Tao, G. Adam and B. Samali, Constr. Build. Mater., 2018, 186, 330–337 CrossRef CAS.
- J. I. Choi, Y. Lee, Y. Y. Kim and B. Y. Lee, Constr. Build. Mater., 2017, 154, 451–461 CrossRef CAS.
- S. Chinchón-Payá, C. Andrade and S. Chinchón, Cem. Concr. Res., 2016, 82, 87–91 CrossRef.
- L. Conte, A. Bendini, E. Valli, P. Lucci, S. Moret, A. Maquet, F. Lacoste, P. Brereton, D. L. García-González and W. Moreda, Trends Food Sci. Technol., 2020, 105, 483–493 CrossRef CAS.
- X. Shi, Y. Yao, L. Wang, C. Zhang and I. Ahmad, Constr. Build. Mater., 2021, 304, 124389 CrossRef CAS.
- D. Yun, H. Cai, Y. Liu, L. Xiao, J. Song and J. Liu, RSC Adv., 2019, 9(53), 30905–30916 RSC.
- S. K. Mary, R. R. Koshy, J. Daniel, J. T. Koshya, L. A. Pothen and S. Thomas, RSC Adv., 2020, 10(65), 39822–39830 RSC.
- N. Zhu, H. Wu, Z. Xu, C. Liu, Y. Tian, M. Hua, Z. H. Sun, P. Li, G. Ma and X. Xu, RSC Adv., 2017, 7(66), 41495–41498 RSC.
- R. Zhao, X. Yang, A. Zhang, T. Zhou, Y. Zhou and L. Yang, Food Chem., 2022, 372, 131258 CrossRef CAS PubMed.
- Y. Yin, J. Jia, T. Wang and C. Wang, J. Cleaner Prod., 2017, 149, 673–679 CrossRef CAS.
- S. Chinchón-Payá, C. Andrade and S. Chinchón, Mater. Struct., 2020, 53(4), 1–6 CrossRef.
- P. Liu, Z. Yu and Y. Chen, Cem. Concr. Compos., 2020, 114, 103736 CrossRef CAS.
- X. H. Shen, Q. F. Liu, Z. Hu, W. Q. Jiang, X. Lin, D. Hou and P. Hao, Ocean Eng., 2019, 189, 106350 CrossRef.
- A. Castañeda-Ovando, M. Pacheco-Hernández, M. E. Páez-Hernández, J. A. Rodríguez and C. A. Galán-Vidal, Food Chem., 2009, 113(4), 859–871 CrossRef.
- K. Halász and L. Csóka, Food Packag. Shelf Life, 2018, 16, 185–193 CrossRef.
- A. Mills and G. Skinner, Analyst, 2010, 135, 1912–1917 RSC.
- A. Morandeau, M. Thiery and P. Dangla, Cem. Concr. Res., 2014, 56, 153–170 CrossRef CAS.
- D. Cui, W. Sun and N. Banthia, Cem. Concr. Compos., 2018, 88, 52–63 CrossRef CAS.
- P. Turcry, L. Oksri-Nelfia, A. Younsi and A. Aït-Mokhtar, Cem. Concr. Res., 2014, 57, 70–78 CrossRef CAS.
- P. Liu, Y. Chen and Z. Yu, Mag. Concr. Res., 2020, 72(18), 936–947 CrossRef.
- V. L. Ta, S. Bonnet, T. S. Kiesse and A. Ventura, Constr. Build. Mater., 2016, 129, 172–181 CrossRef CAS.
- A. Morandeau, M. Thiéry and P. Dangla, Cem. Concr. Res., 2015, 67, 226–236 CrossRef CAS.
- X. Pan, C. Shi, J. Zhang, L. Jia and L. Chong, Cem. Concr. Compos., 2018, 90, 218–224 CrossRef CAS.
- E. N. Matteo, B. Huet, C. F. Jové-Colón and G. W. Scherer, Cem. Concr. Res., 2018, 113, 1–12 CrossRef CAS.
- M. Mario, M. Jean-Michel, D. Cécile, B. Mohamed-Nadjib, T. Romain, L. André and B. Patrice, Cem. Concr. Compos., 2021, 139, 106280 CAS.
Footnote |
| † These authors contributed equally to this work, and they should be viewed as first authors. |
| This journal is © The Royal Society of Chemistry 2022 |

