 Open Access Article
A fluorescent aptasensor based on gold nanoparticles quenching the fluorescence of rhodamine B to detect acetamiprid
Yuyan Yu†
 a,
Shumin Ye†a,
Zhiwen Suna,
Jinkun Youa,
Weili Lib,
Yu Songa and
Hongyan Zhang
 *a
*a
aCollege of Pharmacy, Fujian University of Traditional Chinese Medicine, Fuzhou, Fujian 305122, China. E-mail: redshinezhang@163.com
bCollege of Chemistry & Environmental Engineering, Pingdingshan University, Pingdingshan, Henan 467000, China
First published on 9th December 2022
Abstract
Pesticide residue detection is one of the main safety issues in the utilization of medicinal plants. In this work, a highly selective and sensitive aptasensor for acetamiprid determination was designed. The mechanism of the proposed method is based on the fluorescence resonance energy transfer (FRET) between gold nanoparticles (AuNPs) and rhodamine B (RB). Aptamers protect AuNPs from salt-induced aggregation, which causes fluorescence quenching of RB by the AuNPs via surface energy transfer. In the absence of acetamiprid, AuNPs were coated with aptamers on the surface and dispersed in NaCl solution. At this time, the dispersed AuNPs could perfectly quench the fluorescence intensity of RB. In contrast, in the presence of acetamiprid, aptamers specifically combine with acetamiprid to form a complex. With a high salt concentration, AuNPs would be aggregated without aptamer protection, weakening the RB quenching effect. Therefore, the concentration of acetamiprid could be obtained from the change in fluorescence intensity in the system. A fluorescent sensing method was established with a linear range from 0.1 to 3 μg mL−1, and the LOD was 0.0285 μg mL−1. The recoveries of acetamiprid in traditional Chinese medicine (TCM) samples were 96.23–105.75%. This method has great application value for the detection of acetamiprid in a complex sample matrix.
1. Introduction
Acetamiprid is a widely used and representative chloronicotinyl insecticide, which acts on the acetylcholine receptor of the postsynaptic membrane of nerve cells. It can interfere with the stimulus transmission of the insect nervous system, causing blockage of the nervous system pathway, resulting in paralysis and eventual death of the insect.1 Owing to the characteristics of its wide insecticidal spectrum, low dosage, high activity, and long-lasting effect, it has been considered an excellent substitute for urethane and synthetic pyrethroid pesticides, which were sufficiently reliable for some sucking and stinging injurious insects.2 However, its extensive use would cause environmental pollution, which might accumulate on the soil surface. Numerous studies have demonstrated that it is a source of contamination for air and groundwater.3 In addition, a negative effect of acetamiprid is its toxicity to mammals.4 It has been proved that acetamiprid has a variety of biological activities, including reproductive system toxicity, embryotoxicity, neurotoxicity, and genetic toxicity.5 The incidence of acetamiprid-related diseases is increasing, which has caused great concern. Hence, because of the potential threat of this pesticide to humans, various countries have established strict regulations and detection methods to limit the level of acetamiprid in the environment.6Currently, several analytical methods have been constructed for the quantitative detection of acetamiprid.7 Instrumental analysis methods, including high-performance liquid chromatography (HPLC),8 gas chromatography (GC),9 gas chromatography-mass spectrometry (GC-MS),10 dispersive liquid–liquid microextraction-HPLC (DLLME-HPLC),11 ultra-performance liquid chromatography-tandem mass spectrometry (UPLC-MS/MS),12 and capillary chromatography,13 are widely accepted for their accuracy, sensitivity, and low detection limit. However, the above-mentioned techniques require expensive equipment, use large amounts of organic solvents, are costly and time consuming, and cannot be applied for on-site rapid detection. With the development of analytical technology, many new methods have emerged for acetamiprid detection. Immunoassay analysis methods held the potential for high-throughput screening with good selectivity, but they often suffered from the possibility of false-positive screening results and the matrix effect.14 Moreover, using electrochemical analysis, an aptasensor based on the resonance energy transform system was designed to improve the selectivity and sensitivity of acetamiprid detection.15 Most of these detection methods focused on food, water, and soil tests, but were rarely used in plants.
TCM plays a very important role in the Chinese medical system and has been used worldwide. At present, most Chinese medicines in use are cultivated artificially. TCM crops depend widely on the use of pesticides in planting to protect them from pests and diseases and ensure quality and yield.16,17 However, the excessive or incorrect use of these chemicals and pesticide residues may cause environmental pollution and affect the health of consumers.18,19 The safety of TCM has been the focus of international attention for a long time.20 Many organizations, such as the Food and Agriculture Organization (FAO) and the European Union (EU), have set maximum residue limits for these chemicals in TCM and related products.21–23 However, the detection of acetamiprid residues in TCM remains challenging due to the matrix effect. Thus, according to actual field operation, there is a high requirement in TCM safety and planting environmental monitoring to establish a rapid and sensitive sensing platform for acetamiprid detection. Therefore, there is a need to develop a sensitive, accurate, and cost-effective analytical method to quantify the level of acetamiprid in the complex matrix.
With the wide application of nanomaterials, nano-probes have become a powerful tool for rapid detection.24 Metal nanomaterials, especially gold nanoparticles (AuNPs), have been widely used as colorimetric sensors for small organic molecules, metal ions, and proteins due to their special optical and electrical properties.25 Yao et al. demonstrated a sensitive method for detecting heavy metal ions using AuNP surface-enhanced laser-induced breakdown spectroscopy.26 The detection of heavy metal ions of Cu, Pb, and Cr was achieved with LODs of 5 ng mL−1, 22 ng mL−1, and 9 ng mL−1. Bi and his co-worker composited AuNPs/single-walled carbon nanohorn (SWCNH) nanocomposites for non-enzymatic glucose detection. Using AuNP-based decoration of SWCNHs, they were synthesized and modified on a gold electrode to enhance the specificity and sensitivity. This showed great potential for use in non-enzymatic glucose detection.27 Zhang et al. used DNA-functionalized gold nanoparticles to construct a test strip for the visual detection of telomerase activity and determination of cancerous cells. It was rapidly able to achieve the visual differentiation of cancerous cells. Chemists have attached different chemicals and biomolecules onto the surface of AuNPs to functionalize them, such as small molecules, polymers, and biomacromolecules. In particular, using biomacromolecules can enhance the specificity and sensitivity.28 An aptamer shows ultrasensitive and selective detection, which uses fluorescent upconversion nanoparticles and DNA-functionalized gold nanoparticles.29 In addition, AuNPs, as a super quencher, could be used to quench the fluorescence of fluorescent molecules by FRET. Rhodamine B (RB) is a widely used synthetic dye with strong fluorescence, water solubility and light stability. It has been found that RB could be adsorbed on the AuNP surface by electrostatic interaction.30 The fluorescence of RB could be quenched by dispersed AuNPs, while the fluorescence quenching ability of aggregated AuNPs is greatly weakened.31 Therefore, the degree of aggregation of AuNPs can be determined by measuring the fluorescence intensity of the system. The sensitivity of analyte detection was related to AuNP enlargement coupled with the quenching of fluorescent dyes.32 In recent years, several studies have shown that fluorescent aptasensors based on FRET have emerged as one of the great potential techniques in biological and chemical analysis.33
In this study, we design an assay method for a highly sensitive and selective turn-on fluorescent sensor to detect acetamiprid in TCM based on a specific acetamiprid aptamer, AuNPs, NaCl and RB. NaCl induces colorimetric aptamer-based detection and RB is used as a signal amplifier.34 The aptamer, which is a component used to identify a target, binds to the surface of AuNPs to protect them from salt-induced aggregation. The assay offered a possible method for rapid and reliable analysis, which was conducive to detecting acetamiprid in TCM samples.
2. Experimental
2.1 Reagents
The chemicals were of analytical grade. Ultrapure water was used throughout the experiments. The sequence of the acetamiprid-specific aptamer is 5′-CTG ACA CCA TAT TAT GAA GA-3′(20-mer), which was synthesized by Sangon Biotechnology Inc. (Shanghai, China). HAuCl4·3H2O, rhodamine B, acetamiprid, chlorpyrifos, and atrazine were obtained from Aladdin Co., Ltd (Shanghai, China). Glyphosate, indoxacarb, trichlorfon, and phoxim were bought from Tanmo Quality Inspection Technology Co., Ltd (Beijing, China). The purity of glyphosate, indoxacarb, trichlorfon, phoxim, acetamiprid, chlorpyrifos, and atrazin were ≥98%. Trisodium citrate dihydrate (C6H5Na3O7·2H2O) was obtained from Sinopharm Chemical Reagent Co., Ltd (Shanghai, China). Sodium chloride (NaCl) was purchased from Xilong Science Co., Ltd (Shantou, China). Chinese medicine samples were purchased from Zhicheng Medical Store in Shangjie, Minhou County, and the medicines were identified by Professor Chengzi Yang from Fujian University of Traditional Chinese Medicine.2.2 Apparatus
The 96-well microplates were purchased from Sangon Biotechnology Inc. (Shanghai, China). An Infinite M200 Pro microplate spectrophotometer (Tecan, Austria) was used for measuring absorbance and fluorescence intensity, with an excitation wavelength of 518 nm. A transmission electron microscope (TEM) H-7650 (Hitachi, Japan) was employed to observe the morphology of the gold nanoparticles. A laser particle size analyzer Nicomp 380ZLS (PSS, America) was utilized to analyze the particle size of the gold nanoparticles. A biochemical incubator (Jinghong, China) was used to keep the incubating temperatures at 25 °C. An ultra-micro spectrophotometer was used to measure the UV intensity of the aptamer.2.3 Synthesis and characterization of AuNPs
AuNPs were prepared according to the method of trisodium citrate reduction reported in the literature with a slight modification.35 First, glassware pre-soaked in aqua regia was used in the experiment and rinsed thoroughly in a quantity of ultrapure water, and air-dried. Then, 5 mL of 38.8 mM trisodium citrate was quickly added to 50 mL of 1 mM HAuCl4·3H2O boiling solution, with strong stirring for 30 min. The color of the solution was observed, changing from colorless to grayish blue, deep purple and at long last to wine red. Then, heating was stopped, stirring was continued for 30 min, and the solution cool was allowed to room temperature. Finally, the resulting solution was filtered with a 0.22 μm ultrafiltration membrane and then stored at 4 °C in a fridge until use. The size and shape of AuNPs were characterized by TEM.2.4 Characterization of the reaction system
A small amount of AuNPs was absorbed into the centrifuge tube and the color of the AuNPs was observed. 150 μL of AuNPs was placed on a 96-well transparent plate. The UV-Vis absorption spectrum of the AuNPs was scanned with a microplate spectrophotometer and the maximum absorption wavelength was recorded.An appropriate amount of RB was taken into the black microplate, the fluorescence excitation wavelength was set at 510 nm, and the fluorescence emission wavelength in the range of 540–650 nm was scanned.
An ultra-micro spectrophotometer was used to characterize the UV spectra in different circumstances: sample (a) containing 10 μM aptamer was tested directly. Sample (b) included 10 μM aptamer and 250 ng mL−1 acetamiprid, and was incubated for 30 min before being tested.
TEM was used to characterize the particle size and obtain the morphological changes of AuNPs in each state: (a) 100 μL AuNPs; (b) 100 mL AuNPs + 20 μL aptamer + 20 μL 1 μg mL−1 acetamiprid + 20 μL NaCl; (c) 100 mL AuNPs + 20 μL aptamer + 20 μL 5 μg mL−1 acetamiprid + 20 μL NaCl. Sample (a) was directly tested. Besides, samples (b) and (c) were tested after 30 min incubation between aptamer and acetamiprid.
2.5 Analytical procedure
All reactions were carried out at 25 °C. The detailed analysis of acetamiprid could be performed as follows. Firstly, 20 μL of 400 nM aptamer was mixed with 100 μL of AuNP solution for 9 min to ensure adequate interaction between acetamiprid and aptamer. Secondly, 20 μL of acetamiprid of different concentrations was added and incubated for 10 min in mixed solution. Then, 20 μL of NaCl was rapidly mixed into the blend and interacted for 5 min. Finally, 20 μL of RB was mixed with the above solution. A blank experiment was performed with ultrapure water instead of acetamiprid. The fluorescent intensities of the mixed solution in the experimental group (F) and blank group (F0) were recorded and the values of ΔF (ΔF = F − F0) were calculated. The excitation and emission wavelengths were 510 nm and 582 nm, respectively, and the calibration curve was established from ΔF versus the concentration of acetamiprid.2.6 Optimization of experimental conditions
Aptamer and acetamiprid were replaced by ultrapure water to optimize the concentration of NaCl. 40 μL of ultrapure water was mixed with 100 μL of AuNPs, and then volumes of original NaCl solutions (100, 150, 200, 250, 300, 350, 400 mM) were added into the mixture. After a period of reaction, 20 μL of RB was added, and the values of ΔF were calculated. When AuNPs were completely aggregated, ΔF could reach its maximum value. Hence, the optimal concentration of NaCl was determined from the highest ΔF.The influence of different aptamer concentrations on the system was studied, and a suitable aptamer concentration was selected. The specific operation was as follows: 100 μL of AuNPs was added to 20 μL of different concentrations of aptamer (100, 200, 300, 400, 500, 600, 700 nM), and then incubated for 10 min. In the blank test, acetamiprid was treated with the same volume of ultrapure water. Then, the optimum level of NaCl was added into the reaction system and mixed well. After incubating for 5 min, the values of ΔF were obtained. The aptamer concentration with a minimum of ΔF was selected as the optimization of aptamer concentration.
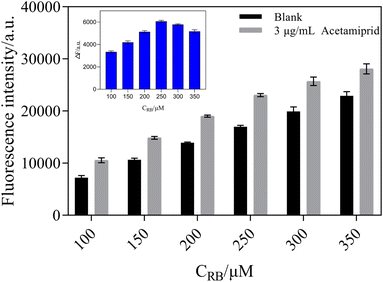
To study the effect of RB concentration on the system, the fluorescence intensities of the sensing system were compared with and without acetamiprid. Firstly, 20 μL of an optimal concentration of aptamer was mixed with 100 μL of AuNPs. After incubating for 9 min, 20 μL of acetamiprid (3 μg mL−1) was added into the mixed system and cultured for another 10 min. Secondly, the optimal concentration of NaCl was added and reacted for 5 min. Afterwards, 20 μL of different concentrations of RB (100, 150, 200, 250, 300, 350 μM) were mixed with the system. The blank experiments substituted ultrapure water for acetamiprid. Finally, the fluorescence intensity value of the blank groups and experimental groups were obtained, and the maximum ΔF value was chosen as the optimal concentration.
The degree of agglomeration of AuNPs has been directly correlated with NaCl, which can be represented by the ratio of absorbance at 650 and 520 nm. To optimize the reaction time of AuNPs with NaCl, the aptamer and acetamiprid were replaced with ultrapure water, and 100 mL of AuNPs was mixed with 40 μL of ultrapure water. Next, 20 μL of an optimal concentration of NaCl solution was added into the system and blended thoroughly. After interacting for 1, 2, 3, 4, 5, 6, 7 min, the absorbances at 650 and 520 nm were measured. Finally, the reaction time that resulted in a maximum absorbance ratio (A650/A520) was chosen as the optimal incubation time.
When optimizing the action time of aptamer and acetamiprid, 20 μL of the optimal concentration of the aptamer and 100 μL of AuNPs were mixed well and interacted for 1, 5, 10, 15, 20 min. Then, 20 μL of acetamiprid solution was added. After incubating for a moment, 20 μL of NaCl was added into the solution. After the reaction was complete, 20 μL of RB solution was mixed thoroughly into the system. Finally, the fluorescence intensity was determined and the action time that resulted in a minimum value was chosen.
To optimize the binding time of aptamer with acetamiprid, the optimal concentrations of 20 μL of aptamer and 100 μL of AuNPs were mixed evenly and incubated for a while; then, 20 μL of acetamiprid was added and the set-up incubated for 1, 5, 10, 15, and 20 min. Then, NaCl and RB were added into the sensing system as described above. Finally, the maximum fluorescence intensity of the detection system was obtained as the ideal binding time.
2.7 Sensitivity and selectivity of the sensor system
An essential next step is to investigate the selectivity and selectivity of the sensor system to evaluate the responsivity of the fluorescence aptasensor. To study the sensitivity of the sensing system, the aptamers, AuNPs, and acetamiprid solutions of different concentrations (0, 0.1, 0.5, 1.0, 1.5, 2.0, 2.5, 3.0, 4.0, 5.0 μg mL−1), NaCl, RB were mixed and incubated, and the same optimization procedure performed as before. The fluorescence intensities F0 and F of the blank group and the experimental group, respectively, were measured, and ΔF values were calculated.In order to verify the selectivity of the reaction system and to exclude the effect of metal ions, a few frequently-used pesticides and metal ions were chosen for the experiments, including chlorpyrifos, atrazine, glyphosate, indoxacarb, trichlorfon, phoxim, Al3+, Co+, K+, Ca2+, Mg+, which were added into the sensing system substituting for acetamiprid under optimized conditions. The ultimate concentrations of all pesticides in the experiment were 10 μg mL−1, the concentrations of metal ions were 30 μg mL−1, and the values ΔF of acetamiprid and other various pesticides were obtained.
2.8 Determination of acetamiprid in real samples
To prove the feasibility and practicability of this method, Chinese medicine samples were chosen for the determination of acetamiprid residue in commercial TCM. Yam and Radix pseudostellariae were singled out as the experimental samples. The samples were purchased at a local pharmacy and analyzed using an ELISA kit to test and verify the absence of acetamiprid. These two samples were crushed and homogenized into powder and sieved through a No. 20 mesh sieve (850 μm aperture). 50 mL of methanol was added into the sample, soaked for 30 min, then after filtering (0.22 μm), the solutions were introduced to a certain amount of acetamiprid and analyzed by the above test method.3. Results and discussion
3.1 Detection mechanism of the sensing system for acetamiprid
The basic mechanism of this sensor is shown in Scheme 1. At the beginning of the experiment, AuNPs were uniformly dispersed in the solution due to the repulsion of surface charge. RB was adsorbed on the AuNPs by electrostatic interaction. Then, the distance between the AuNPs and RB particles was reduced. The fluorescence of RB was quenched by the AuNPs as a result of resonance energy transfer between the two. In this system, a high concentration of NaCl would destroy the double electric layer structure on the surface of the AuNPs, causing the conglomeration of AuNPs and reducing the fluorescence quenching of RB.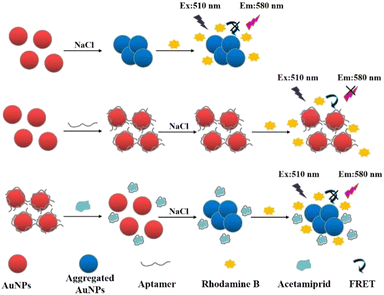 | ||
| Scheme 1 Schematic illustration of the fluorescence sensing method for acetamiprid detection based on fluorescence resonance energy transfer between AuNPs and RB. | ||
When the surface of the AuNPs was modified with aptamer, the AuNPs did not agglomerate under the induction of a high NaCl concentration, and owing to the protection of the aptamer, the AuNPs could maintain the fluorescence quenching of RB. The aptamer would specifically combine with acetamiprid in the presence of acetamiprid, forming a stable complex that would fall off the surface of the AuNPs. Thus, the AuNPs without aptamer protection gathered together at a high concentration of NaCl, so the fluorescence quenching of RB was weakened and the fluorescence value of the solution increased. A fluorescence sensing assay for the detection of acetamiprid was established based on the relationship between the concentration of acetamiprid and the degree of AuNP aggregation, which impacted the fluorescent intensity of RB.
3.2 Characterization of AuNPs and aptamer
According to the principle of detection, the structure of the aptamer would change after binding to the target substance and then the change could be monitored by UV-vis absorption. As shown in Fig. 1, the UV absorption of the aptamer at 260 nm was significantly reduced after acetamiprid was added into the aptamer. It was speculated that the weakened UV absorption may be due to the specific binding of acetamiprid to the aptamer, resulting in folding of the aptamer. Due to UV absorption of the aptamer at 260 nm being attributed to the π–π conjugation overlying nucleic acid bases, the overlying of the aptamer makes the nucleobase of the aptamer more efficient, thereby limiting the electronic transition.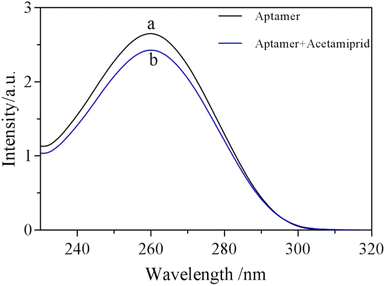 | ||
| Fig. 1 UV-absorption of aptamer solution treated with acetamiprid. Experimental conditions: (a) 10 μM aptamer, (b) 10 μM aptamer + 250 ng mL−1 acetamiprid. | ||
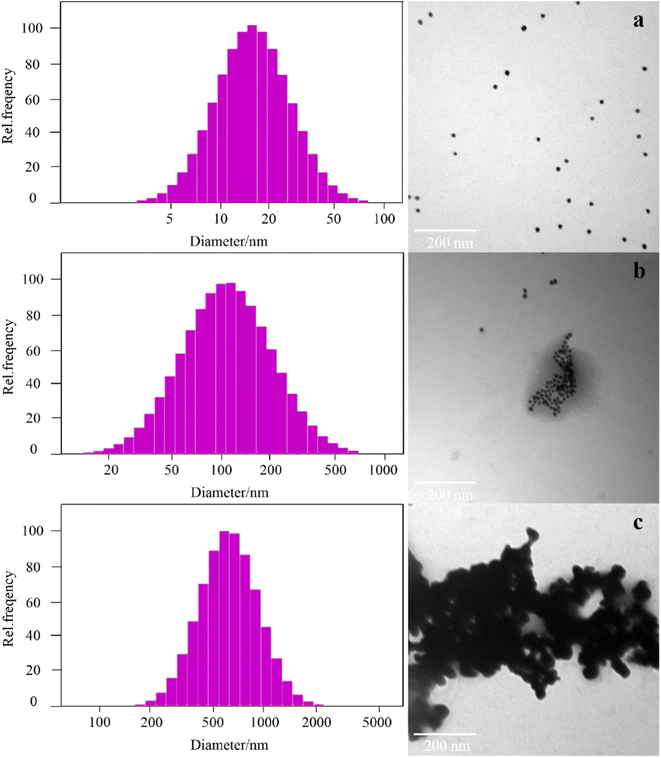
To further confirm the principle of the experiment, a laser particle size analyzer and TEM were selected to examine the size and topography change of the nanoparticles under different conditions. The average particle size of the AuNPs was 15.2 ± 1.0 nm, and they were spherical and uniformly dispersed in solution (Fig. 2a). The AuNPs were encapsulated due to the interaction between aptamers and AuNPs. When acetamiprid was added into the system, acetamiprid would specifically combine with the aptamer, resulting in some of the AuNPs being aggregated (Fig. 2b), and the average diameter of the particles increased to 126.8 ± 2.0 nm. The release of AuNPs increased with an increase in acetamiprid concentration. A large number of particles were aggregated completely to form clusters, and the average size of the particles increased to 644.3 nm (Fig. 2c). The feasibility of this experiment demonstrated that AuNP aggregation may be controlled.
3.3 FRET on the system of AuNPs and RB
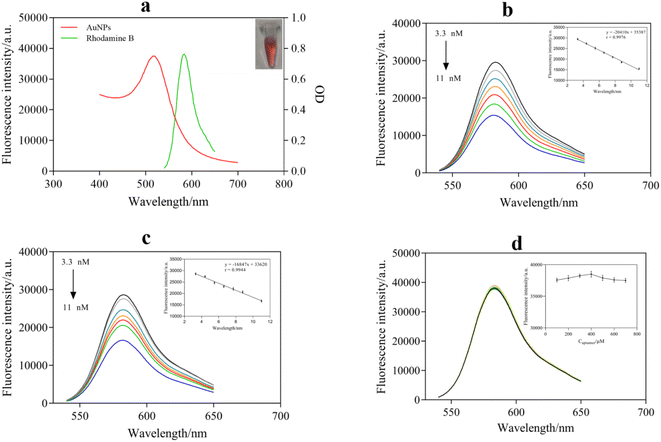
The UV-absorption spectra of the AuNPs and the fluorescence emission spectrum of RB are shown in Fig. 3a. It can be seen that the characteristic absorption peak of the AuNPs was at 520 nm and a strong fluorescence emission peak of RB was located at 582 nm. The zeta potential values of the rhodamine B aqueous solution and the AuNP aqueous solution measured by PSS were 37.70 mV and −40.15 mV, respectively. Thus, RB could be adsorbed onto the surface of the AuNPs. In addition, there was a clear overlap between the absorption spectrum of the AuNPs and the emission spectrum of RB. The above results indicated that there was FRET between AuNPs and RB, which suggested that FRET may occur with RB as the donor and AuNPs as the receptor. Hence, the fluorescence intensity of RB could be significantly reduced or even completely quenched when RB and AuNPs exist together.To further research the fluorescence quenching effect of AuNPs on RB, the fluorescence intensity of RB in the presence of different concentrations of AuNPs was measured. The results are shown in Fig. 3b: as the concentration of AuNPs increased from 3.3 nM to 11 nM, the fluorescence intensity of RB decreased gradually. The fluorescence intensity has a good linear relationship with the concentration of AuNPs, and the linear equation was y = −20410x + 35![[thin space (1/6-em)]](https://www.rsc.org/images/entities/char_2009.gif) 387, r = 0.9976. In addition, when the surface of the AuNPs was modified with the aptamer, the aptamer-AuNPs still showed the same quenching effect. As shown in Fig. 3c, aptamer-AuNPs similarly effectively inhibited the fluorescence of RB, and a linear relationship was also established between the fluorescence intensity and the concentration of aptamer-AuNPs. In combination with the results of Fig. 3b–d, this could signify that the aptamer had no interaction with RB and no influence on the fluorescence. Meanwhile, it was concluded that the fluorescence quenching effect of AuNPs on RB was hindered by the aptamer coating on the surface of the AuNPs.
387, r = 0.9976. In addition, when the surface of the AuNPs was modified with the aptamer, the aptamer-AuNPs still showed the same quenching effect. As shown in Fig. 3c, aptamer-AuNPs similarly effectively inhibited the fluorescence of RB, and a linear relationship was also established between the fluorescence intensity and the concentration of aptamer-AuNPs. In combination with the results of Fig. 3b–d, this could signify that the aptamer had no interaction with RB and no influence on the fluorescence. Meanwhile, it was concluded that the fluorescence quenching effect of AuNPs on RB was hindered by the aptamer coating on the surface of the AuNPs.
3.4 The spectral responses of the fluorescence sensing system
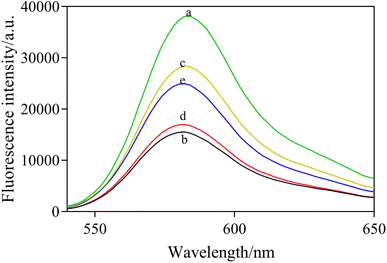
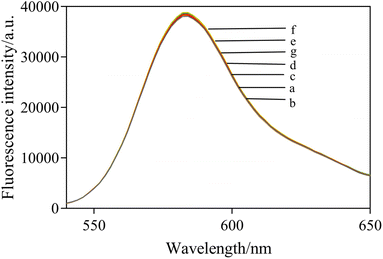
To further verify the mechanism and feasibility of this experiment, the fluorescence spectral response under different compositions was studied. In Fig. 4, RB shows a maximum fluorescence emission peak at 582 nm (curve a). After mixing AuNPs with RB, the fluorescence of RB was quenched observably by FRET (curve b). When NaCl was added into the solution, the fluorescence intensity of the system was obviously enhanced as a result of the aggregation of AuNPs induced by NaCl, which reduced the fluorescence quenching of RB (curve c). In the presence of the aptamer, AuNPs retained dispersity and fluorescence quenching ability at a high salt concentration (curve d). However, the fluorescence quenching by AuNPs was significantly increased in the presence of acetamiprid when acetamiprid was introduced (curve e). In addition, the fluorescence spectra of different mixed solutions were characterized. The results are shown in Fig. 5, which demonstrated that the presence of NaCl, aptamer, and acetamiprid would not affect the fluorescence emission of RB. The specific interaction of aptamer and acetamiprid was related to the accumulation of AuNPs, affecting the FRET between RB and AuNPs, leading to changes in the fluorescence intensity of the sensor system.3.5 Optimization of detection conditions
NaCl could destroy the electric double layer structure on the surface of AuNPs, resulting in the accumulation of AuNPs. Therefore, the appropriate concentration of NaCl played a significant role in the stabilization and sensitivity of AuNPs. According to Fig. 6a, with an increase in NaCl concentration, the aggregation amount of AuNPs increased, leading to a continuous increase in the fluorescence intensity of the system. When the concentration of NaCl reached 300 mM, AuNPs were completely aggregated, and the fluorescence intensity of the reaction system tended to be stable. Therefore, the optimal NaCl concentration for the sufficient aggregation of AuNPs was selected as 300 mM.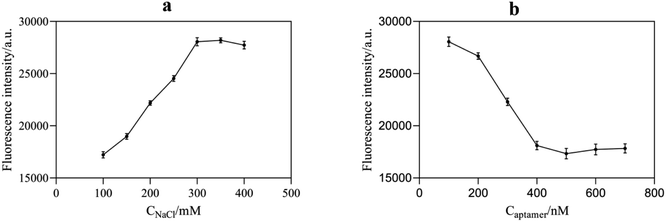 | ||
| Fig. 6 (a) Effect of NaCl concentration on the fluorescence intensity of the system; (b) effect of aptamer concentration on the fluorescence intensity of the system. | ||
The amount of aptamer used has a significant impact on the performance of this fluorescence aptasensor. The aptamer content might inhibit AuNPs from aggregating as well as forming compounds with acetamiprid. In Fig. 6b, the aggregation of AuNPs reduced gradually with an increase in aptamer concentration due to its protective effect, resulting in an enhancement of the RB quenching effect. The fluorescence intensity no longer decreased significantly until the aptamer concentration was higher than 400 nM. Considering that too much aptamer would reduce the sensitivity of the assay, 400 nM was considered the optimal aptamer concentration.
The fluorescence intensity of RB was measured in the presence and absence of 3 μg mL−1 of acetamiprid. In Fig. 7, with an increase in the concentration of RB, the fluorescence intensity of the blank groups and the test groups gradually increased. On the other hand, ΔF first showed a rising trend and then decreased. The concentration of RB reached 250 μM; meanwhile, ΔF reached its maximum. Therefore, 250 μM of RB was used for further analysis in order to obtain a significant fluorescence signal from the sensing system.
The appropriate reaction time is of great significance to ensure the accuracy of the sensing assay. Thus, the following optimizations were performed, aggregation time of AuNPs induced by NaCl (Fig. 8a), binding time of aptamer with AuNPs (Fig. 8b), and binding time of acetamiprid with aptamer (Fig. 8c). Fig. 8a reveals that AuNPs were fully aggregated after 5 min; therefore, the optimal time was 5 min. As shown in Fig. 8b and c, the optimum binding times of the aptamer with the AuNPs and acetamiprid with the aptamer were chosen as 9 and 10 min, respectively.
3.6 Sensitivity of the sensing system
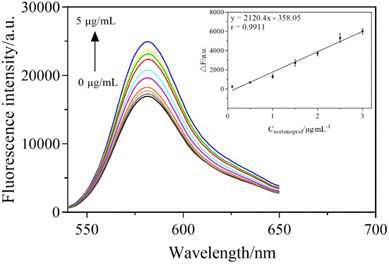
Acetamiprid solutions with different concentrations (0.1, 0.5, 1.0, 1.5, 2, 2.5, 3.0, 4.0, 5.0 μg mL−1) were mixed into the sensor system and the fluorescence signals were measured under the optimal conditions. In Fig. 9, with the increase in acetamiprid concentration, the fluorescence intensity of the sensing system constantly increased. As depicted in the inset, a good linear relationship was shown within the range of 1–180 nM, where the linear curve between the increased fluorescence intensity (ΔF) and the concentration of acetamiprid was ΔF = 2120.4C − 358.05, with a correlation coefficient of 0.9911. The limit of detection (LOD) was obtained by multiplying the slope of the linear calibration plot by 3 times the standard deviation of the instrument (σ). Therefore, the LOD of the aptasensor was obtained as 3σ/s = 0.0285 μg mL−1, which has higher sensitivity than traditional methods.3.7 Selectivity of the sensing system
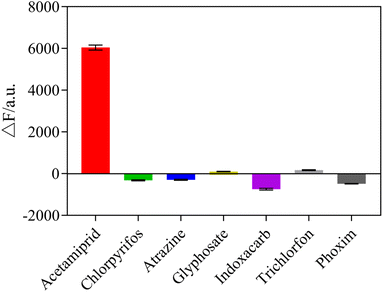
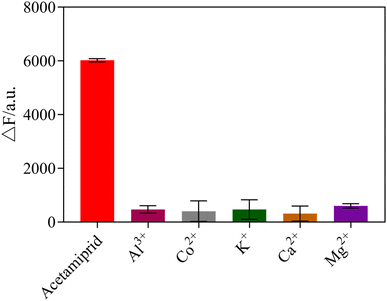
To explore the selectivity of the sensing system towards acetamiprid over other pesticides, six possible interfering pesticides (chlorpyrifos, atrazine, glyphosate, indoxacarb, trichlorfon, phoxim) and metal ions (Al3+, Co+, K+, Ca2+, Mg+), were individually mixed into the sensor system to determine the selectivity of the fluorescent sensor. The results showed that acetamiprid caused the most noticeable rise in fluorescence intensity, whereas other pesticides and metal ions had no substantial impact, as shown in Fig. 10 and 11. Due to the other pesticides and metal ions having very little affinity with the acetamiprid aptamer, the aptamer on AuNPs could not be separated, so the AuNPs could not be induced to aggregate by NaCl, having little influence on detection. Therefore, this sensing system shows good selectivity towards acetamiprid among other pesticides.3.8 Detection of acetamiprid in Chinese medicine samples
To evaluate the practicability of the sensor system in application, the described assay was applied for the analysis of acetamiprid in a Chinese medicine sample. The actual samples were chosen to confirm the test with an ELISA kit. The results showed that no acetamiprid was detected in any sample. Before the pretreatment, known quantities of acetamiprid were added into the samples to achieve the desired concentration for the recovery trials. As shown in the results shown in Table 1, the obtained recoveries and the relative standard deviations ranged from 96.23 to 105.75% and 3.1 to 5.6%, respectively. The satisfactory results indicated that the proposed detection strategy had great applicability.| Sample | Add (μg mL−1) | Mean found (μg mL−1) | Recovery (%) | RSD (%) |
|---|---|---|---|---|
| Yam | 0.50 | 0.49 ± 0.025 | 98.86 | 5.0 |
| 1.50 | 1.62 ± 0.057 | 107.97 | 3.5 | |
| 2.50 | 2.41 ± 0.096 | 96.44 | 4.0 | |
| 0.50 | 0.52 ± 0.020 | 103.7 | 3.7 | |
| Radix pseudostellariae | 1.50 | 1.60 ± 0.052 | 106.7 | 3.3 |
| 2.50 | 2.53 ± 0.029 | 101.1 | 1.1 |
4. Conclusion
A novel fluorescence sensing platform for acetamiprid detection was constructed on the basis of the quenching effect of AuNPs on RB fluorescence. In this sensor, the binding reaction of aptamer and acetamiprid was applied to tune the degree of aggregation of the AuNPs. Meanwhile, the fluorescence intensity of RB was related to the degree of accumulation of AuNPs, which depended on the concentration of acetamiprid. After optimizing the experimental conditions, the developed method could realize the sensitive detection of acetamiprid with a detection limit of 0.0285 μg mL−1 and satisfactory recovery in spiked samples. This novel strategy of fluorescence quenching coupled with an aptamer and FRET would provide a new horizon for the development of highly sensitive optical biosensors. In summary, this is a potential analytical method for the simple, low-cost, and highly sensitive analysis of acetamiprid residues in TCM.Conflicts of interest
The authors declare no conflict of interest regarding the publication of this paper.Author contributions
Yuyan Yu: writing, conceptualization, methodology. Shumin Ye: synthesize study data, writing – presentation of the published work. Zhiwen Sun: data presentation and validation. Jinkun You: writing – original draft preparation. Weili Li: resources. Yu Song: investigation. Hongyan Zhang (corresponding author): supervision, reviewing, editing.Acknowledgements
This work was financially supported by the National Natural Science Foundation of China (81703695), the Science and Technology Project of Fujian Province (2021J01921, 2022J01359). Transmission electron microscope and Ultra-micro spectrophotometer tests were completed in Fujian Key Laboratory of Chinese Materia Medica, Fujian University Key Laboratory for Research and Development of TCM Resources.References
- M. Shamsi, M. Soodi, S. Shahbazi and A. Omidi, Environ. Sci. Pollut. Res., 2021, 28(22), 27933–27941 CrossRef CAS PubMed.
- G. Wang, W. Yue, Y. Liu, F. Li, M. Xiong and H. Zhang, Bioresour. Technol., 2013, 138, 359–368 CrossRef CAS PubMed.
- S. Gupta and V. T. Gajbhiye, Bull. Environ. Contam. Toxicol., 2007, 78, 349–352 Search PubMed.
- D. Sanyal, D. Chakma and S. Alam, Bull. Environ. Contam. Toxicol., 2008, 81, 365–368 Search PubMed.
- Y. Tian, Y. Wang, Z. Sheng, T. Li and X. Li, Anal. Biochem., 2016, 513, 87–92 CrossRef CAS PubMed.
- Ministry of Agriculture of the People's Republic of China, National food safety standard-maximum residue limits for pesticides in food (GB 2763-2016), 2016 Search PubMed.
- J. Xiao, X. Xu, F. Wang, J. Ma, M. Liao, Y. Shi, Q. Fang and H. Cao, J. Hazard Mater., 2019, 365, 857–867 CrossRef CAS PubMed.
- J. Vichapong, R. Burakham and S. Srijaranai, Talanta, 2013, 117, 221–228 Search PubMed.
- B. Zhang, X. Pan, L. Venne, S. Dunnum, S. T. McMurry, G. P. Cobb and T. A. Anderson, Talanta, 2008, 75(4), 1055–1060 Search PubMed.
- S. Mohapatra, L. Siddamallaiah and N. Y. Matadha, Environ. Sci. Pollut. Res., 2021, 28(22), 27481–27492 Search PubMed.
- J. Tursen, T. Yang, L. Bai, D. Q. Li and R. K. Tan, Environ. Sci. Pollut. Res., 2021, 28(36), 50867–50877 CrossRef CAS PubMed.
- X. Y. Pang, C. Y. Li and C. J. Zang, Environ. Sci. Pollut. Res., 2022, 29(15), 21826–21838 CrossRef CAS PubMed.
- L. Carbonell-Rozas, F. J. Lara, M. D. O. Iruela and A. M. García-Campaña, Anal. Bioanal. Chem., 2020, 412(24), 6231–6240 Search PubMed.
- Q. K. Fang, Q. Zu and X. D. Hua, et al., Molecules, 2019, 24(7), 1265 CrossRef CAS PubMed.
- J. X. Li, D. Jiang, X. L. Shan, W. C. Wang, G. F. Ou, H. Z. Jin and Z. D. Chen, Mikrochim. Acta, 2021, 188(2), 44 CrossRef CAS PubMed.
- H. He, F. Gao, Y. Zhang, P. Du, W. Feng and X. Zheng, Food Addit. Contam., Part A, 2020, 37, 1156–1164 CrossRef CAS PubMed.
- T. Wu, P. P. Qi, J. Wang, S. S. Di, H. Xu, H. Y. Zhao, C. S. Zhao and X. Q. Wang, RSC Adv., 2021, 11(7), 4129–4137 RSC.
- L. Bondareva and N. Fedorova, Molecules, 2021, 26(17), 5370 Search PubMed.
- H. X. Wang, D. J. Yang, H. J. Fang, M. H. Han, C. X. Tang, J. G. Wu, Y. Chen and Q. W. Jiang, Environ. Int., 2020, 143, 105918 CrossRef CAS PubMed.
- L. Luo, L. L. Dong, M. Z. Li, Y. C. Liang, G. F. Wei, Y. Y. Zhang, Z. Z. Qian and S. L. Chen, Zhongguo Zhong Yao Za Zhi, 2019, 44(11), 2197–2207 Search PubMed.
- Á. Ambrus and Y. Z. Yang, J. Agric. Food Chem., 2016, 64(1), 30–35 Search PubMed.
- European Food Safety Authority (EFSA), EFSA J., 2019, 17(6), e05743 Search PubMed.
- Chinese Pharmacopoeia Commission, Pharmacopoeia of the People's Republic of China (Ch. P.), 2020, pp. 239–242 Search PubMed.
- Y. M. Sun, T. Qi, Y. Jin, L. Liang 1 and J. L. Zhao, RSC Adv., 2021, 11(17), 10054–10060 RSC.
- S. Ali, X. Chen, W. Shi, G. Z. Huang, L. M. Yuan, L. W. Meng, S. L. Chen, Z. H. Xie and X. J. Chen, Crit. Rev. Anal. Chem., 2021, 12, 1–33 Search PubMed.
- Y. Q. Yao, F. He and Q. Y. Lin, J. Anal. At. Spectrom., 2021, 36, 2639–2648 Search PubMed.
- C. Bi, H. W. Lv and H. L. Peng, J. Mater. Sci.: Mater. Electron., 2021, 32, 12705–12715 CrossRef CAS.
- R. X. Zhang, W. J. Chen and W. Jiang, Chinese J. Anal. Chem., 2021, 49, 702–709 CAS.
- Y. Q. Yao, F. He and Q. Y. Lin, J. Anal. At. Spectrom., 2021, 36, 2639–2648 RSC.
- Z. Saberi, B. Rezaei and A. A. Ensafi, Microchim. Acta, 2019, 186(5), 273 Search PubMed.
- Z. Y. Yan, H. Y. Yi and L. M. Wang, Spectrochim. Acta, Part A, 2019, 221, 117203 CrossRef CAS PubMed.
- S. Y. Lim, J. H. Kim, J. S. Lee and C. B. Park, Langmuir, 2009, 25, 13302–13305 CrossRef CAS PubMed.
- L. Su, S. Wang, L. Wang, Z. Yan, H. Yi, D. Zhang, G. Shen and Y. Ma, Spectrochim. Acta, Part A, 2020, 225, 117511 Search PubMed.
- Y. D. Qin, H. Bubiajiaer, J. Yao and M. W. Zhang, Biosensors, 2022, 12(4), 242 CrossRef CAS PubMed.
- K. C. Grabar, K. R. Brown, C. D. Keating, S. J. Stranick, S. L. Tang and M. J. Natan, Anal. Chem., 1997, 69(3), 471–477 CrossRef CAS PubMed.
Footnote |
| † Yuyan Yu and Shumin Ye contributed equally to this manuscript and should be considered co-first authors. |
| This journal is © The Royal Society of Chemistry 2022 |

