 Open Access Article
Copper(II) complexes with 2-ethylpyridine and related hydroxyl pyridine derivatives: structural, spectroscopic, magnetic and anticancer in vitro studies†
Magdalena Malik *a,
Anna Świtlicka
 b,
Alina Bieńko
 c,
Urszula K. Komarnicka
 c,
Dariusz C. Bieńko
 a,
Sandra Kozieł
 c,
Agnieszka Kyzioł
 d,
Tomasz Mazura and
Barbara Machura
 b
b
aFaculty of Chemistry, Wroclaw University of Science and Technology, Wybrzeże Wyspiańskiego 27, 50-370 Wrocław, Poland. E-mail: magdalena.malik@pwr.edu.pl
bDepartment of Crystallography, Institute of Chemistry, University of Silesia, Szkolna 9, 40-006 Katowice, Poland
cFaculty of Chemistry, University of Wroclaw, F. Joliot-Curie 14, 50-383 Wrocław, Poland
dFaculty of Chemistry, Jagiellonian University, Gronostajowa 2, 30-387 Kraków, Poland
First published on 28th September 2022
Abstract
Copper(II) complexes with 2-ethylpyridine (1 and 2), 2-(hydroxyethyl)pyridine (3) and 2-(hydroxymethyl)pyridine (4) have been synthesized and characterized. All inorganic compounds have been studied by X-ray diffraction, thermogravimetry, vibrational and EPR spectroscopy as well as theoretical methods. The geometry of the complexes 1, 3 and 4 adopts nearly perfect geometry close to square planar (1, 4) or square pyramid (3) stereochemistry, respectively. The distortion of five coordinated copper(II) ions in complex 2 indicates intermediate geometry between square pyramidal and trigonal pyramidal geometry. Further, the magnetic measurements have shown antiferromagnetic behaviour of the prepared complexes in a wide range of temperatures. The antiferromagnetic behaviour of 2 should originate from the superexchange interactions between each copper(II) ion by the mixed chloride and μ4-O ion pathways. Besides, the weak antiferromagnetic character of 2 can be also attributed to the presence of intrachain exchange between dimeric units through double oxide ion. In complex 3, strong antiferromagnetic coupling between Cu(II) centres in the Cu2O2Cl2 moiety is found. The cytotoxicity of all compounds was tested in vitro against various cancer cell lines: human lung adenocarcinoma (A549), human breast adenocarcinoma (MCF7), human prostate carcinoma; derived from metastatic site: brain (DU-145) and two normal cell lines: human embryonic kidney (HEK293T) and human keratinocyte (HaCat). Furthermore, Pluronic P-123 micelles loaded with selected complexes (1 and 3) were proposed to overcome low solubility and to minimize systemic side effects. More detailed study revealed that complex 3 loaded inside micelles causes DU-145 cells' death with simultaneous decrease of mitochondrial membrane potential and a high level of reactive oxygen species generation. The stability of the compounds 1–4 in DMSO was confirmed by UV-Vis and FT-IR spectra studies.
Introduction
Several halide or mixed ligand copper, cobalt and manganese complexes of the substituted pyridine and pyridine alcohols have appeared in the literature. Some of them are mononuclear, binuclear, and polymeric complexes, which can be used as model species for active sites of biological metalloenzymes.1–10 Several halide copper complexes with pyridine (py), including isomers as general formula: Cu(py)2X2, Cu2(py)2X4, Cu4(py)4OX6 and 4-methylpyridine or 2-methylpyridine (2-picoline, 2-pic): Cu(2-pic)2Cl2(OH2), and dimeric [Cu(2-pic)2Cl2]2 coordination compounds are known.4 Additionally, the chirality of the square planar Pt and Pd complexes with substituted pyridines ([H2etpy][PtCl3(2etpy)], trans-[PdCl2(2etpy)2], trans-[PdCl2(2mepy)2], cis-[PtI2(2etpy)2]; 2etpy-2ethylpyridine, 2mepy-methylpyridine) plays an important role in the interaction mechanism of these complexes with DNA.10,11A wide variety of pyridine-based alcohols and their metal compounds, i.e. Co(II), Ni(II) complexes have been studied in the last years.8 Furthermore, the 2-(hydroxyethyl)pyridine (Hhep) could be a good candidate to form coordination species with interesting magnetic behaviour ([Ni(C7H8NO)2(H2O)2](NO3)2, [Cu(C7H8NO)2(SO4)]n)8 which we have decided to check for the complexes obtained by our group. Nowadays, research on the pyridine-based alcohols and their metal complexes focuses on the synthesis of the coordination monomers and polymers, which have been useful in catalysis, and modern electronics (e.g. OLEDs, organic light-emitting diodes) or species with magnetic properties.8 Additionally, the ligand Hhep is an outstanding compound, which attracted attention in biology and biochemistry with practical applications, i.e. in the synthesis of biologically active complexes.12–15 A great example is a gold(III) complex with 2-(hydroxyethyl)pyridine (Hhep) possessing significant anticancer activity against a human lung adenocarcinoma cell line (A549) and human breast adenocarcinoma (MCF-7).16a Additional study of gold(III) complexes with 2-(hydroxymethyl)pyridine (Hhmp) revealed that [AuCl3(Hpm)] and [AuC12(pm)] complexes retain an appreciable cytotoxicity in vitro against the tumor cell lines T-Lymphoblastoid cell line, SKOV3 and A2780 Human Ovarian cell line and lines resistant to cisplatin12.
The pyridine-based alcohols can form different coordination modes with metal ions, i.e. monodentate chelating by N-atoms, or chelating and bridging by N,O-atoms in the deprotonated form of such ligands.6 Additionally, 2-(hydroxymethyl)pyridine and homologous alcohols have been used in manganese chemistry to obtain single molecule magnets (SMMs) type.6 These ligands are commercially available but they have not been employed widely as popular ligands in coordination chemistry. In recent years Hhmp (2-(hydroxymethyl)pyridine, 2-pymet) has been used in copper coordination chemistry to obtain new mononuclear structures with six coordinate Cu(II) ions, where pyridine alcohol binds as a chelating ligand. There are only a few reports on the structures with the anionic hmp ligand, which can form a chelating bridging mode or the polynuclear complex.17 In addition, structures with Hhep/hep (2-(hydroxyethyl)pyridine; 2-pyet/deprotonated one) occur less frequently. Copper(II) mononuclear complexes with Hhep have been synthesized from simple bromide and chloride (CuX2, X = Br, Cl) in methanolic solution. Such examples are polymers [Cu2(μ-Cl)2(μ-hep)2]n (ref. 9) and [Cu2(hep)2Cl2]n, where the centrosymmetric dimeric units are stabilized by weak inter-dimer interactions arising from bridging Cl ligands to form a polynuclear chain with di-μ-O (from deprotonated ligand, hep) and di-μ-Cl bridges.5 The biological properties and spectroscopic studies of copper-2-(hydroxyethyl)pyridine complexes, which we report here, have not been conducted before. Lah and co-workers synthesized others copper(II) complexes with the neutral forms of the pyridine alcohols, that have Cu2(OR)2X2 core, i.e. [Cu(2-pymet)4Cl2]Cl2·2H2O, [Cu(2-pyet)2Br]Br,2 [Cu2(Hhmp)2Cl4]n·2nCH3OH, and complexes with deprotonated 2-(hydroxypropyl)pyridine (hpp) [Cu2(hpp)2Br2], [Cu4(hpp)4Br4] and [Cu4(hpp)4Cl4].5 The mechanism of the deprotonation pyridine-based alcohols in complexation is not clear. It is hard to explain why complexes with an alkoxide-bridge can be formed rather than with a hydroxide-bridge.5 The search through the Cambridge crystal Database (CSD) shows some metal complexes possessing pyridine-based alcohols, i.e. [Co2(μ-Cl)2(mpy)4]Cl2·2H2O, [Co(dmpy)2]Cl2, [Co(Cl)4](Hpyet)2 (where mpy: 2-methanolpyridine, dmpy: 2,6-dimethanolpyridinie, hpyet: 2-ethanolpyridinium)1 which confirms that these studies are still valid. Mobin and Mohammad obtained the monomeric ionic cobalt(II) complexes, [Co(hep-H)(H2O)4](SO4)2 and [Co(hep-H)2(H2O)2](NO3)2 and rearranged them by heat using the SCSC (Single-Crystal-to-Single-Crystal) transformation.7 Besides, the biological properties were not presented in the previous works.
In this paper, we report the preparation and structural characterization (X-ray analysis, FT-IR and Raman spectra, thermal studies), magnetic behaviour and biological activities of the four complexes, Cu(II) with 2-ethylpyridine (compounds 1 and 2) and with 2-pyridineethanol (2-(hydroxyethyl)pyridine), and 2-pyridinemethanol (2-(hydroxymethyl)pyridine) complexes 3 and 4, respectively. Most importantly, two of them (1 and 2) have been synthesized for the first time. Moreover, we have focused on completing the incomplete data for the previously known and poorly described Cu(II) complexes 3 and 4. Herein we discuss and compare the obtained results for 1–4 complexes and support them with theoretical calculations.
In this work, the stability of the compounds in solution was confirmed by the results of the UV-Vis and FT-IR analysis.
An important goal of our work, following the structural characteristics, is to find the relationship between the biological activity of the synthesized complexes and the N-donor ligands used. We will also evaluate the effect of chelation in the case of hydroxyl derivatives of pyridine ligands on the presented biological properties. The results presented by us indicate the suitability of selected ligands used in the synthesis with copper(II) ions for the construction of functional materials showing magnetic and biological properties.
Results and discussion
Synthesis
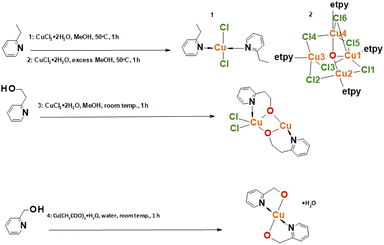
The general procedure of synthesis of the four complexes is described in the experimental part and visualized in Scheme 1. The synthesis involved mixing methanolic solutions of copper(II) salts with ligands and was carried out under reflux or in the air and gives expected products. Single crystals suitable for crystallographic measurements were determined by the X-ray diffraction method.Crystal structures of complexes
All crystal data and structure refinement for complexes 1–4 are summarized in Table S1.†X-Ray analysis revealed that compound 1 crystallizes in the triclinic P![[1 with combining macron]](https://www.rsc.org/images/entities/char_0031_0304.gif) space group and it is composed of neutral trans-[CuCl2(etpy)2] mononuclear units, where the copper(II) ion is four-coordinate with two monodentate pyridine-based ligands and two chloride anions. The perspective view showing the molecular structure together with the atom numbering is presented in Fig. 1, while the selected bond distances and bond angles are summarized in Table 1.
space group and it is composed of neutral trans-[CuCl2(etpy)2] mononuclear units, where the copper(II) ion is four-coordinate with two monodentate pyridine-based ligands and two chloride anions. The perspective view showing the molecular structure together with the atom numbering is presented in Fig. 1, while the selected bond distances and bond angles are summarized in Table 1.
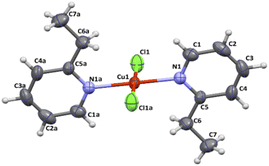 | ||
| Fig. 1 Molecular structure of [CuCl2(etpy)2] together with the atom numbering. Displacement ellipsoids are drawn at 50% probability level. | ||
| Bond lengths [Å] | Bond angles [°] | ||
|---|---|---|---|
| a Symmetry code: (a): 1 − x, 1 − y, 1 − z. | |||
| Cu(1)–N(1) | 1.9935(18) | N(1)–Cu(1)–N(1)a | 180.0 |
| Cu(1)–N(1)a | 1.9935(18) | N(1)–Cu(1)–Cl(1) | 89.89(5) |
| Cu(1)–Cl(1) | 2.2524(6) | N(1)a–Cu(1)–Cl(1) | 90.11(5) |
| Cu(1)–Cl(1)a | 2.2524(6) | N(1)a–Cu(1)–Cl(1)a | 89.89(5) |
| Cl(1)–Cu(1)–Cl(1)a | 180.00(4) | ||
In order to estimate the angular distortion from the square planar geometry of 1, the Okuniewski's (τ′4) parameter,18 as well as the SHAPE program19 based on Continuous Shape Measures (CShM) concept, were used. The shape value (SQ(P)) concerning the square planar geometry was found for 0.372, while the calculated distance to the ideal tetrahedral geometry is following 33.581. The square planar geometry of metal ion is confirmed by Okuniewski parameter (τ4′ = 0). The Cu–N and Cu–Cl bond distances [Cu(1)–N(1) = 1.9935(18) Å, Cu(1)–N(1) a = 1.9935(18) Å, Cu(1)–Cl(1) = 2.2524(6) Å, Cu(1)–Cl(1) a = 2.2524(6) Å; (a): 1 − x, 1 − y, 1 − z] are comparable with those of copper(II) compounds with the CuN2X2 chromophore in the same geometry.20–23 The coper(II) ions in 1 are well separated from each other, the shortest intermolecular metal–metal distance being 7.5197(9) Å.
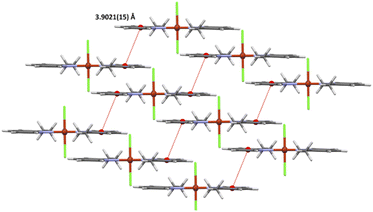
The crystal packing analysis24 revealed that the molecules trans-[CuCl2(etpy)2] are linked into dimers through π⋯π stacking with centroid-to-centroid separations of 3.9021(15) Å (Fig. 2) (Table 2). No short intermolecular interactions were observed.
| Cg(I)⋯Cg(J) | Cg(I)⋯Cg(J) [Å] | α [°] | β [°] | γ [°] | Cg(I)-Perp [Å] | Cg(J)-Perp [Å] |
|---|---|---|---|---|---|---|
| a α = dihedral angle between Cg(I) and Cg(J); Cg(I)-Perp = perpendicular distance of Cg(I) on ring J; Cg(J)-Perp = perpendicular distance of Cg(J) on ring I; β = angle Cg(I) → Cg(J) vector and normal to ring I; γ = angle Cg(I) → Cg(J) vector and normal to plane J; Cg(1): N(1)/C(1)/C(2)/C(3)/C(4)/C(5).b Symmetry code: (b): 2 − x, 2 − y, 1 − z. | ||||||
| Cg(1)⋯Cg(1)b | 3.9021(15) | 0 | 27.34 | 27.34 | 3.4661(11) | 3.4661(11) |
The complex 2 crystallizes in the monoclinic space group P21/n and the crystal structure consists of tetranuclear molecules [Cu4OCl6(etpy)4] with well-known [Cu4(μ4-O)(μ2-Cl)] core (Fig. 3). The compound 2 consists of a tetrahedron of Cu(II) atoms held together by one central μ4-O ion and six μ2-Cl anions. Each chloride atom spans the edge of the tetrahedron, while one etpy molecule is bound to each Cu(II) atom via the pyridine nitrogen atom. The Cu4(μ4-O) tetrahedron is slightly distorted and the Cu–O–Cu angles and Cu–O bond length vary from 105.97(9)–113.99(10)° and 1.8853(18)–1.9086(19) Å, respectively. The chloro bridges involving Cl(1), Cl(2), Cl(3), Cl(4), Cl(5) and Cl(6) atoms are slightly asymmetrical, with Cu–Cl distances ranging from 2.3199(9) to 2.6850(9) Å and six Cu–Cl–Cu bond angles from 76.48(3) to 79.50(3)° (see Table S2†).
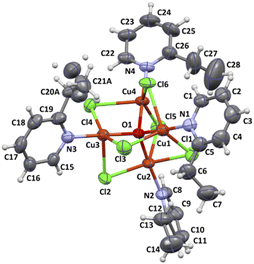 | ||
| Fig. 3 Molecular structure of [Cu4OCl6(etpy)4] together with the atom numbering. Displacement ellipsoids are drawn at 50% probability level. | ||
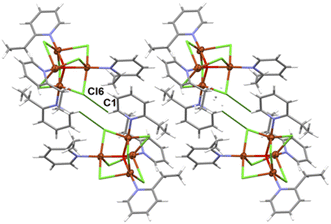 | ||
| Fig. 4 Crystal packing diagram of [Cu4OCl6(etpy)4]. The analysis of the crystal packing24 reveals the presence of weak C–H⋯Cl type interactions giving rise to the formation of dimers (figure, Table 3). | ||
| D–H⋯A | D–H | H⋯A | D⋯A [Å] | D–H⋯A [°] |
|---|---|---|---|---|
| C(1)–H(1)⋯Cl(6) | 0.93 | 2.65 | 3.341(4) | 131.00 |
The distortion of five coordinated copper(II) ions can be described by the structural parameter τ angular structural index parameter τ,25 called also the Addison parameter, it expresses the difference between the two largest angles divided by 60. Compared to the ideal values of τ = 1 for a trigonal bipyramid and τ = 0 for a square pyramid, the τ1 = 0.77 for Cu(1) indicates trigonal bipyramidal geometry, however structural parameters for Cu(2), Cu(3) and Cu(4) show intermediate geometry between square pyramidal and trigonal pyramidal geometry (τ2 = 0.45 for Cu(2); τ3 = 0.32 for Cu(3); τ4 = 0.33 for Cu(4)). The coordination geometries of the examined complex were also compared to two ideal geometries: bipyramidal geometry and square pyramidal using Continuous Shape Measures (CShM). The shape value concerning bipyramidal geometry was found 2.873 for Cu(1); 4.300 for Cu(2); 3.201 for Cu(3); 4.929 for Cu(4), while the calculated distances to the ideal square pyramidal are following for 5.151 Cu(1); 3.201 for Cu(2); 2.678 for Cu(3); 2.526 for Cu(4). A similar trend has been observed in literature.26,27
The perspective drawings of the asymmetric unit and the perspective views of 1D coordination structures of 3 are presented in Fig. 5. Their selected bond distances and angles are given in Table 4. The X-ray structure of 3 was reported previously (CCDC numbers: 611672 and 1056574) and we will refer to it only for comparison.5,9
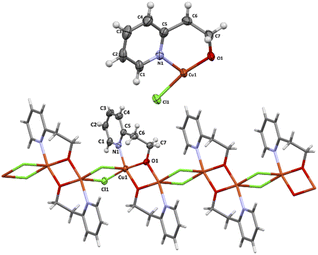 | ||
| Fig. 5 The asymmetric units (top) and one-dimensional coordination chain (bottom) of 3. Displacement ellipsoids are drawn at 50% probability. | ||
| Bond lengths [Å] | Bond angles [°] | ||
|---|---|---|---|
| a Symmetry code: (c): −x, 2 − y, −z; (d): 1 − x, 2 − y, −z. | |||
| Cu(1)–N(1) | 2.020(2) | N(1)–Cu(1)–O(1) | 165.39(8) |
| Cu(1)–Cl(1) | 2.2582(7) | N(1)–Cu(1)–O(1)c | 92.79(8) |
| Cu(1)–Cl(1)c | 2.9381(8) | N(1)–Cu(1)–Cl(1) | 95.87(6) |
| Cu(1)–O(1) | 1.9388(17) | O(1)c–Cu(1)–O(1) | 74.53(8) |
| Cu(1)–O(1)d | 1.9308(16) | O(1)–Cu(1)–Cl(1) | 95.75(5) |
| O(1)–Cu(1)–Cl(1) | 168.08(6) | ||
| Cu(1)–O(1)–Cu(1)d | 105.47(8) | ||
| D–H⋯A | D–H | H⋯A | D⋯A [Å] | D–H⋯A [°] |
|---|---|---|---|---|
| C(1)–H(1)⋯Cl(1) | 0.93 | 2.62 | 3.205(2) | 122.00 |
| C(7)–H(7B)⋯Cl(1) | 0.97 | 2.67 | 3.286(3) | 122.00 |
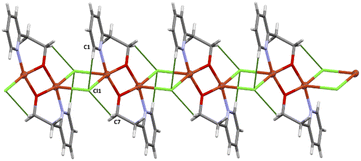 | ||
| Fig. 6 Crystal packing diagram of 3. The crystal packing analysis24 revealed that the chains are stabilized by weak C–H⋯Cl interactions (see Table 5, figure). | ||
The complex 3 crystallizes in triclinic space group P![[1 with combining macron]](https://www.rsc.org/images/entities/char_0031_0304.gif) and the structure consists of neutral binuclear [Cu2Cl2(pyet)2] units, what results from pairing two mononuclear units related by a crystallographic centre of inversion. The dinuclear moieties are further linked through chloride bridge into one dimensional structure. Each copper(II) ion is pentacoordinated by two bridging chlorides [Cu(1)–Cl(1) = 2.2582(7) Å; Cu(1)–Cl(1) c = 2.9381(8) Å; (c): −x, 2 − y, −z], one pyridine nitrogen [Cu(1)–N(1) = 2.020(2) Å] and two μ–deprotonated hydroxyl oxygen [Cu(1)–O(1) = 1.9388(17) Å; Cu(1)–O(1) d = 1.9308(16) Å; (d): 1 − x, 2 − y, −z] from pyet molecule.
and the structure consists of neutral binuclear [Cu2Cl2(pyet)2] units, what results from pairing two mononuclear units related by a crystallographic centre of inversion. The dinuclear moieties are further linked through chloride bridge into one dimensional structure. Each copper(II) ion is pentacoordinated by two bridging chlorides [Cu(1)–Cl(1) = 2.2582(7) Å; Cu(1)–Cl(1) c = 2.9381(8) Å; (c): −x, 2 − y, −z], one pyridine nitrogen [Cu(1)–N(1) = 2.020(2) Å] and two μ–deprotonated hydroxyl oxygen [Cu(1)–O(1) = 1.9388(17) Å; Cu(1)–O(1) d = 1.9308(16) Å; (d): 1 − x, 2 − y, −z] from pyet molecule.
The angular structural index parameter τ,25 called also the Addison parameter, expresses the difference between the two largest angles divided by 60, and it equals 0.045. Compared to the ideal values of τ = 1 for a trigonal bipyramid and τ = 0 for a square pyramid, the τ values indicate geometry close to square pyramid stereochemistry. As in the previous compounds, the coordination geometry of 3 was also investigated by the continuous symmetry measures methodology19,28,29 and the shape value (SQ(P)) concerning the square pyramid geometry was found 2.829, while the calculated distances to the ideal trigonal bipyramid were following 7.444. Two types of bridges: symmetrical Cu2O2 and asymmetrical Cu2Cl2 are twisted to each other and the dihedral angles between them are 77.86(1)°. The Cu⋯Cu distances through Cu2O2 and Cu2Cl2 bridges as well as the shortest interchain metal⋯metal separation is equal to 3.0797(5), 3.8043(5) and 6.0321(6) Å, respectively.
The X-ray structure of 4 was determined in the past (CCDC numbers: 615292, ref. 30). Complex 4 crystallizes in monoclinic C2/m space group. The perspective view of the molecular structure is shown in Fig. 7.
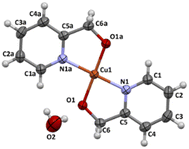 | ||
| Fig. 7 Molecular structure of 4 together with the atom numbering. Displacement ellipsoids are drawn at 50% probability level. | ||
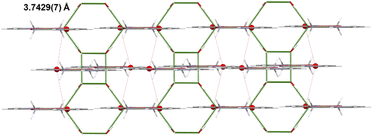
The copper(II) centre, coordinated to two molecules of N,O-donor ligand via the pyridyl nitrogen atom [Cu(1)–N(1) = 1.982(3) Å; Cu(1)–N(1)e = 1.982(3)Å; (e): 1 − x, y, −z] and hydroxyl oxygen atom [Cu(1)–O(1) = 1.895(2)Å; Cu(1)–O(1)e = 1.895(2) Å; (e): 1 − x, y, −z], adopts a distorted square planar geometry (Table 6). The shape value19 (SQ(P)) concerning the square planar geometry was found for 0.305, while the calculated distance to the ideal tetrahedral geometry is following 33.536. The crystal packing analysis24 demonstrates that the molecules of 4 are linked into supramolecular 3D network by O(2)–H(2A)⋯O(2) [D⋯A distance 2.755(4) Å; D–H⋯A angle 112.00°] and O(2)–H(2A)⋯O(2)f (D⋯A distance 2.753(3) Å; D–H⋯A angle 168.0°; (f): 1 − x, y, −1 − z) hydrogen bonds and π–π type interactions with the centroid-to-centroid separation of 3.7429(7) Å (Fig. 8, Table 7).
| Bond lengths [Å] | Bond angles [°] | ||
|---|---|---|---|
| a Symmetry code: (e): 1 − x, y, −z. | |||
| Cu(1)–N(1) | 1.982(3) | N(1)–Cu(1)–N(1)e | 180.0 |
| Cu(1)-N(1)e | 1.982(3) | N(1)–Cu(1)–O(1) | 84.22(9) |
| Cu(1)–O(1) | 1.895(2) | N(1)a–Cu(1)–O(1) | 95.78(9) |
| Cu(1)–O(1)e | 1.895(2) | N(1)a–Cu(1)–O(1)e | 84.22(9) |
| N(1)–Cu(1)–O(1)e | 95.78(9) | ||
| D–H⋯A | D–H | H⋯A | D⋯A [Å] | D–H⋯A [°] |
|---|---|---|---|---|
| a Symmetry code: (f): 1 − x, y, −1 − z; *α = dihedral angle between Cg(I) and Cg(J); Cg(I)-Perp = Perpendicular distance of Cg(I) on ring J; Cg(J)-Perp = perpendicular distance of Cg(J) on ring I; β = angle Cg(I) → Cg(J) vector and normal to ring I; γ = angle Cg(I) → Cg(J) vector and normal to plane J; Cg(1): N(1)/C(1)/C(2)/C(3)/C(4)/C(5), Cg(2): N(1)/C(1)/C(2)/C(3)/C(4)/C(5), Cg(3): N(1)/C(1)/C(2)/C(3)/C(4)/C(5), &Symmetry code: (g):1/2 − x, −1/2 + y, −z. | ||||
| O(2)–H(2A)⋯O(2)f | 0.80 | 2.35 | 2.755(4) | 112.00 |
| O(2)–H(2B)⋯O(1) | 0.80 | 1.92 | 2.753(3) | 168.0 |
| Cg(I)⋯Cg(J) | Cg(I)⋯Cg(J) [Å] | α [°] | β [°] | γ [°] | Cg(I)-Perp [Å] | Cg(J)-Perp [Å] |
|---|---|---|---|---|---|---|
| Cg(1)⋯Cg(1)g | 3.7429(7) | 0 | 16.46 | 16.46 | −3.5895(1) | 3.5895(1) |
FT-IR and Raman spectroscopy
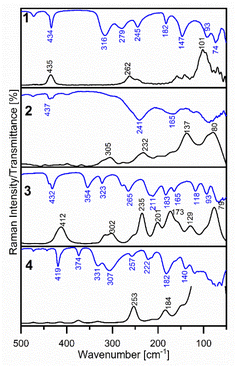
The FT-IR and Raman spectra of 1–4 in the middle region are shown in Fig. S1 and S2.† Fig. 9 presents the far-infrared region of the discussed complexes absorption. A vibrational assignment of the experimental spectra was made basing on the potential energy distribution (PED) calculated by the FCART06 program using B3LYP-D3/def2-TZVP level of the theory and on the visualization in GaussView 6 program.31Firstly, the spectral region from 3080 to 2817 cm−1 recorded in the FT-IR and Raman spectra of all synthesised complexes is characteristic of ν(C–H) stretching vibrations, however, in the IR spectra, they are presented as weak or medium bands. Next, weak bands at 1855 cm−1 and 1732 cm−1 in 1 and at 1864 and 1728 cm−1 in the FT-IR spectra of 2 can be assigned to overtones. The ν(C–C) and ν(C–N) stretching vibrations have generated the characteristic strong or medium bands in the 1608–1424 cm−1 spectral range in FT-IR spectra of 1–4, very well predicted by theoretical calculations. Nevertheless, the N-coordination of 2-ethylpyridine, 2-(hydroxyethyl)pyridine and 2-hydroxymethylpyridine is confirmed by the presence of strong and medium bands in the frequency range 1484–1424 cm−1 due to ν(C![[double bond, length as m-dash]](https://www.rsc.org/images/entities/char_e001.gif) N) stretching vibrations in FT-IR spectra of the studied complexes. The medium or strong peaks in the FT-IR spectra of 1–4 at 1033 cm−1 (Raman: 1031 cm−1), 1045 cm−1 (Raman: 1031 cm−1), 1052 cm−1 (Raman: 1025 cm−1) and at 1038 cm−1 in Raman spectra of 4, respectively, can be assigned to the characteristic vibrations of the pyridine ring, “Star of David”. The confirmation of the coordination of the 2-pyridineethanol or 2-pyridinemethanol via oxygen atom from –(CH2)2O– and –(CH2)O– groups are the strong bands at 1081 cm−1 in the Raman spectra of 3 and at 1058 cm−1 in the Raman spectrum (IR: overlapped) of 4 as well. These bands are caused by stretching ν(C–O) vibrations, which have higher absorption compared to the free ligand.16a As it is shown in Table S3 in ESI material† the characteristic out of plane γ(C–H) bending vibrations generate the strong bands in the 999–700 cm−1 spectral range of the vibrational spectra of these complexes. The strong bands at 434 cm−1 (Raman: 435 cm−1), 437 cm−1, 432 cm−1 (Raman: 412 cm−1) and 419 cm−1 in the FT-IR spectra of 1–4 respectively, are due to the torsion of the pyridine ring atoms (τRpyet).
N) stretching vibrations in FT-IR spectra of the studied complexes. The medium or strong peaks in the FT-IR spectra of 1–4 at 1033 cm−1 (Raman: 1031 cm−1), 1045 cm−1 (Raman: 1031 cm−1), 1052 cm−1 (Raman: 1025 cm−1) and at 1038 cm−1 in Raman spectra of 4, respectively, can be assigned to the characteristic vibrations of the pyridine ring, “Star of David”. The confirmation of the coordination of the 2-pyridineethanol or 2-pyridinemethanol via oxygen atom from –(CH2)2O– and –(CH2)O– groups are the strong bands at 1081 cm−1 in the Raman spectra of 3 and at 1058 cm−1 in the Raman spectrum (IR: overlapped) of 4 as well. These bands are caused by stretching ν(C–O) vibrations, which have higher absorption compared to the free ligand.16a As it is shown in Table S3 in ESI material† the characteristic out of plane γ(C–H) bending vibrations generate the strong bands in the 999–700 cm−1 spectral range of the vibrational spectra of these complexes. The strong bands at 434 cm−1 (Raman: 435 cm−1), 437 cm−1, 432 cm−1 (Raman: 412 cm−1) and 419 cm−1 in the FT-IR spectra of 1–4 respectively, are due to the torsion of the pyridine ring atoms (τRpyet).
Fig. 9 shows the information about metal–ligand vibrations, which are found in the far infrared spectral range, below 500 cm−1.
Table 8 is based on the studies of the spectra supported by theoretical calculations, which are particularly helpful in the bands assignment of the new complexes.
| ν(Cu–N) | ν(Cu–Cl) | ν(Cu–OL) | |||||||
|---|---|---|---|---|---|---|---|---|---|
| IR | Ra | Calc. | IR | Ra | Calc. | IR | Ra | Calc. | |
| a = is observed only in IR or Raman (Ra) spectrum.b = averaged value of the frequency; n.o. = not observed. | |||||||||
| 1 | 279m | n.o. | 269 | 316br | n.o.a | 336 | — | — | — |
| 245m | ov | 242 | n.o.a | 262m | 260 | ||||
| 2 | ov | 305m | 265b | 241br | 232br | 251b | 572s | 558m | 560b |
| ov | ov | 245b | ov | 305m | 305 | ||||
| 3 | 280sh | ov | 274 | 354m | ov | 345 | 572s | 545m | 571 |
| 211m, br | 201m | 201 | 265m | 235s | 257 | 323m | 320sh | 330 | |
| 4 | 331s/307s | n.o. | 338 | — | — | — | 509m | n.o.a | 516 |
| 257m | n.o. | 276 | n.o.a | 473w | 480 | ||||
Besides, in complex 2 a lot of the crystal lattice vibrations coupled with the μ4-O bridged one can be observed, and it is problematic to find copper-ligands vibrations as Nakamoto describes.32 It is worthwhile to mention the characteristic ν(Cu–O–Cu) stretching vibrations of the atoms in μ4-O bridge. These modes generate the medium bands at 558 cm−1 (calc. 560 cm−1) and 305 cm−1 (calc. 305 cm−1) in the Raman spectrum of 2, corresponding to the antisymmetric and symmetric ν(Cu–O–Cu) stretching vibrations, respectively. To compare, in the FT-IR spectrum of 3 at 572 cm−1 (Raman: 545 cm−1) a band assigned to the ν(Cu–O–Cu) stretching vibrations is observed as well. Furthermore, the calculated frequencies of these vibrations are in a good agreement with the experimental ones. The medium band at 412 cm−1 observed in the Raman spectrum of 3, predicted by DFT calculations at 398 cm−1, is due to the characteristic δ(Cu–O–Cu) bending vibrations like the “μ-O bridge breathing”. In the Raman spectrum of 2 the medium peak at 305 cm−1 corresponding to the symmetric ν(Cu–O) stretching vibrations coupled with ν(Cu–N) can be found, in the FT-IR spectrum this band is overlapped. Additionally, the medium band at 323 cm−1 in the FT-IR spectrum of 3 corresponds to the ν(Cu–O) stretching vibrations. In the Raman spectrum of 4 only symmetric stretching vibration (473 cm−1) is observed; antisymmetric stretching mode (νas(Cu–O)) generates only a band at 509 cm−1 in the FT-IR spectrum of 4, what is expected due to the geometry of the complex 4.
The assigned bands to the ν(Cu–Cl) stretching vibrations have higher frequencies than ν(Cu–N) stretching for complex with pyridine derivatives group. We confirm this fact in our vibrational spectroscopic study. The strong and broad peak at 316 cm−1 in FT-IR spectrum of 1 is due to the antisymmetric νas(Cu–Cl) stretching vibrations, where the calculated frequency is 336 cm−1 (100% PED). Moreover, at 262 cm−1 in the Raman spectrum of 1 the medium band assigned to the νs(Cu–Cl) stretching vibrations (60% PED) is observed, simultaneously it is not found in FT-IR spectrum, due to the square planar around the copper(II) ion in 1. Comparing, in the FT-IR spectrum of 2 we can detect only one broad band at 241 cm−1 (calc. 251 cm−1) and the corresponding broad peak with a maximum at 232 cm−1 in the Raman spectrum of complex 2. In FT-IR spectrum of 3 there are observed two medium bands at 354 cm−1 and 265 cm−1 (Raman: 235 cm−1) which can be assigned to ν(Cu–Cl) stretching vibrations. The characteristic ν(Cu–N) stretching vibrations, where N is from the pyridine ring, generate medium bands at 279 cm−1 and 245 cm−1 (in the Raman overlapped) in the FT-IR spectrum of 1. In the Raman spectrum of 2, the medium band at 305 cm−1 is found but in the FT-IR, it not be observed. The medium band at 211 cm−1 and shoulder at 280 cm−1 in the FT-IR spectrum of 3 can be assigned to the ν(Cu–N) stretching vibrations as well. The same mode generates the strong band at 307 cm−1 in FT-IR spectrum of 1.
The vibrational studies confirm the results obtained by the X-ray analysis concerning the N-donor type of coordination of the 2-ethylpyridine to the Cu(II) ion in 1 and 2 and N,O-donor type of coordination of the 2-(hydroxyethyl)pyridine to Cu(II) in 3 and 2-hydroxymethylpyridine in 4, respectively.
Stability Cu(II) complexes in DMSO solution (spectral study)
The investigation of the stability of synthesized complexes in DMSO solution was made by measuring FT-IR spectra of 1–4 after dissolving them in DSMO solvent. The spectra were measured at different intervals of time from 0–96 h and the total concentration of complexes was 2% (the FT-IR spectrum of DMSO was presented by us previously;16a we present selected spectra after 1 h, 24 h and 96 h).The same procedure was carried out for the stability studies of trans-[PtCl2(7AI3CAH)2, trans-[PdCl(7AI3CAH)2]+, cis-[PtCl(DMSO)(3Br4Cl7AIH)2]+ and [AuCl3(2-pyridineethanol)] in DMSO solution.16a–c In the first stage of determining the influence of DMSO on the stability of the copper(II) complexes changes in FT-IR spectrum of the solid state 1–4 comparing with these after dissolving them in a solvent were found. Immediately after dissolving Cu(II) complexes in DMSO the additional medium bands appear in FT-IR spectra; they are assigned to ν(CH)DMSO stretching vibrations. Besides, the band of ν(S![[double bond, length as m-dash]](https://www.rsc.org/images/entities/char_e001.gif) O) stretching vibrations in pure DMSO recorded at 1042 cm−1 is shifted to the lower intensity in solutions of 1–4 (Fig S3–S8†). For this concentration of the studied complexes, it is normal to see these bands and for clarity, and to show the behavior of 1–4, these DMSO-derived bands have not been removed. Actually, in the 1600–600 cm−1 spectral range the position of the bands in the IR spectra of the title complexes in DMSO remains almost unchanged in comparison to the IR spectra of 1–4 in the solid state. This fact can prove that 2-ethylpyridine, 2-pyridineethanol and 2-pyridinemethanol are not replaced by a DMSO molecule.
O) stretching vibrations in pure DMSO recorded at 1042 cm−1 is shifted to the lower intensity in solutions of 1–4 (Fig S3–S8†). For this concentration of the studied complexes, it is normal to see these bands and for clarity, and to show the behavior of 1–4, these DMSO-derived bands have not been removed. Actually, in the 1600–600 cm−1 spectral range the position of the bands in the IR spectra of the title complexes in DMSO remains almost unchanged in comparison to the IR spectra of 1–4 in the solid state. This fact can prove that 2-ethylpyridine, 2-pyridineethanol and 2-pyridinemethanol are not replaced by a DMSO molecule.
The medium bands at 381 and 331 cm−1 in the FT-IR spectrum of pure DMSO are due to scissoring δ(SC2) and twisting τ(SC2) vibrations, respectively. After dissolving 1–4 in DMSO solution we can observed some of them in FT-FIR spectra of the tested complexes. However, we indicate a similar position (only slight shifts are observed) of the marker bands found in the solid state complexes 1–4 compared to that in the DMSO solution.
Simultaneously, in FIR spectral region can be seen that after dissolving 2 in DMSO, it turns into complex 1.
No new band in the 400–500 cm−1 spectral range which indicates ν(Cu–ODMSO) stretching vibrations was found.32 It suggests that the copper(II) complexes may be stable in the used DMSO solution up to 96 hours. This investigation can give only qualitative information at that point.
Additionally, we checked the stability of synthesized complexes in DMSO/H2O solution (9![[thin space (1/6-em)]](https://www.rsc.org/images/entities/char_2009.gif) :
:![[thin space (1/6-em)]](https://www.rsc.org/images/entities/char_2009.gif) 1, v/v) at three different time points (0 min, 48 h and 96 h). UV-Vis spectra confirmed the stability of the complexes at room temperature (see Fig. S9†).
1, v/v) at three different time points (0 min, 48 h and 96 h). UV-Vis spectra confirmed the stability of the complexes at room temperature (see Fig. S9†).
The studied copper(II) complexes exhibit a d–d absorption band (Fig. S9†) in 600–900 nm, in accordance with their coordination cores {CuN2Cl2}, {CuNOCl3}, {CuNO2Cl2} and {CuN2O2} for 1–4, respectively.16d The UV-Vis spectra show broader band at 855 nm (in 1 and 2), 844 nm (3) and 722 nm (4). The higher intensity of d–d band is observed for 2 and it suggests the intermediate geometries between square pyramidal and trigonal pyramidal geometry. The visible spectra of 1 and 2 in solution are similar to each other, this indicates the environment around the copper(II) ion is the same in both complexes. Thus, complex 2, when dissolved, turns into complex 1. The strong absorption bands in the 200–400 nm for the complexes 1–4 are due to the π → π* or n → π* transitions; the strong bands at 300 nm and 313 nm (4) can be assigned to the ligand–metal charge transfer transitions.16e,f
Thermal analysis
The suggested decomposition products of 1–4 are based on mass loss calculations. Thermogravimetric, differential thermal analysis (TGA, DTGA) curves and corresponding data are illustrated in Fig. S10† and Table 9.| DTG peak T [°C] | Temp. range [°C] | Weight loss [%] | Decomposition product | ||
|---|---|---|---|---|---|
| Found | Calc. | ||||
| complex1 | 145 | 128–156 | |||
| 169 | 156–196 | ||||
| 242 | 196–260 | 61.3 | 61.4 | −2 × 2pyet | |
| 595 | 516–630 | 21.0 | 20.9 | –2HCl | |
| Total for 1: | 128–630 | 82.3 | 82.3 | Cu as residue product | |
| complex2 | 217 | 172–232 | 23.0 | 24.0 | –6HCl |
| 241 | 232–240 | 17.0 | |||
| 581 | 496–632 | 31.0 | 47.0 | −4 ·2etpy | |
| Total for 2: | 172–650 | 71.0 | 71.0 | 3Cu + CuO as residue product | |
| complex3 | 225 | 180–385 | |||
| 343 | 47.7 | 48.4 | −2 × 2 pyet | ||
| 581 | 475–715 | 19.8 | 16.0 | –Cl2 | |
| Total for 3: | 172–715 | 67.5 | 64.4 | 2 × CuO as residue product | |
| complex4 | 295 | 29–310 | 42 | ||
| 417 | 310–540 | 46 | 82 | −6H2O + 2 × 2-pyridinemethanol | |
| Total for 4: | 29–600 | 88 | 82 | Cu/CuO | |
Complex 1 begins to decompose at 128 °C. The decomposition stage between 128 and 260 °C with three endothermic effects at 145, 169, 242 °C is related to removal of the two 2-ethylpyridine ligands with a mass loss of 61.3% (calc. 61.4%).
In the last stage of thermal decomposition 1 loses two HCl molecules from 516 to 630 °C; were found at 21.0% and calculated at 20.9%, respectively. The obtained residue product is Cu. The TG curve for 2 shows that the complex is stable up to 217 °C with the first weight loss of 23.0% (calc. 24.0%) at 172–235 °C corresponding to the loss of six Cl molecules from the coordination bridge.
In the next stages (the two endothermic peaks at 241 and 581 °C) the found value of mass loss is 48.0% due to a release of pyridine ring fragments. The successive mass loss (71.0%) may lead to Cu and CuO formation.
Complex 3 begins to decompose at 180 °C, and the decomposition stage between 180 and 385 °C with two endothermic effects at 225 °C and 343 °C is related to removal of the two 2-(hydroxyethyl)pyridine ligands with a mass loss of 47.7% (calc. 48.4%). In the last stage of decomposition 3 loses Cl2 molecules from 475 to 715 °C; found at 19.8% and calculated at 16.0%, respectively. The obtained residue products are two molecules of CuO.
Complex 4 decomposes in two endothermic processes (the first step at 295 °C, the second at 417 °C, respectively). The assignment of these two steps involving the loss of the water molecules and the 2-pyridinemethanol ligand is problematic; therefore we suggest a residual product which can be Cu or its mixture with CuO for thermal decomposition of 4.
Magnetic properties
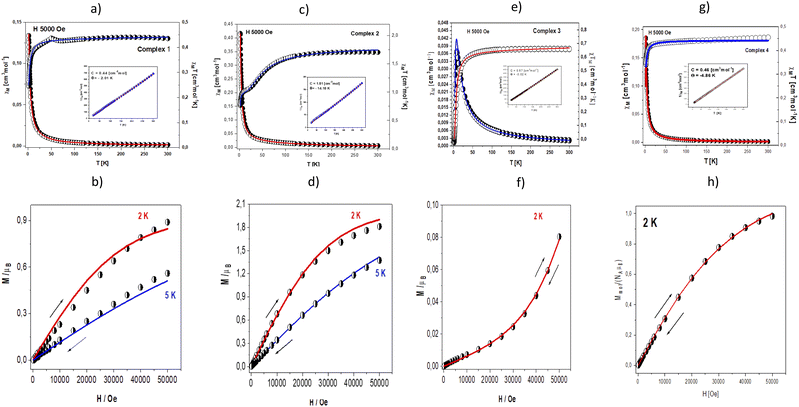
Magnetic data were acquired with the help of the SQUID magnetometer (MPMS, Quantum Design) at the applied field of B0 = 0.5 T and, after correction to the underlying diamagnetism, transformed to the temperature dependence of the χMT product (or effective magnetic moment, (Fig. 10 – top)). The field dependence of the magnetization per formula unit M1 = M mol/NA μB at the constant temperature is shown in Fig. 10 – below.The χM values for complexes 1, 2 and 4 increase slowly with the decrease in temperature, but in the low-temperature region, a rapid increase of molar susceptibility values occurs. Magnetic complex 1 and 4 present similar magnetic behaviour. The value of χMT at room temperature is 0.43 cm3 mol−1 K (1.87 μB) for 1 and 4 a little bit higher than these expected for one Cu(II) ion (with S = 1/2 and gav = 2.00). The χMT (and/or the effective magnetic moment) (Fig. 10a) decreases slowly with lowering the temperature to T = 70 K for 1 and 25 K for 4. Below these temperatures, a rapid decrease of the χMT is registered to reach the value χMT = 0.25 cm3 mol−1 K (1.40 μB) at 1.84 K for 1 and 0.32 cm3 mol−1 K (1.61 μB) at 1.85 K for 4. This feature indicates antiferromagnetic nature of the exchange interaction. The complexes obey the Curie–Weiss law in the 40–300 K temperature region (Fig. 10, inset). The fitting procedure applied to magnetic susceptibility converged to the crystal structure of examined complex. As mentioned in the structural discussion, complex 1 contains trans-[CuCl2(etpy)2] species which are linked into dimers through π⋯π stacking with the shorter Cu⋯Cu contact 7.489 Å. Complex 4 presents mononuclear architecture with distorted square planar geometry. In the crystal packing the molecules of 4 are linked into the supramolecular 3D network by O(2)–H(2A)⋯O(2) and O(2)–H(2A)⋯O(2) hydrogen bonds and π–π type interactions with the shortest Cu⋯Cu separation of 7.179 Å.
The theoretical analysis of magnetic data (Fig. 10a – line) was carried out using the PHI program,33 what allows for the simultaneous fitting of χT(T) and M(H) dependencies. Various additional Cu⋯Cu intermolecular interactions transmitted through the π⋯π stacking are described by the effective zJ′ parameter (where z is the number of adjacent paramagnetic species around a given mononuclear unit). Temperature independent paramagnetism (TIP) was also included in the fitting procedure.
The least squares fit of the experimental data by this method leads to the following results: gav(Cu) = 2.13 and zJ′ = −0.30 cm−1, TIP = 75 × 10−6 cm3 mol−1 for 1 and gav(Cu) = 2.15 and zJ′ = −0.56 cm−1, TIP = 95 × 10−6 cm3 mol−1. The discrepancy factor defined as is 3.21 × 10⁻⁵ (1) and 5.42 × 10⁻⁵ (4).
The value of the zJ′ parameter suggests that the exchange interaction between the nearest Cu(II) centres in the crystal lattice in both complexes is antiferromagnetic in nature but very weak. These conclusions are also confirmed by the value of magnetization calculated per formula unit M = Mmol/(NAμB) saturated to Ms = 0.98 μB at 2 K (5 T) (1) and Ms = 0.89 μB at 2 K (5 T) (4) (Fig. 10b and h).
In case of complex 2, the value of χMT (and/or the effective magnetic moment) decreases gradually from 1.71 cm3 mol−1 K (3.70 μB) at 300 K (a little bit higher than expected for the spin-only value for four isolated copper(II) ions with S = ½ and g = 2.00) to 1.06 cm3 mol−1 K (2.91 μB) at 20.0 K (Fig. 10c). It is typical for systems with predominantly antiferromagnetic interactions. In the temperature range of 20–5 K, a characteristic plateau observed at χMT ∼ 1.05 cm3 mol−1 K [μeff = 2.91 μB] corresponds to the isolated ground state S = 1. Below 5 K, the product of χMT further drops down to 0.77 cm3 mol−1 K [μeff = 2.48 μB] at 1.8 K. It indicates the presence of additional intermolecular antiferromagnetic interactions most likely between two crystallographically independent complexes bridged by C–H⋯Cl type interactions (the shortest Cu⋯Cu distance is 7.153 Å).
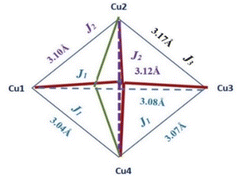
The antiferromagnetic behaviour should originate from the superexchange interactions between each copper(II) ion by the mixed chloride and μ4-O ion pathways. The fitting procedure of magnetic data of 2 (using the PHI program) was based on the quadrangle model assuming three different coupling constants, J1 and J2, logically corresponding to the 3 shortest Cu–Cu distances (1–3, 1–4, 3–4: J1) 2 longest (1–2, 2–4: J2) and one the longest (2–3) (see Scheme 2) as well as intermolecular Cu⋯Cu contacts described by the zJ′ parameter, and the TIP parameter (Scheme 2).
The best agreement with the experimental magnetic data for 2 was obtained with J1 = −27.5 cm−1, J2 = −14.4 cm−1, J3 = −8.2 cm−1, g = 2.21, zJ′ = −0.74 cm−1 and TIP = 61 × 10−6 cm3 mol−1, R = Σ[(χT)exp − (χT)calc]2/Σ[(χT)exp]2 = 1.22 × 10⁻⁵. The calculated curve matches the magnetic data well.
The magnetization per formula unit M1 = Mmol/(NAμB) at B = 5 T and T = 2.0 K did not reach a saturation plateau (Fig. 10d). In such a case the ground state equals S = 2 and the magnetization (per {Cu4} unit) should saturate to the value of Msat = 4.0 μB. The obtained value at higher magnetic fields is much smaller indicating antiferromagnetic exchange coupling between Cu(II) ions.
In case of complex 3 molar, magnetic susceptibility shows a sharp maximum at 25 K (Fig. 10e) what is indicative of strong antiferromagnetic coupling between Cu(II) centres in the Cu2O2Cl2 moiety.
The corresponding plot of χMT value (or magnetic moment) [per two Cu(II) centres] vs. temperature shows a decrease from 0.66 cm3 mol−1 K (2.30 μB) at 300 K (lower than expected for the spin–only value for two isolated coper(II) ions with S = ½ and g = 2.00) to 0.0026 cm3 mol−1 K (0.14 μB) at 1.81 K.
The fitting of magnetic data of 3 was carried out using the Hamiltonian [eqn (1)] (ref. 34) for an alternating Ising chain (Scheme 3) modified by molecular field correction [eqn (2)] taking into account the two different exchange pathways, through double chloride bridge (J1) and double oxide bridge (J2) and the TIP parameter:
 | (1) |
 | (2) |
The zero-field susceptibility of alternating antiferromagnetic Ising chain is:
 | (3) |
 ,
,  .
.
The least squares fit of the experimental data by these expressions leads to the following results: g = 2.19, and J1 = – 3.71 cm−1, J2 = – 3.08 cm−1 and TIP = 59 × 10−6. The discrepancy factor is 7.51 10−5. The variation of magnetization versus magnetic field at 2 K (Fig. 10f) confirms strong antiferromagnetic exchange coupling between Cu(II) ions. In such a case, the ground state equals S = 1, and the magnetization (per {Cu–Cu} unit) should saturate to the value of Msat = 2.0 μB. The obtained value at higher magnetic fields is much smaller.
In complexes 2 and 3 the possible magnetic exchange pathways include coupling via double asymmetric chloro bridges and symmetric single in 2 or double 3 oxide bridge. Magnetic data clearly shows antiferromagnetic character of this interaction in both complexes (much stronger in 2) which is in line with the data presented in the literature for similar systems. According to this, the simple magneto–structural correlations related the magnitude of exchange coupling (J) with the value of bridging angle (Cu–Cl–Cu) (φ),4,35,36 or (Cu–O–Cu) (φ2),36,37 and Cu–Cl/Cu–O bridge distance (R) particularly expressed by the φ/R ratio, to the more complicated factors such as geometry around the paramagnetic centres,38–40 and angular distortions given by dihedral angle (τ) between the equatorial planes. For 98.2° values of bridging Cu–Cl–Cu angle (lower than 90°) in complex 3, asymmetry of the chloride bridge (two different R values, one much shorter 2.258 Å and the other much longer 2.938 Å) what causes distortion of the SP geometry and an unusually long distance Cu⋯Cu (3.804 Å) a weak antiferromagnetic coupling is predicted. Additionally this fact also confirms the value of φ/R ratio equal 33.4 or 43.5, which is in agreement with the experimental results (for φ/R ratio lower than 32.6 or higher than 34.8 the exchange interaction is antiferromagnetic and for values falling in between these limits, the interactions are ferromagnetic).41
Finally, the weak antiferromagnetic character of 3 can also be attributed to the presence of intrachain exchange between dimeric units through double oxide ion. For dimers with planar or near planar Cu2O2 cores, the exchange constant (J) varies linearly with the Cu–O–Cu angle (φ). In case of 3 φ is equal to 105.5° (higher than border value of 97.5°), the interaction is predicted to be antiferromagnetic (S = 0 ground state). Angular distortions of LCu-O-CuL units may cause that the magnetic interaction becomes less antiferromagnetic at a given value of φ as a dihedral angle (d) between the two Cu2O2 planes is reduced from 180°.42 In complex 2 the observed stronger antiferromagnetic coupling is a result of Cu⋯Cu interaction transmitted through the oxide bridge. The δ value is less than 180° as well as large Cu–O–Cu angle (from 105.97 to 111 °) spends the limit typical of such an interaction. In case of possible Cu–Cl–Cu magnetic pathway structural parameter suggested ferromagnetic properties (bridging angle from 76.9 to 79.5° lower than 90°, short Cu–Cl bridge distances from 2.332 to 2.685 Å) what is not compatible with the experimental data.
Theoretical computation
To get a more detailed view into magnetic interactions in compounds 2 and 4, DFT calculations at the B3LYP-D3/def2-TZVP level of theory were performed to estimate the variation of spin density. The exchange coupling constants J between the paramagnetic Cu(II) ions were calculated using the “broken symmetry” approach, as implemented in ORCA. These J values were determined by taking the difference of the SCF energies calculated for the high-spin state (S = 3/2) and the broken-symmetry (S = 0) state. The BS state corresponds to configurations in which two unpaired spin-up, α electrons are localized on one site and two unpaired spin-down, β electrons are localized on the other site. The J values (using the Ĥ = JŜ1·Ŝ2 formalism) were evaluated using the expression, where ε are the energies and
  are the average values of the total spin-squared operator in the HS and BS states.
In general, the obtained results are in line with the conclusions reached on the base of magnetic measurements.
The broken symmetry DFT calculations at the B3LYP-D3 level performed for the X-ray coordinates of the structure of 2 predicted a strongest antiferromagnetic interaction between the 1–4 (J1 = −18.81 cm−1), 3-4 (J2 = −18.64 cm−1), and 1–3 (J1 = −18.61 cm−1) pair of copper(II) ions and much weaker between 1-2 (J2 = −10.55 cm−1), 1–3 (J1 = −4.81 cm−1), and 2-3 (J1 = −3.71 cm−1). The spin densities for the high spin states are shown in Fig. S11.† The highest Mulliken spin populations are at the copper atoms (0.5744–0.5857) and oxygen atom (0.2933) while the coordinated chlorine atoms show lower spin populations up to −0.041351 (Table S4†). This suggests that a pair of magnetic orbitals, localized on the metal centres as well as on the oxygen and the magnetic superexchange interaction through the oxygen bridge is more efficient than via chlorine ions.
The spin density for the ½ spin state of CuII in 3 is primarily localized on the copper ions (0.5668), but it is important to notice that this isosurface shows significant accumulation of spin density on the bridging chlorine atoms (0.1198; 0.0244) and oxygen atoms (−0.0538; −0.0351) (Table S4†). The DFT calculations showed that coupling between the Cu(II) ions should be antiferromagnetic in the nature, stronger through chlorine ions (J3 = −2.189 cm−1) than oxygen bridge (J2 = −1.783 cm−1) and this finding agrees qualitatively with the experimental conclusion and the coupling established within the spin model.
EPR spectra
The experimental EPR spectra of polycrystalline complexes 1–4 shown in Fig. 11 correspond to the local symmetry of Cu(II) coordination sphere close to axial and an unpaired electron in the dx2−y2 orbital.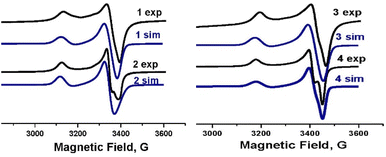 | ||
| Fig. 11 The EPR spectra for 1–4 at 295 K together with the spectra simulated (1 sim–4 sim) using the parameters given in the text. | ||
There is no change in the line shape, line width and resolution as a function of temperature.
Simulation of these spectra allowed us to determine the exact values of the g-tensor parameters gz = g∥, gx = gy = g⊥, gav = 1/3(g∥ + 2g⊥) a measure of the interaction between the magnetic moment of the unpaired electron of Cu(II) ion. The smallest g−tensor anisotropy for complex 4 (g∥ = 2.200, g⊥ = 2.052 and gav = 2.101) corresponds to the planar geometry of the anion with averaged cis–angle of 90° what is only the third known example with square planar geometry examined by EPR.43
In case of the rest of examined complexes the values of the g-tensor are higher: (g∥ = 2.209, g⊥ = 2.059 and gav = 2.109) for 1, (g∥ = 2.212, g⊥ = 2.062 and gav = 2.112) for 2 and (g∥ = 2.214, g⊥ = 2.058 and gav = 2.111) for 3 due to the change of geometry from planar to trigonal pyramidal.
Biological properties
Complex 4 turned out to be very toxic towards healthy cells and inactive against cancer cells so only 1 and 3 compounds, nontoxic towards normal cells, were encapsulated into polymeric micelles made of Pluronic P-123 (PEO-PPO-PEO triblock copolymer), using thin-film hydration method (Table 10 and 11).44 Complex 2 after being dissolved in biological medium adopts the same structure as compound 1, what was confirmed by UV-Vis spectra and FT-IR spectroscopy.| Formulation | Hydrodynamic diameter [nm] | LC ± SD [%] | EE ± SD [%] |
|---|---|---|---|
| Unloaded_M | 19.23 ± 0.43 PDI = 0.34 ± 0.12 | — | — |
| Complex 1M | 23.45 ± 0.46 PDI = 0.49 ± 0.11 | 3.97 ± 0.91 | 99.21 ± 0.35 |
| Complex 3M | 23.57 ± 0.40 PDI = 0.49 ± 0.07 | 5.52 ± 1.84 | 99.41 ± 0.33 |
| Compound | 24 h | ||||
|---|---|---|---|---|---|
| Non-cancerous cell lines | Cancer cell lines | ||||
| HEK293T | HaCat | MCF7 | DU145 | A549 | |
| Complex 1 | >1000 | >1000 | >1000 | >1000 | >1000 |
| Complex 1M | >1000 | >1000 | 994.22 ± 62.6 | 113.05 ± 42.4 | 464.69 ± 31.3 |
| Complex 2 | >1000 | >1000 | >1000 | >1000 | >1000 |
| Complex 3 | >1000 | >1000 | >1000 | 124, 23 ± 16.20 | >1000 |
| Complex 3M | >1000 | >1000 | 964.21 ± 87.5 | 71.72 ± 13.2 | 615.19 ± 45.0 |
| 2-Pyridinemethanol | >1000 | >1000 | >1000 | >1000 | >1000 |
| 2-Pyridineethanol | >1000 | >1000 | >1000 | >1000 | >1000 |
| 2-Ethylpyridine | >1000 | >1000 | >1000 | >1000 | >1000 |
| Cisplatin | 21.0 ± 1.8 | 13.3 ± 1.1 | 50.9 ± 2.6 | 98.28 ± 1.3 | 56.99 ± 1.3 |
Zeta potential of stable Complex 1M and Complex 3M micelles was determined to be −1.83 ± 0.23 mV and −1.67 ± 0.33 mV (pH = 7.4), respectively. This slightly negative potential results from the uncharged PEO amphiphilic copolymers and it is in agreement with our previous results44 and also these of other researchers.45
Cytotoxicity of the copper(II) complexes (1, 2, 3), starting ligands (2-pyridineethanol, 2-pyridinemethanol, 2-ethylpyridine) and nanoformulations of Cu(II) complexes (complex 1M, complex 3M) was tested in vitro against various cancer cell lines: human lung adenocarcinoma (A549), human breast adenocarcinoma (MCF7), human prostate carcinoma; derived from metastatic site: brain (DU-145). Additionally, complexes 1–3 and starting ligands were tested towards two immortalized human embryonic kidney (HEK293T) and human keratinocyte (HaCat) cell lines. The results of this assay are shown in Table 11 together with the results obtained for cisplatin (the reference drug). We have chosen these types of the cells to our investigation because recently published statistics have shown that for the past two decades lung, breast and prostate cancer – are the most common cancer types.46
As shown in Table 11, neither the ligand itself or the complexes 1 and 2 displayed significant cytotoxicity towards all the tested cancer cell lines in concentration below 1000 μM.
All complexes contain copper ion, however, only 3 exhibits activity toward DU-145 cancer cells whereas 1 and 2 are inactive, what suggests that the chelating ligand also plays a role. The enhanced anticancer activity of complex 3 may result from the introduction of two 2-pyridineethanol molecules, with additional –OH moiety compared to the second ligand, which, as indicated by the results of the experiments described in the next section, increased intracellular copper concentration in cancer cells. It is noteworthy that the two tested copper(II) complexes (1 and 3) did not exhibit toxicity toward HEK293T and HaCat normal cell lines in opposition to 4 which turned out to be highly toxic. Therefore, this compound (4) was not subject to further biological research. In general, the cytotoxicity of the synthesized complex 3 against the human cancer cell lines exhibits similar activity as observed in analogous copper-based complexes.47–49a For example, comparable observations were made by Andrew Kellett et al.47 who prepared Cu(II) complexes with several derivatives; one of the copper complexes was active, while the corresponding ligands were not in 24 h of incubation. Results from this study are similar to our data in that there was a significant variation in the activity of the different compounds towards human cells. Obviously, several copper(II) complexes with much better cytotoxicity against cancer cells have already appeared in the literature.49b,c
The use of liposomal or polymeric formulations loaded with chemotherapeutics significantly increases the therapeutic index of many drugs, and provides the intended drug targeting and controlled release.50,51 To enhance anticancer properties of metal complexes and to control their uptake only by tumor cells over the normal ones, we encapsulated metal compounds into Pluronic P-123 micelles. Of note, the determined IC50 values for complex 1M and complex 3M are one order of magnitude lower than these in case of the corresponding complexes studied in solution for A549 and MCF7 cells, while, in case of the most sensitive line (DU-145), this activity was about 10 times lower for complex 1M. In terms of new drugs development for human use, this information is quite important for the safe and effective use to obtain the desired clinical effect.
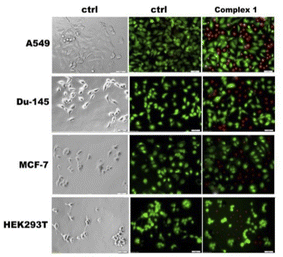
To confirm the determined cytotoxicity, viable and dead cells were survival stained with fluorescein diacetate (FDA) and propidium iodide (PI) after treatment, and the effect was visualized under a fluorescence microscope (Fig. 12). FDA was used as a versatile fluorescent dye in the form of a cell-permanent esterase substrate. Only in viable cells with suitable enzymatic activity fluorescein is intracellularly generated and serves as a viability probe, while PI was applied as a red-fluorescent cell viability dye, which is excluded from live cells with intact membranes, but penetrates dead or damaged cells and binds to DNA and RNA by intercalating between the bases.
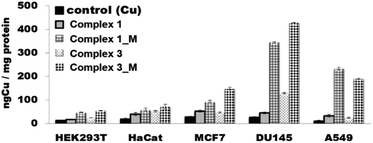
Searching to correlate the cytotoxic activity of the complexes with their ability to enter the cells, the quantitative assessment of the uptake of the compounds in cells was performed by determining their total Cu content using ICP-MS. The delivery of copper into cells is hampered by several specific and non-specific proteins which block theirs entrance. However, once entering the cells copper complexes are capable of inducing apoptosis.52 A comparison of the cytotoxicity data depicted in Table 11 and the cellular uptake data presented in Fig. 13 indicates that the antiproliferative effects of the complexes were slightly more pronounced in DU-145 cells than in others cells (HaCat, HEK293T, A549, MCF7). As it can be evinced from the data reported in Fig. 13, under the same conditions in DU-145 cells, the cellular uptake of complex 1M and complex 3M was greater than non-encapsulated complexes. The fact that compounds can easily enter and accumulate inside cells is very important because cellular uptake is a crucial feature for drug effectiveness.
The generation of reactive oxygen species (ROS) has been cited as a major contributory factor to the high toxicity and anticancer activity of numerous copper complexes.
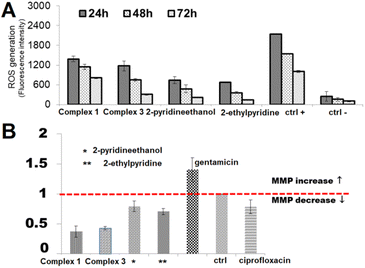
In addition, tumors and normal cells have many different features, e.g. cancer cells are less resistant to oxidative stress than healthy cells and therefore reactive oxygen species (ROS) can be an effective anti-tumor modality and therapeutic target for treating malignancies. They can be produced in physiological processes occurring in the cells or generated as a result of external factors such as drugs, ultraviolet, ionizing radiation or metal ions and complexes.51,53 Therefore, to give insights into the possible mode of action of the ability of complexes (1 and 3) and their ligands (2-pyridineethanol, 2-ethylpyridine) to generate reactive oxygen species were studied. ROS generation was detected with the application of a nonfluorescent 2′,7′-dichlorodihydrofluorescein diacetate (H2DCF-DA) probe as a ROS detector and monitored by fluorescence spectroscopy. The obtained results, presented in Fig. 14A, were related to the fluorescence intensity of positive control cells (K(+); in the presence of extra H2O2) and negative control (K(−); control untreated cells).
All compounds resulted in the production of the amount of ROS compared to negative control in the order complex 1 > complex 3 > 2-pyridineethanol > 2-ethylpyridyne. Of note, the studied complexes induced ROS generation at a significantly higher level than their uncoordinated ligands. The increase in ROS started as early as 24 h after treatment and was detectable throughout the treatment at all-time points tested (24, 48, 72 h). Hence, it appears that the Cu-complexes under investigation may induce oxidative stress in cells. It could be generalized that cytotoxicity of the present complexes is mediated by or due to ROS.
Mitochondrial dysfunction (loss of mitochondrial potential) mainly during oxidative phosphorylation and the antioxidant GSH depletion is one of the major sources of ROS-mediated cell injury in cancer. Changes in mitochondrial membrane potential (ΔΨm) allow the evaluation of the mitochondrial function.51,54 Breakdown of the mitochondrial membrane potential is associated with the opening of the permeability of the membrane transition pores, and release of Cyt-C, Apaf (which can combine with caspase-9 in the cytoplasm) from mitochondria. This interaction usually triggers a cascade of executive caspases (especially caspase 3 responsible for apoptotic cell death).50
Herein, to designate the significance of mitochondrial disorder in ROS production and finally cancer cell death induced by Cu(II) complexes, the variation in the mitochondrial membrane potential (MMP) was monitored using the JC-10 probe (Fig. 14B). Gentamicin, which causes an increase in MMP and ciprofloxacin with its opposite effect on MMP were used as a positive and a negative control, respectively.
In the present study, the decreases in mitochondrial membrane potential were found in complexes and ligands treated cells, which further indicated disruption of mitochondrial membrane integrity. Of all tested compounds, MPM is the most significantly reduced by the starting ligands (2-pyridineethanol, 2-ethylpyridine), while the least effect is caused by the copper complexes (1 and 3) – this trend is opposite to that of ROS generation. Thus, our foregone conclusion can be extended, that the ROS generation and the resulting cell death do not depend on the depletion of MMP.
Conclusions
In this work four copper(II) complexes with 2-ethylpyridine (1 and 2) and with pyridine alcohols (3 and 4) have been synthesized and characterized by X-ray analysis, vibrational spectroscopy, thermal analysis. Magnetic properties have been presented as well. All structural studies have been supported by theoretical computations at the B3LYP level of theory. The structure of square planar geometry 1 is composed of neutral trans-[CuCl2(etpy)2] mononuclear units, where the copper(II) ion is four-coordinate with two monodentate pyridine-based ligands and two chloride anions. Complex 2 crystallizes in the monoclinic space group P21/n and the crystal structure consists of tetranuclear molecules [Cu4OCl6(etpy)4] with well-known [Cu4(μ4-O)(μ2-Cl)] core. The Addison parameter calculated in 3 and 4 confirms the distorted square planar geometry of Cu2+ ion. The vibrational study confirms the results of the X-ray analysis concerning the N-donor type of coordination of the 2-ethylpyridine to the Cu(II) ion in 1 and 2 and N,O-donor type of coordination of the 2-(hydroxyethyl)pyridine to the Cu(II) in 3 and 2-hydroxymethylpyridine in 4, respectively. The EPR spectra confirm the local symmetry of Cu(II) coordination sphere close to the axial and an unpaired electron in the dx2−y2 orbital. The thermal analysis describes the stability of these complexes and we suggest the copper or copper oxide as the residue product after decomposition 1–4. The qualitative investigation of the stability of copper(II) complexes in DMSO solution by measuring UV-Vis and FT-IR spectra of 1–4 after dissolving them in the DSMO solvent was performed. We indicate a similar position of the marker bands found in the solid state complexes 1–4 compared to that in the DMSO solution. Moreover, no new band in the IR spectrum which will prove the replacement of already existing ligands by coordinated DMSO molecule was observed. Consequently, the Cu(II) complexes are stable in the used DMSO solution for 96 hours, which has been examined qualitatively (UV-Vis and FT-IR). The antiferromagnetic behaviour of Cu(II) complexes is shown and the interesting superexchange interactions between each copper(II) ion by the mixed chloride and μ4-O ion pathways in 2 were indicated. In addition, cytotoxicity of all complexes was determined. Complex 2 after being dissolved in a biological medium turns to compound 1, therefore the cytotoxicity of 2 is the same as 1. Compound 3 exhibits moderate activity toward DU-145 cancer cells (human prostate carcinoma) whereas 1 and 2 are inactive, which suggests that the chelating ligand also plays a role. Noteworthy the two tested copper(II) complexes (1 and 3) did not exhibit toxicity toward HEK293T and HaCat normal cell lines. Two (1 and 3) out of four titled complexes were encapsulated into polymeric micelles made of Pluronic P-123, using thin-film hydration method, and their cytotoxicity was tested in vitro against various cancer cell lines. After this procedure, the determined IC50 values for complex 1 and 3 are one order of magnitude lower than these in non-encapsulated, and most importantly in the case of the most sensitive line (DU-145), this activity was about 10 times lower for 1. It could be generalized that cytotoxicity of the presented complexes is mediated by ROS, and the resulting cell death depends on the depletion of MMP. However further, more detailed investigations allowing to understand complete mode of theirs action are needed.Experimental methods
General procedures
CuCl2·2H2O, Cu(CH3COO)2·H2O, 2-ethylpyridine, 2-pyridineethanol and 2-pyridinemethanol were purchased from Sigma-Aldrich, solvents from Avantor (POCH S.A). All reagents were used without further purification.(1):trans-[CuCl2(etpy)2] yield: 0.1325 g, 0.380 mmol (38.0% based on CuCl2·2H2O).
Anal. calcd for 1 (348.75 g mol−1): C, 48.21; H, 5.20; N, 8.03 [%] found: C, 47.82; H, 5.06; N, 8.12 [%].
(2): [Cu4OCl6(etpy)4] yield: 0.2275 g, 0.250 mmol (25.0% based on CuCl2·2H2O)
Anal. calcd for 2 (911.51 g mol−1): C, 36.89; H, 3.98; N, 6.15 [%] found: C, 37.34; H, 3.96; N, 6.01 [%].
[Cu2Cl2(pyet)2] yield: 0.1575 g, 0.356 mmol (35.6% based on CuCl2·2H2O).
Anal. calcd for 3 (442.29 g mol−1): C, 38.02; H, 3.65; N, 6.33 [%] found: C, 37.95; H, 3.80; N, 6.15 [%].
C12H12CuN2O2·(4H2O) Yield: 0.0563 g, 0.16 mmol (32% based on Cu(CH3COO)2·H2O).
Anal. calcd for 4 (351.84 g mol−1): C, 40.96; H, 5.73; N, 7.96 [%] found: C, 40.43; H, 5.58; N, 7.80 [%].
Elemental analysis was performed on a FLASH 2000 CHNS Analyzer.
Electronic absorption spectroscopy was carried out with an UV-Vis spectrophotometer (Agilent Technologies, Cary300 UV-Vis).
In order to record the UV-Vis spectra the complexes were dissolved in DMSO/H2O (9![[thin space (1/6-em)]](https://www.rsc.org/images/entities/char_2009.gif) :
:![[thin space (1/6-em)]](https://www.rsc.org/images/entities/char_2009.gif) 1, v/v) and measured in the intervals 0 (after dissolving), 48 and 96 h. The concentration of compounds was 10−6 M to record the whole range, and 10−4 M to record d–d bands, respectively.
1, v/v) and measured in the intervals 0 (after dissolving), 48 and 96 h. The concentration of compounds was 10−6 M to record the whole range, and 10−4 M to record d–d bands, respectively.
Characterization of copper(II) complexes
The crystal structures have been deposited at the Cambridge Crystallographic Data Centre and allocated the deposition numbers CCDC 2081700 (1), 2081701 (2), 2081702 (3), 2125621 (4).
The ATR spectra of 2% solutions of copper(II) complexes in DMSO, which were obtained by dissolving 10 mg complexes in 500 mL DMSO, were measured in the intervals 1, 24, 48, 72 and 96 h. The procedure was conducted by applying a drop on the diamond plate of the ATR accessory. The measurement parameters were the same as before. Instrument control and initial data processing were performed using OPUS Software (v. 7.5, Bruker Optics, Ettlingen Germany). The FT-Raman spectra of ligands were collected on a Bruker MultiRam spectrometer (Nd:YAG laser with a CW radiation at 1064 nm) equipped with a liquid N2 cooled germanium detector at resolution of 4 cm−1, co-addition of 1024 scans, and laser power values of 300 mW. For all complexes and salts, the spectra were recorded on the Bruker dispersive Raman Spectrometer Senterra coupled with a confocal microscope with 633 nm and 532 nm lasers, lenses of different focal lengths and a sample stage with an automatic shift in the x, y, z directions; enabling in this way spectroscopic mapping of the samples with the positioning accuracy up to 0.0001 mm. The presented spectra were recorded in the range of 4450–45 cm−1 with a resolution of 9–18 cm−1 using 633 and 532 nm exciting laser lines and 25 × 1000 μm aperture, respectively.
Author contributions
M. M.: study conception and design, administrative support, data collection and/or assembly, FT-IR, Raman and TGA data analysis and interpretation, and manuscript writing. A. Ś., B. M.: X-ray measurements and data analysis for crystals. U. K., S. K., A. K.: biological data analysis, data interpretation, and methodology development. A. B.: magnetic measurements, EPR study, data analysis and interpretation, and final approval of the manuscript, D. B.: theoretical computation, manuscript writing and graphical abstract preparation. T. M.: data collection. All authors have read and agreed to the published version of the manuscript.Conflicts of interest
There are no conflicts to declare.Acknowledgements
The work was financially supported by a statutory activity subsidy from the Polish Ministry of Science and Higher Education for the Faculty of Chemistry, Wroclaw University of Science and Technology. The work was supported by the National Science Centre, Poland, under research project “Hydroxyl pyridine derivatives as ligands in Co(II) and Cu(II) complexes of biological and application significance”, 2021/05/X/ST4/00312A. The UV-Vis measurements were carried out with the equipment purchased thanks to the financial support of the Polish National Science Centre (Grant 2016/23/D/ST5/00269). Biological study was partially funded by the Polish National Science Centre (grant number 2020/37/N/ST4/02698). The generous computer time from the Wroclaw Supercomputer and Networking Center is acknowledged.Notes and references
- V. T. Yilmaz, S. Hamamci and C. Thone, Polyhedron, 2004, 23, 841–848 CrossRef CAS.
- N. Lah and I. Leban, Struct. Chem., 2010, 21, 263–267 CrossRef CAS.
- S.-C. Cheng and H.-H. Wei, Inorg. Chim. Acta, 2002, 340, 105–113 CrossRef CAS.
- W. E. Marsh, W. E. Hatfield and D. J. Hodgson, Inorg. Chem., 1982, 21, 2679–2684 CrossRef CAS.
- N. Lah, I. Leban and R. Clérac, Eur. J. Inorg. Chem., 2006, 4888–4894 CrossRef CAS.
- M. Zienkiewicz-Machnik, J. Masternak, K. Kazimierczuk and B. Barszcz, J. Mol. Struct., 2016, 1126, 37–46 CrossRef CAS.
- S. M. Mobin and A. Mohammad, Dalton Trans., 2014, 43, 13032–13040 RSC.
- O. Zeghouan, M. A. Dems, S. Sellami, H. Merazig and J. C. Daran, Acta Crystallogr., Sect. E: Crystallogr. Commun., 2018, E74, 1042–1048 CrossRef PubMed.
- E. Sayın, G. S. Kürkçüoğlu, O. Z. Yeşilel and M. Taş, J. Coord. Chem., 2016, 69, 1226–1235 CrossRef.
- M. C. Biagini, M. Ferrari, M. Lanfranchi, L. Marchiò and M. A. Pellinghelli, J. Chem. Soc., Dalton Trans., 1999, 1575–1580 RSC.
- H. Amouri and M. Gruselle, Chirality in Transition Metal Chemistry: Molecules, Supramolecular Assemblies and Materials, Wiley, Chichester, U.K, 2008 Search PubMed.
- P. Calamai, S. Carotti, A. Guerri, L. Messori, E. Mini, P. Orioli and G. P. J. Speroni, Inorg. Biochem., 1997, 66, 103–109 CrossRef CAS PubMed.
- C. Icsel, V. T. Yilmaz, F. Ari, E. Ulukaya and W. T. Harrison, Eur. J. Med. Chem., 2013, 60, 386–394 CrossRef CAS PubMed.
- A. Jabłońska-Wawrzycka, B. Barszcz, M. Zienkiewicz, M. Hodorowicz, J. Jezierska, K. Stadnicka, Ł. Lechowicz and W. Kaca, Spectrochim. Acta, Part A, 2014, 129, 632–642 CrossRef PubMed.
- N. Aztopal, D. Karakas, B. Cevatemre, F. Ari, C. Icsel, M. G. Daidone and E. Ulukaya, Bioorg. Med. Chem., 2017, 25, 269–276 CrossRef CAS PubMed.
- (a) M. Malik, D. C. Bienko, U. K. Komornicka, A. Kyzioł, M. Dryś, A. Świtlicka, E. Dyguda-Kazimierowicz and W. Jedwabny, J. Inorg. Biochem., 2021, 215, 111311 CrossRef CAS PubMed; (b) B. Morzyk-Ociepa, K. Szmigiel-Bakalarz, M. Nentwig, O. Oeckler, M. Malik-Gajewska, E. Turlej, J. Wietrzyk and D. Michalska, Inorg. Chim. Acta, 2019, 490, 68–77 CrossRef CAS; (c) B. Morzyk-Ociepa, K. Szmigiel, I. Turowska-Tyrk, M. Malik-Gajewska, J. Banach and J. Wietrzyk, Polyhedron, 2018, 153, 88–98 CrossRef CAS; (d) S. S. Massoud, F. R. Louka, M. A. Al-Hasan, R. Vicente and F. A. Mautner, New J. Chem., 2015, 39, 5944–5952 RSC; (e) F. Hasanvand, R. A. Ahmadi and S. Amani, J. Sci., Islamic Repub. Iran, 2012, 23, 37–43 CAS; (f) J. Masternak, M. Zienkiewicz-Machnik, I. Łakomska, M. Hodorowicz, K. Kazimierczuk, M. Nosek, A. Majkowska-Młynarczyk, J. Wietrzyk and B. Barszcz, Int. J. Mol. Sci., 2021, 22, 7286–7313 CrossRef CAS.
- W. Choong and N. C. Stephenson, Cryst. Struct. Commun., 1975, 4, 275–280 CAS.
- A. Okuniewski, D. Rosiak, J. Chojnacki and B. Becker, Polyhedron, 2015, 90, 47–57 CrossRef CAS.
- M. Llunell, D. Casanova, J. Cirera, P. Alemany and S. Alvarez, SHAPE version 2.0., Universitat de Barcelona, 2010 Search PubMed.
- F. F. Awwadi, M. M. Turnbull, M. I. Alwahsh and S. F. Haddad, New J. Chem., 2018, 42, 10642–10650 RSC.
- C. Villa-Perez, I. C. Ortega, A. Velez-Macias, A. M. Payan, G. A. Echeverrıa, D. B. Soria and G. C. Valencia-Uribe, New J. Chem., 2018, 42, 7166–7176 RSC.
- F. Awwadi, R. D. Willett and B. Twamley, Cryst. Growth Des., 2011, 11, 5316–5323 CrossRef CAS.
- A. Amoedo-Portela, R. Carballo, J. S. Casas, E. Garcia-Martinez, A. B. Lago-Blanco, A. Sanchez-Gonzalez, J. Sordo and E. M. Vazquez-Lopez, Z. Anorg. Allg. Chem., 2005, 631, 2241–2246 CrossRef CAS.
- C. F. Macrae, I. J. Bruno, J. A. Chisholm, P. R. Edfinfton, P. McCabe, E. Pidcock, L. Rodriguez-Monge, R. Taylor, J. van de Streek and P. A. Wood, J. Appl. Crystallogr., 2008, 41, 466–470 CrossRef CAS.
- A. W. Addison, T. N. Rao, J. Reedijk, J. Rijn and G. C. Verschoor, J. Chem. Soc., Dalton Trans., 1984, 1349–1356 RSC.
- S. Kashyap, U. P. Singh, A. K. Singh, P. Kumar and S. Pratap Singh, Transition Met. Chem., 2013, 38, 573–585 CrossRef CAS.
- N. S. Gill and M. Sterns, Inorg. Chem., 1970, 9, 1619–1625 CrossRef CAS.
- J. Cirera, P. Alemany and S. Alvarez, Chem.–Eur. J., 2004, 10, 190–207 CrossRef CAS PubMed.
- D. Casanova, J. Cirera, M. Llunell, P. Alemany, D. Avnir and S. Alvarez, J. Am. Chem. Soc., 2004, 126, 1755–1763 CrossRef CAS PubMed.
- B. Antonioli, D. J. Bray, J. K. Clegg, K. A. Jolliffe, K. Gloe, K. Gloe and L. F. Lindoy, Polyhedron, 2007, 26, 673–678 CrossRef CAS.
- R. Dennington; T. A. Keith and J. M. Millam, GaussView, Version 6, Semichem Inc., Shawnee Mission, KS, ( 2016 Search PubMed.
- K. Nakamoto, Infrared and Raman Spectra of Inorganic and Coordination Compounds, Part B, J. Wiley & Sons Inc., New York, 2009 Search PubMed.
- N. F. Chilton, R. P. Anderson, L. D. Turner, A. Soncini and K. S. Murray, J. Comput. Chem., 2013, 34, 1164–1175 CrossRef CAS PubMed.
- O. Kahn, Molecular Magnetism, VCH, New York, 1993 Search PubMed.
- W. E. Marsh, K. C. Patel, W. E. Hatfield and D. J. Hodgson, Inorg. Chem., 1983, 22, 511–515 CrossRef CAS.
- V. H. Crawford, H. W. Richardson, J. /R. Wasson, D. J. Hodgson and W. E. Hatfield, , Inorg. Chem., 1976, 15, 2107–2110 CrossRef CAS.
- B. Graham, M. T. W. Hearn, P. C. Junk, C. M. Kepert, F. E. Mabbs, B. Moubaraki, K. S. Murray and L. Spiccia, Inorg. Chem., 2001, 40, 1536–1543 CrossRef CAS PubMed.
- K. Skorda, T. C. Stamatatos, A. P. Vafiadis, A. T. Lithoxoidou, A. Terzis, S. P. Perlepes, J. Mroziński, C. P. Raptopoulou, J. C. Plakatouras and E. G. Bakalbassis, Inorg. Chim. Acta, 2005, 358, 565–582 CrossRef CAS.
- S. Thakurta, P. Roy, G. Rosair, C. J. Gómez-García, E. Garribba and S. Mitra, Polyhedron, 2009, 28, 695–702 CrossRef CAS.
- M. Grove, J. Sletten, M. Julve and F. Floret, J. Chem. Soc., Dalton Trans., 2001, 2487–2493 RSC.
- M. Barwiolek, A. Kaczmarek-Kędziera, T. M. Muzioł, D. Jankowska, J. Jezierska and A. Bieńko, Int. J. Mol. Sci., 2020, 21, 4587 CrossRef CAS PubMed.
- B. Kozlevčar and P. Šegedin, Croat. Chem. Acta, 2008, 81, 369–379 Search PubMed.
- Ch. Chow, K. Chang and R. D. Willett, J. Chem. Phys., 1973, 59, 2629 CrossRef CAS.
- P. Kołoczek, A. Skórska-Stania, A. Cierniak, V. Sebastian, U. K. Komarnicka, M. Płotek and A. Kyzioł, Eur. J. Pharm. Biopharm., 2018, 128, 69–81 CrossRef PubMed.
- W. Zhang, Y. Shi, Y. Chen, J. Hao, X. Sha and X. Fang, Biomaterials, 2011, 32, 5934–5943 CrossRef CAS.
- National Cancer Institute, posted to the SEER website, SEER Cancer Statistics Review 1975–2018, ed. N. Howlader, A. M. Noone, M. Krapcho, et al., 2021, last accessed 19 April 2021 Search PubMed.
- A. Kellett, O. Howe, M. O'Connor, M. McCann, B. S. Creaven, S. McClean, A. Foltyn-Arfa Kia, A. Casey and M. Devereux, Free Radic. Biol. Med., 2012, 53, 564–576 CrossRef CAS PubMed.
- E. Budzisz, M. Miernicka, I. P. Lorenz, P. Mayer, U. Krajewska and M. Rozalski, Polyhedron, 2009, 28, 637–645 CrossRef CAS.
- (a) S. Gama, F. Mendes, F. Marques, I. C. Santos, M. Fernanda Carvalho, I. Correia, J. C. Pessoa, I. Santos and A. Paulo, J. Inorg. Biochem., 2011, 105, 637–644 CrossRef CAS PubMed; (b) C. Santini, M. Pellei, V. Gandin, M. Porchia, F. Tisato and C. Marzano, Chem. Rev., 2014, 114, 815–862 CrossRef CAS PubMed; (c) C. Molinaro, A. Martoriati, L. Pelinski and K. Cailliau, Cancers, 2020, 12, 2863–2890 CrossRef CAS PubMed.
- A. Kyzioł, A. Cierniak, J. Gubernator, A. Markowski, M. Jeżowska-Bojczuk and U. K. Komarnicka, Dalton Trans., 2018, 47, 1981–1992 RSC.
- S. Kozieł, U. K. Komarnicka, A. Ziółkowska, A. Skórska-Stania, B. Pucelik, M. Płotek, V. Sebastian, A. Bieńko, G. Stochel and A. Kyzioł, Inorg. Chem. Front., 2020, 7, 3386–3401 RSC.
- Q. Zhai, H. Ji, Z. Zheng, X. Yu, L. Sun and X. Liu, J. Cell. Physiol., 2000, 184, 161–170 CrossRef CAS.
- H. Yang, R. M. Villani, H. Wang, M. J. Simpson, M. S. Roberts, M. Tang and X. Liang, J. Exp. Clin. Cancer Res., 2018, 37, 266–275 CrossRef CAS PubMed.
- C. Guo, L. Sun, X. Chen and D. Zhang, Neural Regener. Res., 2013, 8, 2003–2014 CAS.
- G. M. Sheldrick, Crystal structure refinement with SHELXL, Acta Crystallogr., Sect. C: Struct. Chem., 2015, 71, 3–8 Search PubMed.
- F. Neese, Software update: the ORCA program system, version 4.0, WIREs Comput Mol Sci, 2018, 8, p. 1327 Search PubMed.
- M. J. Frisch, G. W. Trucks, H. B. Schlegel, G. E. Scuseria, M. A. Robb, J. R. Cheeseman, G. Scalmani, V. Barone, B. Mennucci, G. A. Petersson, H. Nakatsuji, M. Caricato, X. Li, H. P. Hratchian, A. F. Izmaylov, J. Bloino, G. Zheng, J. L. Sonnenberg, M. Hada, M. Ehara, K. Toyota, R. Fukuda, J. Hasegawa, M. Ishida, T. Nakajima, Y. Honda, O. Kitao, H. Nakai, T. Vreven, J. A. Montgomery Jr., J. E. Peralta, F. Ogliaro, M. Bearpark, J. J. Heyd, E. Brothers, K. N. Kudin, V. N. Staroverov, R. Kobayashi, J. Normand, K. Raghavachari, A. Rendell, J. C. Burant, S. S. Iyengar, J. Tomasi, M. Cossi, N. Rega, J. M. Millam, M. Klene, J. E. Knox, J. B. Cross, V. Bakken, C. Adamo, J. Jaramillo, R. Gomperts, R. E. Stratmann, O. Yazyev, A. J. Austin, R. Cammi, C. Pomelli, J. W. Ochterski, R. L. Martin, K. Morokuma, V. G. Zakrzewski, G. A. Voth, P. Salvador, J. J. Dannenberg, S. Dapprich, A. D. Daniels, Ö. Farkas, J. B. Foresman, J. V. Ortiz, J. Cioslowski and D. J. Fox, Wallingford CT, 2009.
- S. Grimme, J. Antony, S. Ehrlich and H. Krieg, J. Chem. Phys., 2010, 132, 154104 CrossRef PubMed.
- Chemcraft – graphical software for visualization of quantum chemistry computations https://www.chemcraftprog.com Search PubMed.
Footnote |
| † Electronic supplementary information (ESI) available. CCDC 2081700, 2081701, 2081702 and 2125621. For ESI and crystallographic data in CIF or other electronic format see https://doi.org/10.1039/d2ra05133h |
| This journal is © The Royal Society of Chemistry 2022 |

