 Open Access Article
One-step facile preparation of carbon dots with high fluorescence quantum yield and application in rapid latent fingerprint detection†
Xuejing Wang‡
,
Yinyan Yuan‡,
YiXiao Sun,
Xue Liu,
Mingze Ma,
Renyin Zhang and
Feng Shi *
*
College of Life Sciences, Shihezi University, Shihezi 832003, China
First published on 26th September 2022
Abstract
The development of luminescent materials greatly affects the development of fluorescence imaging technology. The preparation of carbon dots (CDs) with high photoluminescence quantum yield (PLQY) in the solid-state is challenging due to excessive resonance energy transfer (RET) and direct π–π interactions. In this study, we synthesized carbon dots that exhibit green fluorescence (GCDs) with absolute PLQYs up to 35.65% in one step by a microwave-assisted method. In the solid-state, the absolute PLQY reached 19.25%. Then, the GCDs were mixed with soluble starch in appropriate proportions, which improved the adsorption and dispersion of the GCDs and greatly reduced the cost of the fingerprint powder, and increased the absolute PLQY of the fingerprint powder to 41.75%. Finally, we prepared GCDs for preliminary fabrication of luminescent films, and the GCD-starch powder was successfully applied to high-quality latent fingerprint (LFP) imaging. The related properties of GCDs and the LFP detection performance of fingerprint detection powders prepared by GCDs were studied in detail. The results showed that the LFP system developed with GCDs-starch powder visualized LFPs with high definition and contrast under different conditions, and GCDs had potential for application in light-emitting devices. This study developed a new type of solid-state luminescent CDs and demonstrated that these GCDs have great application potential for LFP detection. This study may also provide inspiration for other applications based on efficient solid-state fluorescence.
Introduction
A fingerprint is an important clue for criminal justice and forensic identification because of its particularity, stability and uniqueness. It has been known as the “King of Evidence” in investigations of crime scenes.1 Since the late 19th century, fingerprints have been used for personal identification and judicial investigations.2 However, not all fingerprints can be directly captured and easily detected by the naked eye. When exocrine sweat is mixed with oily substances such as sebum on the finger and comes into contact with the surfaces of various objects, the impressions of finger ridges are formed on the surface, which is called a latent fingerprint (LFP).3 Due to the low contrast between LFPs and the background, it is difficult to capture and detect them with the naked eye; visual processing using physical or chemical methods is required.4 Methods for enhanced imaging of latent fingerprints include optical tests, powder tests, iodine fuming, 502 glue fumes, ninhydrin treatment, etc. However, for many complex cases involving fingerprint detection, these methods are not suitable for on-site investigations due to weak adhesion, low sensitivity, inability to detect fingerprints after a long time, high price, and byproducts that pollute the environment.5 With developments in science and technology, fluorescent or photoluminescent materials have attracted widespread attention. Because of its high sensitivity and resolution, fluorescence imaging is widely used in biomedicine,6 chemical sensors,7 lighting8 and other fields; this is especially true of multifunctional solid-state luminescent materials, which have also received extensive attention in the field of LFP identification.Detection of latent fingerprints using fluorescent dyes is a commonly used method. Fluorescent dyes or photoluminescence nanomaterials are sprayed on the fingerprints, and LFP imaging is performed with the contrast from fluorescent signal intensity under excitation light.9 For example, upconversion nanoparticles,10 quantum dots,11 and organic dyes12 have been used for LFP imaging. Although LFP imaging can be realized by using fluorescence, there are many fluorescent materials, such as semiconductor quantum dots and heavy metal dyes, which cause great harm to the environment or exhibit fluorescence quenching due to aggregation in the solid-state.13 This greatly limits their application in LFP imaging recognition. Therefore, it is necessary to prepare a fluorescent material with good environmental compatibility and bright fluorescence in solid-state for LFP imaging.
Recently, carbon dots (CDs) have attracted attention in many fields due to their excellent properties, such as easy preparation, high photostability, strong photoluminescence, good biocompatibility, environmental friendliness, and low preparation cost, which also have applications in LFP imaging.14,15 For example, Chen et al. synthesized red fluorescent carbon dots by a hydrothermal method and dissolved them in dilute hydrochloric acid. Spraying this solution results in a distinct red fluorescent LFP image.16 Compared with traditional organic dyes and semiconductor quantum dots, CDs have been more widely used in optical sensing, drug delivery, bioimaging and other fields due to their metal-free nature, low toxicity and good biocompatibility.17–19 However, most CDs exhibit fluorescence in solution but may exhibit aggregation-induced fluorescence quenching due to resonance energy transfer or direct π–π interactions; this limits the application of CDs in some solid-state imaging fields, such as latent fingerprint imaging detection and manufacture of optical devices.20 For LFP imaging, it is important to provide clear fingerprint images.9 While ensuring proper adsorption between fingerprinting powders and LFPs, it is important to realize proper dispersion of the powder particles and overcome aggregation-caused quenching (ACQ) to provide high fluorescence quantum yields (QYs) and clear LFP images.
In this study, we used a simple one-step microwave-assisted method to synthesize GCDs exhibiting absolute QYs up to 35.65%. In the solid-state, the absolute QY reached 19.25%, and the absolute QY of the fingerprinting powder was as high as 41.75%. These QYs are higher than those of some organic fluorescent dyes and rare-earth metal quantum dots and much higher than those of many solid-state luminescent CDs previously reported. Moreover, fabrication of the luminescent films further proves the great potential of these CDs in various applications involving solid-state luminescence and strong fluorescence.
Experimental section
Materials
Trans-2-hydroxycinnamic acid, DL-cysteine, sodium hydroxide, absolute ethanol, quinine sulfate, soluble starch, methanol, silane coupling agent, epoxy resin, etc., were purchased from Aladdin in Shanghai. All chemicals were used as provided, and all tests were done with water used ultrapure water.Preparation of CDs
Trans-2-hydroxycinnamic acid (1 g), DL-cysteine (0.8 g), and sodium hydroxide (0.8 g) were added to a 50 mL beaker under magnetic stirring, uniformly mixed and dissolved in 10 mL of anhydrous ethanol. The beaker was placed in a microwave oven, and the reaction was carried out at 750 W for 3 min. After the reaction was completed, the beaker was cooled to room temperature. The initial product was centrifuged at 8000 rpm for 10 min, and the supernatant was filtered through a microporous membrane (0.22 μm). Afterwards, the obtained suspension was vacuum freeze-dried to provide a powder for later use. The process for preparation of CDs was optimized with the carbon–nitrogen ratio and sodium hydroxide content.Preparation of CDs-starch powder
The GCD powder and soluble starch prepared in Section 2.2 were weighed and mixed uniformly in excess methanol according at a mass ratio of 1![[thin space (1/6-em)]](https://www.rsc.org/images/entities/char_2009.gif) :
:![[thin space (1/6-em)]](https://www.rsc.org/images/entities/char_2009.gif) 40. GCD-starch solids were collected by precipitation and vacuum freeze-drying, and the obtained solids were ground into powder in a quartz sand mortar for further experiments. Among them, the ratio of GCDs to starch was determined with an optimization experiment, and the relative PLQY in the optimization experiment was obtained with the reference method (calculation of the relative quantum yield of S2) using 0.1 M quinine sulfate as the standard (EX = 380 nm, QY = 54%).21 The excitation wavelength was 380 nm, and the spectral range was 400–750 nm.
40. GCD-starch solids were collected by precipitation and vacuum freeze-drying, and the obtained solids were ground into powder in a quartz sand mortar for further experiments. Among them, the ratio of GCDs to starch was determined with an optimization experiment, and the relative PLQY in the optimization experiment was obtained with the reference method (calculation of the relative quantum yield of S2) using 0.1 M quinine sulfate as the standard (EX = 380 nm, QY = 54%).21 The excitation wavelength was 380 nm, and the spectral range was 400–750 nm.
Detection and imaging of LFPs
All relevant fingerprints involved in this experiment were the same and were taken from the same 23 year-old adult male volunteer. Fingerprint suppliers use hand sanitizer to wash their fingers, gently stroke their foreheads with their fingers, and then pressed their fingers on various substrates, including glass, a bottle cap, and a mobile phone screen. The specific steps for LFP detection were as follows: GCD-starch powder was dipped with a feather brush, and the powder was shaken down onto the fingerprint. The floating powder was gently brushed off, and usually the powder was dispersed on the fingerprint. Under UV irradiation, it emitted bright fluorescence. Photographs were taken of all fingerprints with a camera (Canon, 850D).Fabrication of luminescent films
The silane coupling agent and epoxy resin were uniformly mixed in a certain proportion, and the preprepared GCDs were added. After uniform mixing until defoaming and standing for 24 hours, fluorescent blocks and fluorescent films with good photoluminescence properties were obtained.Characterization
Transmission electron microscopy images were obtained with a Hitachi HT7700 transmission electron microscope, and high-resolution transmission electron microscope images were obtained with a FEI Tecnai G2 F20 high-resolution field emission transmission electron microscope. Particle sizes were measured with Nano Measurer 1.2 software and a CGS-3 dynamic and static laser light scattering instrument. Fluorescence spectra were measured with an F97XP spectrofluorometer. All absolute quantum yields were measured with an Edinburgh-Stable/Transient Fluorescence Spectrometer FLS1000. UV-Vis absorption spectra were measured with a Spectra Max spectrophotometer. Fourier transform infrared (FTIR) spectra were measured with a Nicolet iS-10 FTIR spectrometer. X-ray photoelectron spectroscopy (XPS) was performed with a Thermo ESCALAB 250XI X-ray photoelectron spectrometer. The results of X-ray powder diffraction (XRD) were obtained with a D8 ADVANCE X-ray diffractometer. Fingerprint images were recorded using a camera (Canon, 850D).Results and discussion
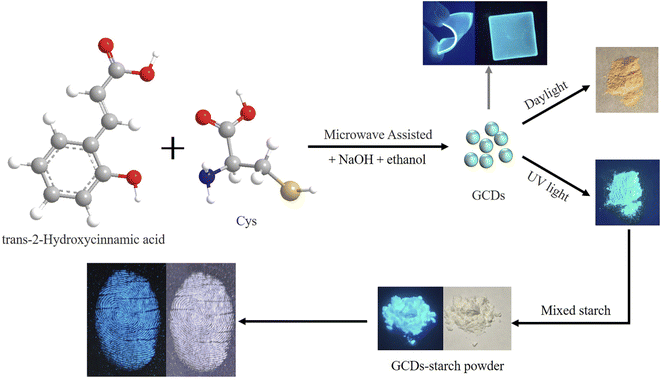
Fig. 1 shows a research route of the whole research, which mainly included four steps: synthesis of the GCD powder, preparation of the GCD-starch powder, acquisition of LFP images, and fabrication of luminescent films. Using trans-2-hydroxycinnamic acid as the carbon source and DL-cysteine as the nitrogen source, they were uniformly mixed in ethanol, and sodium hydroxide was added. CDs emitting green fluorescence were synthesized using microwaves. The carboxyl group of trans-2-hydroxycinnamic acid and the amino group of cysteine were coupled in a condensation reaction, and the resulting material was dehydrated and carbonized to form CDs. Finally, the CD powder emitting green fluorescence was named GCDs. Under UV light, GCD powders emit bright green fluorescence, which indicated that these GCD powders successfully overcame the ACQ effect, and background fluorescence and had good adhesion to produce clear and stable LFPs. In addition, the GCD powder was readily soluble in ethanol and still emitted bright green fluorescence in ethanol solution (inset of Fig. 2b). After mixing with starch, the obtained GCD-starch powder still emitted bright fluorescence under UV irradiation and appeared white under sunlight and blue under UV irradiation (Fig. 1). By applying GCDs in fabrication of luminescent films, stable and bright green fluorescent light-emitting blocks can be obtained (Fig. 1).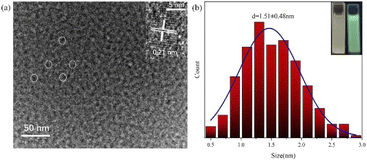 | ||
| Fig. 2 (a) TEM image; ((a), inset) HRTEM image; (b) GCD particle size distribution; ((b), inset) GCDs under sunlight and ultraviolet light. | ||
To clarify the structure and properties, various techniques were used to characterize and analyse the prepared GCDs and GCD-starch powders. The morphology of the GCDs was observed by transmission electron microscopy (TEM) and high-resolution transmission electron microscopy (HRTEM) (Fig. 2a). The TEM image showed that the GCD particles were quasi-spherical. The TEM images were imported into Nano Measurer 1.2, and the sizes of 300 GCD particles were measured. Based on this, the particle size distribution of the GCDs was determined (Fig. 2b), and the average particle size was calculated to be 1.51 ± 0.48 nm. In addition, high-resolution microscopy images (inset of Fig. 2a) showed that the GCDs exhibited lattice fringes with an interplanar spacing of approximately 0.21 nm, which corresponded to the (100) plane of graphitic carbon.22 The results from dynamic light scattering showed that the average GCD particle size was 16.37 nm; this differed considerably from the electron microscope image, which may have been due to aggregation of GCDs to form nanoclusters.23 The GCDs showed a broad and strong peak at approximately 21° (Fig. 3a), which again indicated the presence of a disordered graphitic structure and formation of carbon dots.24–27
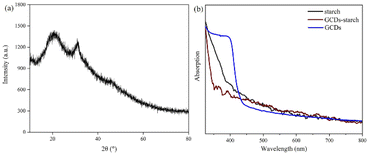 | ||
| Fig. 3 (a) XRD pattern of GCD powder; (b) UV absorption curves of starch, GCDs, and GCD-starch powder. | ||
To determine the optical properties of GCDs and GCD-starch powder, the UV-Vis absorption spectra of starch, GCDs, and GCD-starch powder were compared, as shown in Fig. 3b. The main absorption peak for GCDs was seen at approximately 395 nm. When the starch and GCDs were combined, the peak was blueshifted to approximately 375 nm. When nanoparticles gather in the solid state, the molecular orbitals of the GCDs overlap each other. This overlap reduces the average band gap of the GCDs and causes a redshift of the absorption spectra.28 However, when GCDs were dispersed into a 40-fold excess of starch, the distance between GCDs increased obviously, the redshift was inhibited, and the absorption curve exhibited a blueshift. The blueshift of the peak in Fig. 3b indicated a strong interaction between the GCDs and the starch.
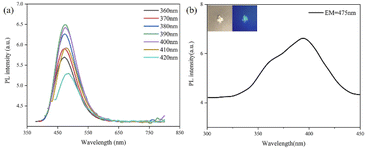
As shown in Fig. 4a, the GCDs showed excitation-independent photoluminescence (PL) emission in ethanol solution with an emission peak at approximately 495 nm; the excitation spectrum of the GCDs was also determined (Fig. 4b), which showed that the optimal excitation wavelength of the GCDs was at approximately 395 nm. The inset of Fig. 5b showed that starch itself did not fluoresce, but GCD-starch retained the fluorescent properties of the GCDs. For example, GCD-starch powders were dispersed in ethanol, and PL spectroscopy was performed. As shown in Fig. 5a, the position of the emission peak was almost unchanged by increasing the excitation wavelength, which indicated that both GCDs and GCD-starch powders exhibited excitation-independent PL emission in solution. Fig. 5b shows the excitation spectrum of the GCD-starch powder, and the results were consistent with the previous analysis.
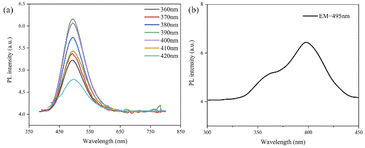 | ||
| Fig. 4 (a) Emission spectra of GCDs at different excitation wavelengths; (b) excitation spectra of GCDs at optimal emission wavelengths. | ||
Generally, after CDs solution is dried into a powder, the fluorescent intensity becomes very weak due to the ACQ. A high PLQY is very important for the development of various applications for CDs. However, the PLQY of solid-state CDs is relatively low compared to liquid-state fluorescence due to the ACQ effect. When the GCD solution was dried into a powder, its fluorescence intensity decreased but remained at a high level. In contrast, the PLQY of GCDs-starch powder measured with 395 nm excitation and an integrating sphere was approximately 41.25%, which is much higher than the PLQYs of many other solid-state CDs and fingerprint detection powders (Table S1†). Generally, due to the quenching effect of aggregated fluorescence, solid-state carbon dots emit weakly or even no fluorescence, which leads to the inability of carbon dots to be directly applied to fingerprint detection. However, when a large amount of starch is combined with carbon dots (CDs), the CDs in the aggregated state are dispersed, and the distance between CDs increases, thereby overcoming the aggregation-induced fluorescence quenching. Similar methods also use silica for dispersion,29 chemical doping dilution,13 and so on.
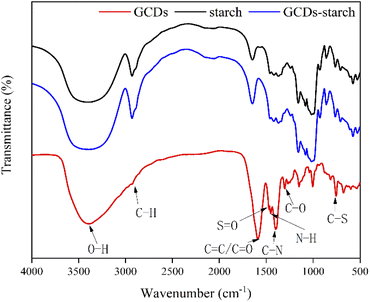
The FTIR spectrum of the GCDs (Fig. 6) showed stretching vibrations for O–H at 3383 cm−1, C–H at 2919 cm−1, C![[double bond, length as m-dash]](https://www.rsc.org/images/entities/char_e001.gif) C/C
C/C![[double bond, length as m-dash]](https://www.rsc.org/images/entities/char_e001.gif) O at 1594 cm−1, N–H at 1455 cm−1, C–N at 1400 cm−1, C–S at 1472 cm−1, S
O at 1594 cm−1, N–H at 1455 cm−1, C–N at 1400 cm−1, C–S at 1472 cm−1, S![[double bond, length as m-dash]](https://www.rsc.org/images/entities/char_e001.gif) O at 1475 cm−1, and C–O at 1300 cm−1.28,30–33 These peaks were also observed in the FTIR spectrum of GCDs-starch, which combined the FTIR peaks for starch, GCDs-starch powder, and GCDs and indicated that GCDs were wrapped around the starch granules (Fig. 6). Therefore, the abovementioned functional groups of GCDs provided the adsorption peaks for the GCDs and starch and fingerprint residues.
O at 1475 cm−1, and C–O at 1300 cm−1.28,30–33 These peaks were also observed in the FTIR spectrum of GCDs-starch, which combined the FTIR peaks for starch, GCDs-starch powder, and GCDs and indicated that GCDs were wrapped around the starch granules (Fig. 6). Therefore, the abovementioned functional groups of GCDs provided the adsorption peaks for the GCDs and starch and fingerprint residues.
The full-range X-ray photoelectron spectra (XPS) (Fig. 7a) demonstrated peaks for C 1s (284.77 eV), N 1s (399.27 eV), O 1s (531.27 eV) and S 2p (163.13 eV) binding energies. The XPS spectrum showed that the elemental contents for C, O, N and S (inset of Fig. 7a) were 76.13%, 19.45%, 2.05% and 2.37%, respectively. In the high-resolution XPS spectrum (Fig. 7b–e), the C 1s band was deconvoluted into four peaks corresponding to the sp2- and sp3-hybridized carbons of C–C/C![[double bond, length as m-dash]](https://www.rsc.org/images/entities/char_e001.gif) C (284.6 eV), C–O/C–S/C–N (285.1 eV), C
C (284.6 eV), C–O/C–S/C–N (285.1 eV), C![[double bond, length as m-dash]](https://www.rsc.org/images/entities/char_e001.gif) O (288.5 eV), and C
O (288.5 eV), and C![[double bond, length as m-dash]](https://www.rsc.org/images/entities/char_e001.gif) O/C
O/C![[double bond, length as m-dash]](https://www.rsc.org/images/entities/char_e001.gif) N (288.1 eV) moieties.27,34,35 The N 1s band was deconvoluted into three peaks at 398.9, 399.5, and 400.0 eV, which represented C
N (288.1 eV) moieties.27,34,35 The N 1s band was deconvoluted into three peaks at 398.9, 399.5, and 400.0 eV, which represented C![[double bond, length as m-dash]](https://www.rsc.org/images/entities/char_e001.gif) N, C–N–C, and N–H moieties,36 respectively, indicating that N atoms were present in the GCDs. The O 1s band contained four peaks at 530.8, 531.5, 532.6 and 535.5 eV, representing C–O, O
N, C–N–C, and N–H moieties,36 respectively, indicating that N atoms were present in the GCDs. The O 1s band contained four peaks at 530.8, 531.5, 532.6 and 535.5 eV, representing C–O, O![[double bond, length as m-dash]](https://www.rsc.org/images/entities/char_e001.gif) S/C
S/C![[double bond, length as m-dash]](https://www.rsc.org/images/entities/char_e001.gif) O, C
O, C![[double bond, length as m-dash]](https://www.rsc.org/images/entities/char_e001.gif) O/C–O and C–OH/C–O–C.37–39 The S 2p band contained four peaks at 162.9, 163.9, 168.3 and 169.3 eV, representing C–S, S 2p1/2, SO3 and S
O/C–O and C–OH/C–O–C.37–39 The S 2p band contained four peaks at 162.9, 163.9, 168.3 and 169.3 eV, representing C–S, S 2p1/2, SO3 and S![[double bond, length as m-dash]](https://www.rsc.org/images/entities/char_e001.gif) O,30,32,40 which clearly indicated the presence of S atoms in the GCDs. These XPS results were consistent with those obtained by FTIR, and the FTIR and XPS investigations indicated that –OH and –NH2 functional groups on the surfaces of the GCDs improved their electronic properties, hydrophilicity, and stability.
O,30,32,40 which clearly indicated the presence of S atoms in the GCDs. These XPS results were consistent with those obtained by FTIR, and the FTIR and XPS investigations indicated that –OH and –NH2 functional groups on the surfaces of the GCDs improved their electronic properties, hydrophilicity, and stability.
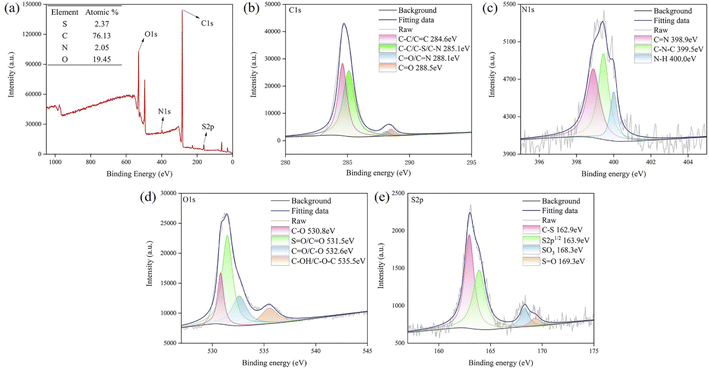 | ||
| Fig. 7 (a) XPS survey spectrum of GCDs; (b–e): N 1s, C 1s, O 1s, and S 2p high-resolution spectra of GCDs; “raw” indicates the data without fitting, and “fitting” indicates data after fitting. | ||
The abundant functional groups on the surfaces of CDs are the sources of their high fluorescence intensities, and FTIR and XPS investigations indicated the presence of –OH and –NH2 functional groups on the surfaces of GCDs. It is well known that surface defects introduced by N and S co-doping affect the graphitization degree of CDs.30,33 Experiments showed that the GCDs and GCDs-starch prepared in this study exhibited strong fluorescence, and our GCDs-starch powder formed a high contrast with the background for LFP detection.
To test whether the GCD-starch powder can be used for LFP imaging, a glass plate was first selected as a substrate for fingerprints and LFP detection. Before performing LFP imaging, we optimized the mass ratio of the carbon and nitrogen sources (Fig. 8a) and the amount of sodium hydroxide added (Fig. 8b) during preparation of the GCDs according to the fluorescence intensities of the GCDs. Finally, based on the relative PLQY of the GCD-starch powder, the quality of latent fingerprint images was optimized for the mass ratio of the GCDs and starch (Fig. S3†). The quality of latent fingerprint images was evaluated based on the feature points found in the resulting latent fingerprint images (S4 fingerprint images at various scales). It was found that the GCD-starch powder with a mass ratio of 1![[thin space (1/6-em)]](https://www.rsc.org/images/entities/char_2009.gif) :
:![[thin space (1/6-em)]](https://www.rsc.org/images/entities/char_2009.gif) 40 had a higher relative quantum yield and clearly enabled observation of the characteristic points of various fingerprint images.
40 had a higher relative quantum yield and clearly enabled observation of the characteristic points of various fingerprint images.
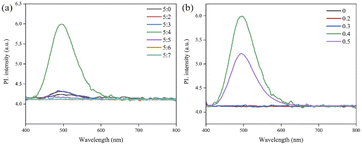 | ||
| Fig. 8 (a) GCD emission spectra for different C/N ratios; (b) GCD emission spectra of GCDs with different amounts of NaOH added. | ||
As shown in Fig. 9, LFPs were successfully detected on glass (Fig. 9a). Due to the high contrast of the fluorescence signal, all of the characteristics and primary structures of the fingerprint, such as the pattern, (Fig. 9b (1)) core point, (Fig. 9b (2)) triangle point, and (Fig. 9b (3)) pattern line, and number of lines can be clearly identified. As we all know, that secondary feature points give fingerprints their uniqueness, which provides the most important identifying information for accurate fingerprint analysis.28 These feature points can be clearly observed in Fig. 10c and are marked as the (1) bifurcation point, (2) endpoint, (3) isolated point, (4) short line, (5) ring point, and (6) bifurcation point. In general, although the three-level structures of fingerprints cannot be used alone to identify a LFP, when certain defects and/or second-level signal ambiguities occur, the third-level feature points provide important reference information for fingerprint identification and matching. In the fingerprint images we obtained, seven scars with different morphologies (Fig. 9a) were found and assigned with three grades. The latent fingerprint image was compared with the fingerprint image of the fingerprint supplier (S5). It was found that the overall and local characteristics of all features in the LFP corresponded, and the similarity was high. Two fingerprints often have the same overall characteristics, but the nodes of fingerprints cannot be completely the same. The figure shows that all of the feature points were identified on the fingerprint image, which also confirmed that the powder obtained in this study can be used for LFP identification. The image of the LFP on the glass plate was not processed by expensive instruments such as a confocal fluorescence microscope; a very clear picture was obtained, and the tertiary information of the fingerprint was observable. Only about 0.25 mg GCDs are needed, a clear fingerprint can be obtained.
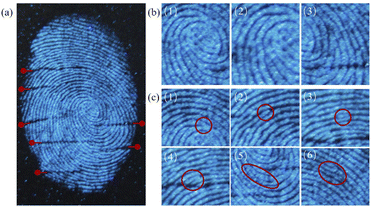 | ||
Fig. 9 (a) LFP on a glass plate shown with GCDs-starch (1![[thin space (1/6-em)]](https://www.rsc.org/images/entities/char_2009.gif) : :![[thin space (1/6-em)]](https://www.rsc.org/images/entities/char_2009.gif) 40); (b) LFP primary structure; (c) LFP secondary structure. 40); (b) LFP primary structure; (c) LFP secondary structure. | ||
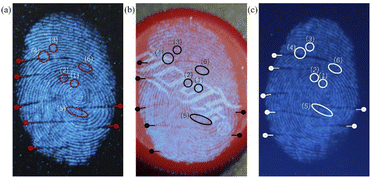 | ||
| Fig. 10 (a) LFP on a glass plate; (b) LFP on a plastic bottle cap; (c) LFP on a mobile phone screen. | ||
To test the performance of GCD-starch powder for LFP imaging, as shown in Fig. 10, several different substrates commonly used in daily life were used for LFP imaging, such as bottle caps and mobile phone screens. The superior performance of the GCDs-starch powder in LFP imaging was proven by observing the fingerprint clarity details. The results showed that most of the details and tertiary features of fingerprints were clearly presented by our synthesized GCD-starch powder, indicating that the GCD-starch powder prepared in this study can be applied to LFP identification.
Finally, a luminescent film synthesized from GCDs also has high fluorescence and emits bright green fluorescence under ultraviolet excitation, indicating that the GCDs involved in this experiment also have certain application prospects for manufacturing of light-emitting devices.
Conclusions
We used a simple one-step synthetic method and optimized the process for preparing carbon dots exhibiting bright green fluorescence by detecting changes in the fluorescence intensity of the GCDs and adjusting the carbon![[thin space (1/6-em)]](https://www.rsc.org/images/entities/char_2009.gif) :
:![[thin space (1/6-em)]](https://www.rsc.org/images/entities/char_2009.gif) nitrogen ratio and the amount of sodium hydroxide added in the synthetic process. Then, a new method for developing a LFP powder comprising GCDs-starch was reported after optimizing the proportions of the GCDs and starch.
nitrogen ratio and the amount of sodium hydroxide added in the synthetic process. Then, a new method for developing a LFP powder comprising GCDs-starch was reported after optimizing the proportions of the GCDs and starch.
Compared with previous reports on LFP fluorescence detection, our current work has made progress in the following ways. First, the low-cost GCDs exhibited a maximum of 35.75% PLQY in ethanol and a 19.25% PLQY in the solid-state. After mixing with starch, the resulting solid exhibited a maximum PLQY of 41.75%. Second, the fluorescent colour of our phosphor is close to green, which can be easily distinguished from the common blue background fluorescence, so it effectively improves the signal accuracy of the dyed LFP. Third, the preparation of GCD-starch powder and LFP imaging process is simple, fast, portable, and widely compatible and are far superior to traditional procedures such as fumigation. By comparing the similarities between the LFP feature points and those of the sample control, the fingerprint was easily and clearly identified. Finally, our material shows good latent fingerprint imaging ability on other materials, such as plastic bottle caps, mobile phone screens and other objects commonly used in daily life, which confirms that our materials and methods can be applied to practical LFP detection and imaging. The luminescent film synthesized from GCDs emits bright green fluorescence upon excitation with ultraviolet light, indicating that the GCDs involved in this experiment also have certain application prospects in the fabrication of light-emitting devices.
Conflicts of interest
There are no conflicts to declare.Acknowledgements
We want to thank the members of the Feng Shi lab for encouragement and support, the teachers of the Analysis and Testing Center for their help. This work was funded by the project of National Natural Science Foundation of China (No. 32060224).Notes and references
- M. Li, P. Lei, S. Song, S. Shuang, R. Wang and C. Dong, Talanta, 2021, 233, 122593 CrossRef CAS PubMed.
- H. FAULDS, Nature, 1880 DOI:10.1038/022605a0.
- S. ODÉN and B. HOFSTEN, Nature, 1954 DOI:10.1038/173449a0.
- P. Hazarika and D. A. Russell, Angew. Chem., Int. Ed. Engl., 2012, 51, 3524–3531 CrossRef CAS PubMed.
- L. Li, L. Shi, Y. Zhang, G. Zhang, C. Zhang, C. Dong, H. Z. Yu and S. Shuang, Talanta, 2019, 196, 109–116 CrossRef CAS PubMed.
- W. Su, R. Guo, F. Yuan, Y. Li, X. Li, Y. Zhang, S. Zhou and L. Fan, J. Phys. Chem. Lett., 2020, 11, 4345 CrossRef CAS PubMed.
- G. Chellasamy, S. R. Ankireddy, K. N. Lee, S. Govindaraju and K. Yun, Mater. Today Bio, 2021, 12, 100168 CrossRef PubMed.
- F. Yuan, P. He, Z. Xi, X. Li, Y. Li, H. Zhong, L. Fan and S. Yang, Nano Res., 2019, 12, 1669–1674 CrossRef CAS.
- H. J. Wang, W. Y. Hou, J. Kang, X. Y. Zhai, H. L. Chen, Y. W. Hao and G. Y. Wan, Dalton Trans., 2021, 50, 12188–12196 RSC.
- Z. Lei, X. Ling, Q. Mei, S. Fu, J. Zhang and Y. Zhang, Adv. Mater., 2020, 32, e1906225 CrossRef PubMed.
- E. Prabakaran and K. Pillay, J. Mater. Res. Technol., 2021, 12, 1856–1885 CrossRef CAS.
- X. Yan, H. Lan, Y. Li, X. Yan, Q. Xing, W. Wang, J. Zhang and S. Xiao, Spectrochim. Acta, Part A, 2021, 254, 119674 CrossRef CAS PubMed.
- Y. Zhai, F. Shen, X. Zhang, P. Jing, D. Li, X. Yang, D. Zhou, X. Xu and S. Qu, J. Colloid Interface Sci., 2019, 554, 344–352 CrossRef CAS PubMed.
- X. Zhang, D. Li, D. Zhou, P. Jing, W. Ji, D. Shen and S. Qu, RSC Adv., 2016, 6, 79620–79624 RSC.
- Y. Ding, X. Wang, M. Tang and H. Qiu, Adv. Sci., 2022, 9, e2103833 CrossRef PubMed.
- J. Chen, J. S. Wei, P. Zhang, X. Q. Niu, W. Zhao, Z. Y. Zhu, H. Ding and H. M. Xiong, ACS Appl. Mater. Interfaces, 2017, 9, 18429–18433 CrossRef CAS PubMed.
- R. S. Tabatabaee, H. Golmohammadi and S. H. Ahmadi, ACS Sens., 2019, 4, 1063–1071 CrossRef CAS PubMed.
- Y. Wang, J. Chen, J. Tian, G. Wang, W. Luo, Z. Huang, Y. Huang, N. Li, M. Guo and X. Fan, J. Nanobiotechnol., 2022, 20, 78 CrossRef CAS PubMed.
- R. Kandra and S. Bajpai, Arabian J. Chem., 2020, 13, 4882–4894 CrossRef CAS.
- L. Yang, Q. Zhang, Y. Han, H. Li, S. Sun and Y. Xu, Nanoscale, 2021, 13, 13057–13064 RSC.
- X. Gong, Y. Liu, Z. Yang, S. Shuang, Z. Zhang and C. Dong, Anal. Chim. Acta, 2017, 968, 85–96 CrossRef CAS PubMed.
- L. Yang, S. Liu, T. Quan, Y. Tao, M. Tian, L. Wang, J. Wang, D. Wang and D. Gao, J. Colloid Interface Sci., 2022, 612, 650–663 CrossRef CAS PubMed.
- A. Abdollahi, H. Roghani-Mamaqani, B. Razavi and M. Salami-Kalajahi, ACS Nano, 2020, 14, 14417–14492 CrossRef PubMed.
- E. Liu, D. Li, X. Zhou, G. Zhou, H. Xiao, D. Zhou, P. Tian, R. Guo and S. Qu, ACS Sustainable Chem. Eng., 2019, 7, 9301–9308 CrossRef CAS.
- J. A. O. Granados, P. Thangarasu, N. Singh and J. M. Vazquez-Ramos, Food Chem., 2019, 278, 523–532 CrossRef CAS PubMed.
- R. Wang, Z. Huang, L. Ding, F. Yang and D. Peng, ACS Appl. Nano Mater., 2022, 5, 2214–2221 CrossRef CAS.
- X. Zhou, Y. Cao, X. Zhou, L. Xu, D. Zhang, C. Wang, F. Chu and T. Qian, Nanomaterials, 2021, 11 Search PubMed.
- X. Y. Dong, X. Q. Niu, Z. Y. Zhang, J. S. Wei and H. M. Xiong, ACS Appl. Mater. Interfaces, 2020, 12, 29549–29555 CAS.
- D. Fernandes, M. J. Krysmann and A. Kelarakis, Chem. Commun., 2015, 51, 4902–4905 RSC.
- C. Wang, D. Sun, Y. Chen and K. Zhuo, RSC Adv., 2016, 6, 86436–86442 RSC.
- Y. Jiang, Y. Wang, F. Meng, B. Wang, Y. Cheng and C. Zhu, New J. Chem., 2015, 39, 3357–3360 RSC.
- K. M. Tripathi, H. T. Ahn, M. Chung, X. A. Le, D. Saini, A. Bhati, S. K. Sonkar, M. I. Kim and T. Kim, ACS Biomater. Sci. Eng., 2020, 6, 5527–5537 CrossRef CAS.
- L. Guo, M. Zhu, Z. He, R. Zhang, S. Kaya, Y. Lin and V. S. Saji, Langmuir, 2022, 38, 3984–3992 CrossRef CAS PubMed.
- Z. Xie, S. Yu, X.-B. Fan, S. Wei, L. Yu, Y. Zhong, X.-W. Gao, F. Wu and Y. Zhou, J. Energy Chem., 2021, 52, 234–242 CrossRef.
- C.-L. Shen, G.-S. Zheng, M.-Y. Wu, J.-Y. Wei, Q. Lou, Y.-L. Ye, Z.-Y. Liu, J.-H. Zang, L. Dong and C.-X. Shan, Nanophotonics, 2020, 9, 3597–3604 CrossRef CAS.
- X. Wen, G. Wen, W. Li, Z. Zhao, X. Duan, W. Yan, J. F. Trant and Y. Li, Mater. Sci. Eng., C, 2021, 123, 112022 CrossRef CAS PubMed.
- K. Zhang, Y. Shi, Y. Jia, P. Li, X. Zhang, X. Feng, L. Zhu, Y. Sun, W. Hu and G. Zhao, J. Photochem. Photobiol., A, 2020, 397, 112548 CrossRef CAS.
- J. Deng, J. Hu, J. Zhao, N. An, K. Liang, Q. Wang, Z. Zhang, R. Wu and F. Zhang, Arabian J. Chem., 2021, 14 Search PubMed.
- H. Yin, D. Gao, Y. Qiu, G. Yi, J. Li, Y. Dong, K. Zhang, Z. Xia and Q. Fu, Nanoscale Adv., 2020, 2, 1483–1492 RSC.
- B. Peng, J. Xu, M. Fan, Y. Guo, Y. Ma, M. Zhou and Y. Fang, Anal. Bioanal. Chem., 2020, 412, 861–870 CrossRef CAS.
Footnotes |
| † Electronic supplementary information (ESI) available. See https://doi.org/10.1039/d2ra05397g |
| ‡ Equal contribution. |
| This journal is © The Royal Society of Chemistry 2022 |

