 Open Access Article
Construction of multifunctional carboxymethyl cellulose nanohydrogel carriers based on near-infrared DNA-templated quantum dots for tumor theranostics†
Yue Zheng‡
*a,
Shengquan He‡b,
Penghui Jin‡b,
Yabiao Gaob,
Ya Di a,
Liming Gaoa and
Jidong Wang
 *b
*b
aThe First Hospital in Qinhuangdao Affiliated to Hebei Medical University, Qinhuangdao, China
bHebei Key Laboratory of Applied Chemistry, Nano-biotechnology Key Lab of Hebei Province, School of Environmental and Chemical Engineering, Yanshan University, Qinhuangdao, China
First published on 7th November 2022
Abstract
Multifunctional therapeutic platforms with targeted delivery, fast diagnosis, and efficient therapy could effectively reduce side effects and improve treatment in the clinical therapy of tumors. Near-infrared DNA-templated CdTeSe quantum dots (DNA-CdTeSe QDs) were developed as building blocks to construct a multifunctional carboxymethyl cellulose (CMC)-based nanohydrogel as a nanocarrier to address the challenges of serious side effects and precise treatment in cancer theranostics, including active tumor targeting, fluorescence tracking, controlled drug release, chemotherapy and gene regulation. Single-stranded DNA containing the complementarity sequence of miRNA and cystine, as co-crosslinkers, initiated hybridization between the DNA-CdTeSe QD-modified CMC chain with the anti-nucleolin aptamer DNA (AS1411)-modified CMC chain to form the hydrogels. DOX, as a model drug, was successfully incorporated into the hydrogels. The synthesized multifunctional hydrogel nanocarriers with an average diameter of 150 nm could be taken up through targeting and achieved the controlled release of DOX by triggering both glutathione (GSH) and miRNA in the tumor microenvironment. The CdTeSe QDs trapped in nanohydrogels acted as fluorophores for bioimaging in the diagnosis and treatment process. The proposed multifunctional delivery system provided a potential platform for tumor imaging and precise therapy.
1. Introduction
With the deepening understanding of cancer, multifunctional therapeutic platforms with targeted delivery, fast diagnosis, and efficient therapy have recently attracted extensive attention owing to their potential application in regulating biodistribution and pharmacokinetics in both chemotherapy and gene therapy.1–3 Among the various types of nanocarriers, nanohydrogels (or hydrogel nanoparticles), used for the delivery of small-molecule drugs, DNA, and fluorescent reagents,4–6 have been extensively investigated in numerous biomedical applications as they combine the size advantages of nanotechnology with the hydrophilicity and flexibility of hydrogels. In recent years, carboxymethyl cellulose (CMC), as an important cellulose derivative polysaccharide, has been accepted as an essential material for the construction of nanohydrogel carriers due to its hydrophilicity, biodegradability, biocompatibility, and easy processing.7,8 However, for cellular uptake, as with most drug nanocarriers, CMC-based nanohydrogel carriers usually depend on passive delivery via the enhanced permeability and retention (EPR) effect,9,10 but this strategy is not suitable for all types of cancers.11 Moreover, some studies have shown that when nanoparticles enter tumors, the inter-endothelial gaps are not responsible for the transport of nanoparticles into solid tumors as described in the EPR effect, but instead they follow an active process through endothelial cells.12 Thus, targeted delivery, as an alternative and necessary route for CMC-based nanohydrogel carriers, can bring drugs to target cells accurately and reduce side effects, providing a potential solution to many challenges in current cancer treatment via the specific binding between target ligands (including antibodies,13 aptamers,14 and growth factors15) and overexpressed receptors or biomarkers on the tumor surface.Aptamers are single-stranded DNA (ssDNA) or RNA molecules commonly comprising 12–80 nucleotides16 generated by the systematic evolution of ligands via exponential enrichment (SELEX),17 which exhibit specific recognition of receptor-mediated tumor cell internalization and strong binding affinity. Moreover, aptamers can be grafted or integrated into polymer (or DNA) nanostructures without chemical modification.18 Foreseeably, if aptamers participate in the construction of CMC-based nanohydrogel carriers, the therapeutic effect of nanomedicine could be improved to a great extent.
In most cases concerning the therapeutic effect of nanocarriers, monitoring the delivery and release of drugs is neglected. If these nanocarriers, including CMC-based nanohydrogels, could be engineered to possess an imaging modality and traced without interfering with normal biological functions, both clinical treatment and basic research could be improved and abundant information on their distribution could be obtained. Fluorescent hydrogels, e.g., quantum dot (QD) polymers and DNA hydrogel/polymer hybrids,19,20 have been exploited for biological applications. Compared with organic dyes, QDs show longer lifetime, longer decay period and unique size-dependent optical properties.21,22 In addition, their excellent photobleaching resistance allows QDs to withstand longer exposure times than organic dyes. Usually, QDs are integrated into hydrogels via chemical conjugation,23 entrapment,24 and polymerization.24 Ma et al.25,26 proposed the route of DNA-templated QDs, and the emission peaks of the DNA-templated QDs were tuned from 500 to 650 nm via optimization of the experimental conditions25,27,28 to penetrate organic tissue easily and accomplish in vivo imaging. Moreover, incorporating DNA-templated QDs to construct self-assembled QD–DNA hydrogels with high quantum yield, long-term photostability and low cytotoxicity for drug delivery, cell-specific targeting and trackability was also reported, which expanded the monitoring applications of nanohydrogel carriers.29
Herein, we developed near-infrared ssDNA1-templated CdTeSe QDs (DNA1-CdTeSe QDs) as a building block to construct multifunctional CMC-based nanohydrogels for nanocarriers to address the challenges of serious side effects and precise treatment in cancer theranostics, including active tumor targeting, fluorescence tracking, controlled drug release, chemotherapy and gene regulation, as shown in Scheme 1. We designed a hybrid ssDNA1 template containing a phosphorothioate domain in the center for the growth of the CdTeSe QDs and two phosphate domains at each end for grafting on the CMC chain and hybridization with crosslinking strands. Then, ssDNA3, as a co-crosslinker containing a complementarity sequence of miRNA and cystine, initiated hybridization between the DNA1-templated CdTeSe QD-modified CMC chain and anti-nucleolin aptamer DNA2 (AS1411)-modified CMC chain to form the hydrogels. DOX was successfully incorporated into the nanohydrogels. After being emulsified, the drug-loaded nanohydrogel aptamer (CdTeSe QDs, DOX)@CMC(cystine,ssDNA3), denoted as AQD@CMC(Cys,DNA), was obtained with an average diameter of 150 nm. The designed multifunctional nanocarriers could be taken up via targeting between the aptamer and nucleolin receptors, which are expressed on cancer cells, and trapped within the lysosomes. Under the condition of rich glutathione (GSH) and miRNA in the tumor, which was similar to the tumor microenvironment, the disulfide bonds in cystine were cut off by GSH, the counter strands of miRNA (DNA3) hybridized with the miRNA strands, the nanohydrogel carriers were disassembled, and DOX was released. Moreover, the CdTeSe QDs acted as fluorophores for bioimaging in the whole delivery process. It was found that AQD@CMC(Cys,DNA) presented uniform size, excellent stability, low toxicity and good biological safety. The proposed multifunctional drug delivery system could effectively reduce side effects and provide a promising platform for cancer theranostics.
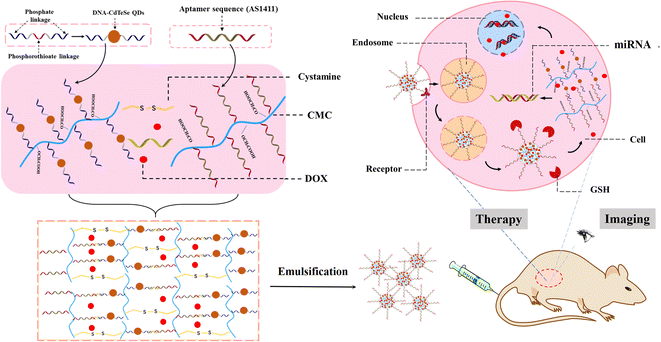 | ||
| Scheme 1 Schematic illustration of multifunctional nanohydrogel carriers based on near-infrared DNA-templated CdTeSe QDs for potential tumor imaging and precise therapy. | ||
2. Experimental section
2.1. Materials
Anhydrous cadmium chloride (CdCl2, 99%), L-cysteine (L-Cys, 99%), selenium powder (Se, 99%), tellurium powder (Te, 99%), sodium borohydride (NaBH4, 98%), sodium tellurite (Na2TeO3, 98%), carboxymethyl cellulose (CMC), Span80 (pharmaceutical grade), Tween80 (pharmaceutical grade), cystamine (Cys, 97%), thiazole blue (MTT, 98%), dimethyl sulfoxide (DMSO) and doxorubicin hydrochloride (98%) were purchased from Aladdin Reagent (Shanghai, China). ssDNA was purchased from Bioengineering (Shanghai, China):DNA1: 5′-NH2-GGT GGT GGT GGT TGT G*G*T* G*G*T* GGT GG TAG CTT ATC-3′
DNA2: 5′-NH2-TTT GGT GGT GGT GGT TGT GGT GGT GGT GG TTT AGA CTG AT-3′
DNA3: 5′-TCA ACA TCA GTC TGA TAA GCT A-3′
(* indicates phosphorothioate linkage).
2.2. Controlled synthesis of near-infrared ssDNA-templated CdTeSe QDs
0.024 mmol CdCl2, 0.0288 mmol L-Cys, 0.005 mmol NaBH4, and 0.012 mmol Na2TeO3 were added to 30 mL ultrapure water with vigorous stirring for 30 min in nitrogen atmosphere (pH 11.0). Then, 1 mL of the above solution was mixed with 10 μL (10 μmol L−1) of ssDNA1 solution and heated to 95 °C in a metal thermostat for 30 min. Next, 6 mL freshly synthesized NaHSe (0.05 mmol) was added and reacted continuously for 15 min. After centrifugation and washing, the ssDNA1-templated CdTeSe QDs were dispersed in PBS solution at 4 °C.2.3. Selection of hydrophile lipophilic balance (HLB) value
Span80 and Tween80 were chosen as surfactants to adjust the characteristics of the microemulsion.30 A two-phase system was proposed to study the emulsifying conditions, in which 2 mL n-hexane was chosen as the oil phase, and 200 μL CMC solution (1%) was chosen as the aqueous phase. The HLB values were calculated using 1 mL mixed surfactants in Span80![[thin space (1/6-em)]](https://www.rsc.org/images/entities/char_2009.gif) :
:![[thin space (1/6-em)]](https://www.rsc.org/images/entities/char_2009.gif) Tween80 mass ratios from 2
Tween80 mass ratios from 2![[thin space (1/6-em)]](https://www.rsc.org/images/entities/char_2009.gif) :
:![[thin space (1/6-em)]](https://www.rsc.org/images/entities/char_2009.gif) 8 to 8
8 to 8![[thin space (1/6-em)]](https://www.rsc.org/images/entities/char_2009.gif) :
:![[thin space (1/6-em)]](https://www.rsc.org/images/entities/char_2009.gif) 2 as follows:
2 as follows:| HLBab = (HLBa × Wa + HLBb × Wb)/(Wa + Wb) |
2.4. Preparation of drug-loaded CMC nanohydrogels
A typical synthesis involved several steps, as follows:(1) QD-grafted CMC solution. 10 μL DNA1-CdTeSe QDs (about 10 μmol) was added to 100 μL 1% CMC1 solution, which was activated by EDC and NHS (EDC![[thin space (1/6-em)]](https://www.rsc.org/images/entities/char_2009.gif) :
:![[thin space (1/6-em)]](https://www.rsc.org/images/entities/char_2009.gif) NHS
NHS![[thin space (1/6-em)]](https://www.rsc.org/images/entities/char_2009.gif) :
:![[thin space (1/6-em)]](https://www.rsc.org/images/entities/char_2009.gif) CMC = 3
CMC = 3![[thin space (1/6-em)]](https://www.rsc.org/images/entities/char_2009.gif) :
:![[thin space (1/6-em)]](https://www.rsc.org/images/entities/char_2009.gif) 3
3![[thin space (1/6-em)]](https://www.rsc.org/images/entities/char_2009.gif) :
:![[thin space (1/6-em)]](https://www.rsc.org/images/entities/char_2009.gif) 1) and agitated for 30 min.
1) and agitated for 30 min.
(2) DNA2-grafted CMC solution. Similarly, 10 μL DNA2 (about 10 μmol) containing the aptamer sequences of AS1411 was added to 100 μL (1%) activated CMC solution (EDC![[thin space (1/6-em)]](https://www.rsc.org/images/entities/char_2009.gif) :
:![[thin space (1/6-em)]](https://www.rsc.org/images/entities/char_2009.gif) NHS
NHS![[thin space (1/6-em)]](https://www.rsc.org/images/entities/char_2009.gif) :
:![[thin space (1/6-em)]](https://www.rsc.org/images/entities/char_2009.gif) CMC = 3
CMC = 3![[thin space (1/6-em)]](https://www.rsc.org/images/entities/char_2009.gif) :
:![[thin space (1/6-em)]](https://www.rsc.org/images/entities/char_2009.gif) 3
3![[thin space (1/6-em)]](https://www.rsc.org/images/entities/char_2009.gif) :
:![[thin space (1/6-em)]](https://www.rsc.org/images/entities/char_2009.gif) 1) and agitated for 30 min.
1) and agitated for 30 min.
(3) Oil-phase solution. 1.038 g mixture of Span80 and Tween80 (mass ratio of the surfactant mixture was Span80![[thin space (1/6-em)]](https://www.rsc.org/images/entities/char_2009.gif) :
:![[thin space (1/6-em)]](https://www.rsc.org/images/entities/char_2009.gif) Tween80 = 5
Tween80 = 5![[thin space (1/6-em)]](https://www.rsc.org/images/entities/char_2009.gif) :
:![[thin space (1/6-em)]](https://www.rsc.org/images/entities/char_2009.gif) 5; HLB = 9.65) was dissolved in 3 mL n-hexane under agitation for 15 min.
5; HLB = 9.65) was dissolved in 3 mL n-hexane under agitation for 15 min.
(4) 10 μL DOX solution (2 mg mL−1) and 10 μL DNA3 (about 10 μmol) were added to the mixture of (1) and (2) under agitation for 30 min. Then, the oil-phase solution (3) was added to the above mixture and reacted for 5 min. Subsequently, 20 μL cystamine solution was added under agitation overnight.
(5) 1–5 mL acetone and ethanol, as demulsifying agents, were mixed with a 3 mL solution of (4) to analyze their demulsification process, effect and mechanism.
2.5. Drug loading efficiency and release
DLE (%) = Wa/Wb × 100![[thin space (1/6-em)]](https://www.rsc.org/images/entities/char_2009.gif) % % |
2.6. Biocompatibility determination of drug-loaded nanohydrogel in vitro
The biocompatibility of the drug-loaded nanohydrogel was determined via a methyl tetrazolium (MTT) cell viability assay. In a typical experiment, HeLa cells were plated on a 96-well plate at a density of 40![[thin space (1/6-em)]](https://www.rsc.org/images/entities/char_2009.gif) 000 cells per well. After overnight culture, 100 μL of different concentrations of nanohydrogel carriers, including A@CMC(Cys), A@CMC(Cys,DNA), AQ@CMC(Cys,DNA), and AQD@CMC(Cys,DNA), were added and then left to incubate for 24 h. Finally, DMSO was used to dissolve formazan crystals, and a microplate reader was used to investigate the absorbance peaks at 490 nm; then, the cell survival rate was calculated to discuss the biocompatibility of the various nanohydrogel carriers. A@CMC(Cys) represents when neither QDs nor DOX were used in the synthesis and Cys was the only crosslinking agent. A@CMC(Cys,DNA) represents when neither QDs nor DOX were used in the synthesis and both Cys and DNA were the crosslinking agents. In AQ@CMC(Cys,DNA), QDs were doped and the co-crosslinking agents of Cys and DNA were used.
000 cells per well. After overnight culture, 100 μL of different concentrations of nanohydrogel carriers, including A@CMC(Cys), A@CMC(Cys,DNA), AQ@CMC(Cys,DNA), and AQD@CMC(Cys,DNA), were added and then left to incubate for 24 h. Finally, DMSO was used to dissolve formazan crystals, and a microplate reader was used to investigate the absorbance peaks at 490 nm; then, the cell survival rate was calculated to discuss the biocompatibility of the various nanohydrogel carriers. A@CMC(Cys) represents when neither QDs nor DOX were used in the synthesis and Cys was the only crosslinking agent. A@CMC(Cys,DNA) represents when neither QDs nor DOX were used in the synthesis and both Cys and DNA were the crosslinking agents. In AQ@CMC(Cys,DNA), QDs were doped and the co-crosslinking agents of Cys and DNA were used.
2.7. Imaging determination in vivo
All animal procedures were performed in accordance with the Guidelines for Care and Use of Laboratory Animals of Yanshan University, and the experiments were approved by the Animal Ethics Committee of Yanshan University. Female Balb/c mice (6–8 weeks) were used for pharmacodynamics studies. 200 μL HeLa cells (2 × 10⁶) were subcutaneously injected into the subaxillary region of mice to prepare a tumor model. Construction of the tumor model: the purchased U14 cervical cancer strain cells were centrifuged at 1000 rpm for 5 min, the supernatant was removed, resuspended in normal saline and inoculated into the abdominal cavity of healthy mice, who were then fed for about 5–7 days. The mice were anesthetized and sacrificed by breaking their necks, and the ascites were removed from the mice. The ascites fluid was diluted twice with normal saline, and each mouse was injected with 200 μL of this solution. When the solid tumors of mice were perceptible, the mice were intravenously injected through the tail vein or tumor site with 200 μL of AQD@CMC(Cys,DNA) (containing 0.5 mg mL−1 CdTeSe QDs; 0.5 mg mL−1 DOX). Fluorescence imaging of these two groups was performed every 10 min under a 550 nm laser light in a dark room.2.8. Determination of therapeutic effect in vivo
U14 cervical cancer strain cells were injected subcutaneously to prepare a tumor-bearing model. When the volume of the tumor reached 150 mm3, the mice were divided into 7 groups (5 mice per group). 200 μL of (a) saline, (b) CMC(Cys,DNA) (c) DOX, (d) QD@CMC(Cys,DNA) and AQD@CMC(Cys,DNA) were injected. DOX was about 0.5 mg mL−1 in batches (b)–(d). The size and weight of the tumor were investigated for two days during treatment. Tumor volume (V) was calculated as follows:| Tumor volume (V) = (tumor length) × (tumor width)2/2 |
| V inhibition rate (%) = (1 − VT/VC) × 100 |
| Relative proliferation rate T/C (%) = VT/VC |
2.9. Statistical analysis
Quantitative data were presented as the mean value with its standard deviation indicated (mean ± SD). Statistical significance (*P < 0.05 or **P < 0.01) was determined using one-way analysis of variance with SPSS 19.0 for Windows (SPSS Inc., Chicago, IL, USA).3. Results and discussion
3.1. Synthesis and characterization of the near-infrared ssDNA1-templated CdTeSe QDs
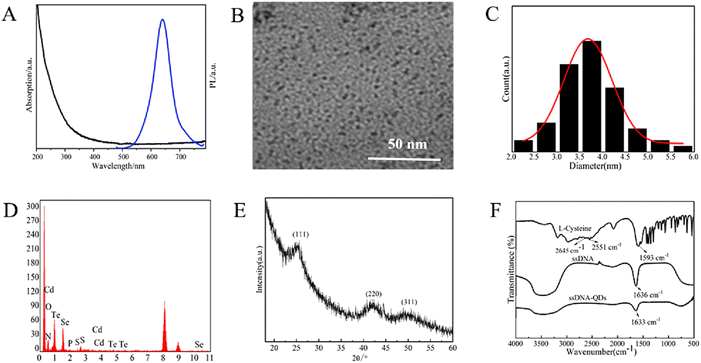
To construct multifunctional nanohydrogels for tumor imaging and precise therapy based on QDs, near-infrared DNA1-CdTe QDs were first prepared by modifying the previously reported protocol into a one-pot method25 and Se was doped successfully at 95 °C (pH = 11), which effectively adjusted the properties of the alloy CdTeSe QDs. The UV-vis absorption and PL spectra of the DNA1-CdTeSe QDs are shown in Fig. 1A. The absorption peak of the DNA1-CdTeSe QDs was at about 570 nm, and the PL peak was at about 650 nm. Based on the empirical formula,31 the size of the CdTeSe QDs was estimated to be about 3.7 nm. The conclusions from the TEM image in Fig. 1B and the size distribution are the same. The Cd, Te, and Se elemental composition of the CdTeSe QDs was identified, as shown in Fig. 1D, and both phosphorus and sulfur elements were confirmed in the components of ssDNA using energy dispersive X-ray spectrometry (EDS), as expected. To investigate the crystal structure of the CdTeSe QDs, their XRD patterns are shown in Fig. 1E. Three distinct diffraction peaks of the CdTeSe QDs appeared at 2θ diffraction angles of 25.04°, 41.94°, and 48.98°, corresponding to the three crystal planes of (111), (220), and (311), indicating the zinc blende structure of the CdTeSe QDs. The wide diffraction peak of the synthesized CdTeSe QDs showed that their size was very small. In the FTIR spectrum (Fig. 1F), the absorption peak at 1636 cm−1 in the spectrum of ssDNA corresponded to the stretching vibration of cytosine C4–C5![[double bond, length as m-dash]](https://www.rsc.org/images/entities/char_e001.gif) C6. In the spectrum of L-Cys, the two absorption peaks at 2645 cm−1 and 2551 cm−1 belonged to the stretching vibration of the S–H bond, and the absorption peak at 1593 cm−1 was attributed to the asymmetric stretching vibration of COO−. Compared with the infrared spectrum of the DNA1-CdTeSe QDs, the stretching vibration absorption peak of the S–H bond in L-Cys disappeared, which indicated that L-Cys was bound to the surface of the CdTeSe QDs through Cd–S bonds. The absorption peak at 1633 cm−1, corresponding to the stretching vibration of cytosine C4–C5
C6. In the spectrum of L-Cys, the two absorption peaks at 2645 cm−1 and 2551 cm−1 belonged to the stretching vibration of the S–H bond, and the absorption peak at 1593 cm−1 was attributed to the asymmetric stretching vibration of COO−. Compared with the infrared spectrum of the DNA1-CdTeSe QDs, the stretching vibration absorption peak of the S–H bond in L-Cys disappeared, which indicated that L-Cys was bound to the surface of the CdTeSe QDs through Cd–S bonds. The absorption peak at 1633 cm−1, corresponding to the stretching vibration of cytosine C4–C5![[double bond, length as m-dash]](https://www.rsc.org/images/entities/char_e001.gif) C6 in ssDNA, also meant that DNA1 as a ligand was successfully capped on the surface of the QDs.
C6 in ssDNA, also meant that DNA1 as a ligand was successfully capped on the surface of the QDs.
3.2. Synthesis and characterization of the AQD@CMC(Cys,DNA) nanohydrogel
![[thin space (1/6-em)]](https://www.rsc.org/images/entities/char_2009.gif) :
:![[thin space (1/6-em)]](https://www.rsc.org/images/entities/char_2009.gif) 8 to 8
8 to 8![[thin space (1/6-em)]](https://www.rsc.org/images/entities/char_2009.gif) :
:![[thin space (1/6-em)]](https://www.rsc.org/images/entities/char_2009.gif) 2, and the corresponding HLB values are shown in Fig. S1.† The emulsification effect of each surfactant was observed. When the HLB values were 11.8 and 12.9, the emulsion was formed while it was very turbid and extremely unstable. This was because when the HLB value is too high, the interfacial tension of the oil phase is not enough to contract into droplets, and the phase interface would not be bent toward the water phase. Theoretically, it was easier to prepare a water-in-oil emulsion when the HLB values were from 4 to 7, and HLB values from 8 to 16 were more suitable for the preparation of an oil-in-water emulsion. In our experiments, the prepared emulsion was still cloudy when the HLB values were either 6.4 or 7.5, probably because the HLB value was too low or the quantity of the oil phase was too little. Fortunately, an oil-in-water emulsion was obtained when the HLB value was 9.65. Moreover, upon irradiating with a light beam, the Tyndall effect of the emulsion was more obvious with an HLB value of 9.65, which indicated that the particle size of the emulsion was larger than that with other HLB values and it would be more stable after being stored. Therefore, the HLB value of 9.65 was chosen for subsequent experiments.
2, and the corresponding HLB values are shown in Fig. S1.† The emulsification effect of each surfactant was observed. When the HLB values were 11.8 and 12.9, the emulsion was formed while it was very turbid and extremely unstable. This was because when the HLB value is too high, the interfacial tension of the oil phase is not enough to contract into droplets, and the phase interface would not be bent toward the water phase. Theoretically, it was easier to prepare a water-in-oil emulsion when the HLB values were from 4 to 7, and HLB values from 8 to 16 were more suitable for the preparation of an oil-in-water emulsion. In our experiments, the prepared emulsion was still cloudy when the HLB values were either 6.4 or 7.5, probably because the HLB value was too low or the quantity of the oil phase was too little. Fortunately, an oil-in-water emulsion was obtained when the HLB value was 9.65. Moreover, upon irradiating with a light beam, the Tyndall effect of the emulsion was more obvious with an HLB value of 9.65, which indicated that the particle size of the emulsion was larger than that with other HLB values and it would be more stable after being stored. Therefore, the HLB value of 9.65 was chosen for subsequent experiments.The droplet size of the microemulsion is influenced directly by the amount of surfactant, which decides the diameter of the nanohydrogel particles. Under the same condition, the mass ratio of the surfactant mixture (Span80![[thin space (1/6-em)]](https://www.rsc.org/images/entities/char_2009.gif) :
:![[thin space (1/6-em)]](https://www.rsc.org/images/entities/char_2009.gif) Tween80 = 5
Tween80 = 5![[thin space (1/6-em)]](https://www.rsc.org/images/entities/char_2009.gif) :
:![[thin space (1/6-em)]](https://www.rsc.org/images/entities/char_2009.gif) 5; HLB: 9.65) in the oil phase varied from 10% to 80%. When the amount of surfactant was 50–60% that of the oil phase, a transparent emulsion was obtained. Overnight, a small amount of precipitate appeared at the bottom of the emulsion at 60% surfactant, while the emulsion at 50% was still clear and transparent. Therefore, the amount of agent was chosen as 50% the mass of the oil phase. Demulsification is an essential process for the separation and purification of hydrogels, and ethanol was selected as the demulsifying agent to analyze the demulsification process, effect and mechanism, as shown in Table S1.† Based on the discussion above, ethanol was the best choice for the demulsifying agent.
5; HLB: 9.65) in the oil phase varied from 10% to 80%. When the amount of surfactant was 50–60% that of the oil phase, a transparent emulsion was obtained. Overnight, a small amount of precipitate appeared at the bottom of the emulsion at 60% surfactant, while the emulsion at 50% was still clear and transparent. Therefore, the amount of agent was chosen as 50% the mass of the oil phase. Demulsification is an essential process for the separation and purification of hydrogels, and ethanol was selected as the demulsifying agent to analyze the demulsification process, effect and mechanism, as shown in Table S1.† Based on the discussion above, ethanol was the best choice for the demulsifying agent.
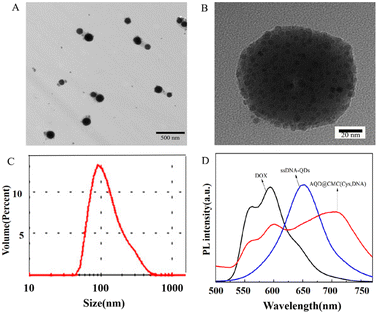
The DNA-CdTeSe QDs were successfully trapped in the nanohydrogel via DNA1 grafting on CMC, which exhibited uniform distribution as a few black particles with a diameter of 4–5 nm. The appearance of the AQD@CMC(Cys,DNA) nanohydrogel was spherical with the CdTeSe QDs on the inside, which indicated that the ssDNA on the surface of the QDs had been grafted on CMC to form the nanohydrogel. The measurement results of dynamic light scattering (DLS) are shown in Fig. 2C, and the size of the AQD@CMC(Cys,DNA) nanohydrogel was mainly distributed around 136.5 nm. The average diameter was about 133.5 nm, and the particle dispersion coefficient (PDI) was 0.255, which indicated good dispersibility. It is known that during the preparation of the TEM sample, plenty of water in the nanohydrogel is lost due to evaporation. That is why the hydrodynamic diameter of the nanohydrogel was slightly bigger than that from the TEM investigation. The size and distribution of the AQD@CMC(Cys,DNA) nanohydrogels demonstrated that the choice of emulsifying agent and optimization of synthetic conditions successfully provided a formulation environment of microemulsion for the growth of the hydrogel. Moreover, the size of the hydrogel was less than 200 nm, which would facilitate passive accumulation in cancerous areas and the uptake of cancer cells through the EPR effect. Fig. 2D shows the fluorescence emission spectra of pure DOX, pure DNA1-CdTeSe QDs and drug-loaded AQD@CMC(Cys,DNA) nanohydrogels in PBS buffer. Fluorescence emission peaks of the drug-loaded AQD@CMC(Cys,DNA) nanohydrogels appeared at about 563, 593 and 703 nm. The fluorescence emission peak at 703 nm came from the red shift of the DNA1-CdTeSe QDs in the nanohydrogels. As discussed above, the emission peak of the DNA1-CdTeSe QDs appeared at 670 nm, as shown in Fig. 1A. The main reason might be that the surface groups of the QDs were affected by CMC in the nanohydrogel structure during the process of both grafting and gel formation, resulting in the energy loss of excited electrons. Although the fluorescence peak positions of DOX molecules and QDs are relatively stable, the intensity of both in the nanohydrogel was obviously weakened, which indicated that the structure of the nanohydrogel would shield the fluorescence to some extent. According to the figure, there was definite evidence that DOX was loaded in the nanohydrogel and the ssDNA on the surface of the QDs participated in the formation process of the nanohydrogel.
To investigate the loading rate of DOX, a standard curve and linear regression equation (A = 0.03905C + 0.03743; A, absorbance intensity of DOX; C, concentration of DOX; concentration range of DOX: 2.5–20 μg mL−1; R2: 0.994) based on the UV absorption intensity and concentration of DOX in PBS were obtained, in which the characteristic absorption peak was at 482 nm. Based on these, DOX in the DNA nanohydrogel supernatant was characterized, and the DOX loading rate of the AQD@CMC(Cys,DNA) nanohydrogel was calculated to be 84.05%. An important advantage of the multifunctional nanohydrogel is the on-command or controllable drug release under external stimulus in order to reduce the side effects of the drug.
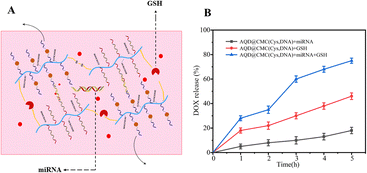
The on-command drug-loaded nanohydrogel release in vitro could be spatiotemporally controlled by modulating GSH and miRNA, as shown in Fig. 3A. Cancer cells are known to generate a large amount of GSH, and the depletion of intracellular GSH might induce ROS-mediated tumor cell death.32 GSH could cleave disulfide bonds in the AQD@CMC(Cys,DNA) nanohydrogels. As shown in Fig. 3B, the AQD@CMC(Cys,DNA) nanohydrogel was cleaved in GSH (5 mM) solution under agitation, and DOX was released for 5 h at an increased rate. It was observed that after 2 h, the drug release rate (60%) increased again after being slow. We speculate that the degradation of framework materials would facilitate release. Furthermore, the combined effect of GSH and miRNA would accelerate these processes, and the release rate of DOX reached 80% at about 5 h.
3.3. In vitro cell experiments
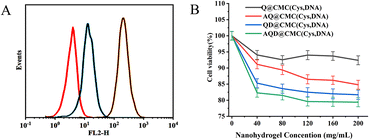
To investigate the targeting of the drug-loaded nanohydrogels, the uptake rates of HeLa cells for three hydrogel samples were determined using flow cytometry. The fluorescence intensities of AQD@CMC(Cys,DNA) (green line), QD@CMC(Cys,DNA) (blue line) and QD@CMC(Cys) (red line) are shown in Fig. 4A. The fluorescence intensity of AS1411 aptamer–drug-loaded nanohydrogels, AQD@CMC(Cys,DNA), was the highest, which demonstrated that HeLa cells exhibited better uptake effect as the aptamer sequences in the nanohydrogels could specifically target HeLa cells. These results demonstrate that the targeted AQD@CMC(Cys,DNA) was more easily accumulated in the cells compared to the nontargeted nanohydrogels under the same incubation conditions.A biocompatibility test was performed using the methyl tetrazolium (MTT) method, as shown in Fig. 4B. The HeLa cell survival rates when Q@CMC(Cys,DNA), AQ@CMC(Cys,DNA), QD@CMC(Cys,DNA) and AQD@CMC(Cys,DNA) were incubated with HeLa cells were investigated (the gel concentration was 50–250 μg mL−1). There was 93.32%, 89.50%, 84.50% and 82.30% cell survival in the Q@CMC(Cys,DNA)-, AQ@CMC(Cys,DNA)-, QD@CMC(Cys,DNA)- and AQD@CMC(Cys,DNA)-treated groups (with nanogel concentrations of 80 μg mL−1), respectively. Among the groups, the empty nanohydrogel carriers, i.e., Q@CMC(Cys,DNA) and AQ@CMC(Cys,DNA), exhibited lower toxicity at the same concentration, although there were heavy metal elements present in the CdTeSe QDs doped in the hydrogel, indicating their good biocompatibility.33
3.4. In vivo cell experiments
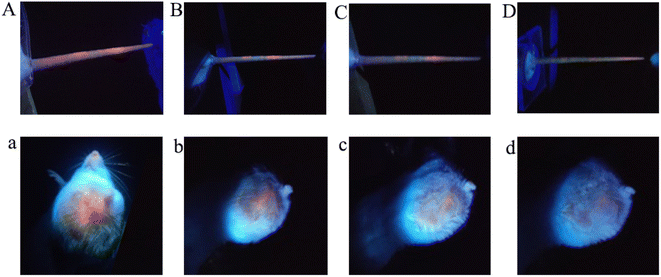
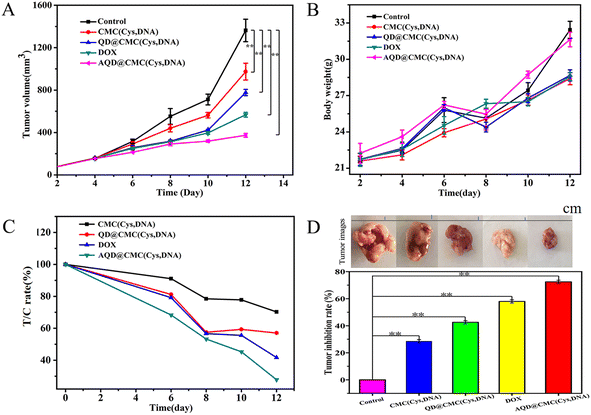
To evaluate the potential of imaging-guided therapy, in vivo fluorescence imaging of AQD@CMC(Cys,DNA) was investigated on a mouse tumor model inoculated with 4T1 cervical cancer tumor strain cells. After injecting AQD@CMC(Cys,DNA) through the tail vein (0.098 mg per kg ICG), the fluorescence signals at 0, 120, 180 and 240 min were determined. As shown in Fig. 5A, the fluorescence signal in red reached the highest intensity in tail tissues at the start of the experiment. Then, the fluorescence signals decreased gradually and almost disappeared at 240 min, as shown in Fig. 5B–D. However, to our regret, we could not trace AQD@CMC(Cys,DNA) in the body of the mice using fluorescence imaging after tail injection. We speculate that the quantity of QDs in AQD@CMC(Cys,DNA) was too little after being distributed through the blood around the body, leading to a weak ability for imaging. Tumor area injection indicated a similar fluorescence process. As shown in Fig. 5a–d, the tumor showed the highest fluorescence intensity and then weakened with time. Therefore, AQD@CMC(Cys,DNA) achieved fluorescence imaging with higher imaging noise, indicating its strong potential as a fluorescence nanoprobe for in vivo imaging.To explore the chemotherapeutic effect of AQD@CMC(Cys,DNA), antitumor experiment was performed using a U14 cervical cancer strain mouse model. Fig. 6A shows that the size of the tumor using CMC(Cys,DNA) was about 30% which was smaller than the size of the control group, showing an antitumor effect. The QD@CMC(Cys,DNA) group exhibited a better effect than the CMC(Cys,DNA) group. As expected, using AQD@CMC(Cys,DNA), the size of the tumor was only 20% that of the control group, exhibiting the best antitumor efficacy. The body weight was also investigated for drug toxicity (Fig. 6B). No significant change in body weight of the mice was noted when treated with CMC(Cys,DNA), QD@CMC(Cys,DNA), DOX, and AQD@CMC(Cys,DNA), which demonstrated the low toxicity of the synthesized multifunctional drug-loaded nanohydrogel delivery system. The tumor relative proliferation ratio T/C (%) and tumor volume inhibition rate of mice that received different treatments are shown in Fig. 6C and D, respectively. As observed, the tumor volume inhibition rate is ≥60% and T/C (%) ratio is ≤40%, showing that the treatment was effective. AQD@CMC(Cys,DNA) exhibited a relative tumor proliferation rate of 28.2% during the experiment, which demonstrated that the AQD@CMC(Cys,DNA) group experienced the expected treatment effect. Photographs of the tumors being treated provide direct proof of the capability of the different nanocarriers for the treatment of tumors, as shown in Fig. 6D. The tumor size was the smallest with AQD@CMC(Cys,DNA), which demonstrated that it is an excellent carrier owing to the high-efficiency accumulation of the aptamer and uptake into the tumor. Moreover, combinational therapy derived from both the GSH trigger and antitumor effect of the miR21 gene was achieved. Therefore, the CMC-based nanohydrogel would be an excellent and multifunctional nanocarrier for cancer theranostics.
4. Conclusions
In this work, we designed a QD-based multifunctional fluorescent nanohydrogel as a carrier and discussed its potential application in chemotherapy and gene therapy. Near-infrared DNA1-CdTeSe QDs were synthesized for the first time, and DNA1 was grafted on CMC strands. Through the co-crosslinkers cystine and ssDNA3, DNA1 hybridized with DNA2, which contained the AS141 sequence, and grafted on CMC strands to construct the CMC-based hydrogel. As a model drug, DOX was embedded, and the nanohydrogel carriers were obtained after emulsification. The nanohydrogel carriers with a diameter of about 150 nm and drug loading rate of 84.05% exhibited good targeting, controlled release, biocompatibility and antitumor properties. Moreover, the DNA1-CdTeSe QDs were doped in the nanohydrogel carriers for fluorescence imaging of the whole delivery process, which provided an interesting application of trackability and monitoring. Compared with traditional drug carriers, the multifunctional nanohydrogel carrier exhibited synergistic tumoricidal efficacy and effectively reduced side effects in cancer theranostics.Data availability
All data generated or analyzed during this study are included in this published article.Author contributions
Conception and design: P. H. Jin; funding support: J. D. Wang, Yue Zheng; methodology: Ya Di; data analysis: S. Q. He; writing: P. H. Jin; administrative, technical, or material support: Liming Gao; final approval of manuscript: J. D. Wang and Yue Zheng. All authors read and approved the final manuscript.Conflicts of interest
There are no conflicts to declare.Acknowledgements
This work was supported by the Key Research and Development Plan of Hebei Province (No. 203777114D, 213777111D), the National Natural Science Foundation of China (No. 62071413), Hebei Natural Science Foundation (No. F2020203056), and the Hebei education department key project (No. ZD2020147).Notes and references
- G. Zhu, J. Zheng, E. Song, M. Donovan, K. Zhang, C. Liu and W. Tan, Proc. Natl. Acad. Sci., 2013, 110, 7998 CrossRef CAS PubMed.
- R. Zhao, X. Liu, X. Yang, B. Jin, C. Shao, W. Kang and R. Tang, Adv. Mater., 2018, 30, 1870202 CrossRef.
- Y. Lu, A. A. Aimetti, R. Langer and Z. Gu, Nat. Rev. Mater., 2016, 2, 16075 CrossRef.
- A. V. Kabanov and S. V. Vinogradov, Angew. Chem., Int. Ed., 2009, 48, 5418–5429 CrossRef CAS PubMed.
- S. Imai, Y. Hirai, C. Nagao, M. Sawamoto and T. Terashima, Macromolecules, 2018, 51, 398–409 CrossRef CAS.
- S. Imai, M. Takenaka, M. Sawamoto and T. Terashima, J. Am. Chem. Soc., 2019, 141, 511–519 CrossRef CAS PubMed.
- A. Hebeish, M. Hashem, M. M. A. Elhady and S. Sharaf, Carbohydr. Polym., 2013, 92, 407–413 CrossRef CAS PubMed.
- C. Wang, M. Tian, Y. Xin, X. Zhang and X. Yang, Cellulose, 2019, 26, 8025–8036 CrossRef CAS.
- J. Huang and X. Jiang, ACS Appl. Mater. Interfaces, 2018, 10, 361–370 CrossRef CAS PubMed.
- Z. Bao, C. Xian, Q. Yuan, G. Liu and J. Wu, Adv. Healthcare Mater., 2019, 8, 1900670 CrossRef PubMed.
- W. W. Grabow and L. Jaeger, Nat. Mater., 2012, 11, 268–269 CrossRef CAS PubMed.
- S. Sindhwani, A. M. Syed, J. Ngai, B. R. Kingston, L. Maiorino, J. Rothschild, P. MacMillan, Y. Zhang, N. U. Rajesh, T. Hoang, J. L. Y. Wu, S. Wilhelm, A. Zilman, S. Gadde, A. Sulaiman, B. Ouyang, Z. Lin, L. Wang, M. Egeblad and W. C. W. Chan, Nat. Mater., 2020, 19, 566–575 CrossRef CAS PubMed.
- J. C. Kang, W. Sun, P. Khare, M. Karimi, X. Wang, Y. Shen, R. J. Ober and E. S. Ward, Nat. Biotechnol., 2019, 37, 523–526 CrossRef CAS PubMed.
- J. Zhou and J. Rossi, Nat. Rev. Drug Discovery, 2017, 16, 181–202 CrossRef CAS PubMed.
- S. Santra, C. Kaittanis, O. J. Santiesteban and J. M. Perez, J. Am. Chem. Soc., 2011, 133, 16680–16688 CrossRef CAS PubMed.
- N. Annabi, A. Tamayol, J. A. Uquillas, M. Akbari, L. E. Bertassoni, C. Cha, G. Camci-Unal, M. R. Dokmeci, N. A. Peppas and A. Khademhosseini, Adv. Mater., 2014, 26, 85–124 CrossRef CAS PubMed.
- A. D. Ellington and J. W. Szostak, Nature, 1990, 346, 818–822 CrossRef CAS PubMed.
- R. Chhabra, J. Sharma, Y. Liu, S. Rinker and H. Yan, Adv. Drug Delivery Rev., 2010, 62, 617–625 CrossRef CAS PubMed.
- L. Zhang, S. R. Jean, S. Ahmed, P. M. Aldridge, X. Li, F. Fan, E. H. Sargent and S. O. Kelley, Nat. Commun., 2017, 8, 381 CrossRef PubMed.
- Y. Zhao, X. Zhao, B. Tang, W. Xu, J. Li, J. Hu and Z. Gu, Adv. Funct. Mater., 2010, 20, 976–982 CrossRef CAS.
- J. Wang, Z. Gao, S. He, P. Jin, D. Ma, Y. Gao, L. Wang and S. Han, Nanotechnology, 2020, 31, 24LT02 CrossRef CAS PubMed.
- J. Wang, X. Wang, H. Tang, S. He, Z. Gao, R. Niu, Y. Zheng and S. Han, Sens. Actuators, B, 2018, 272, 146–150 CrossRef CAS.
- J. B. Lee, Y. H. Roh, S. H. Um, H. Funabashi, W. Cheng, J. J. Cha, P. Kiatwuthinon, D. A. Muller and D. Luo, Nat. Nanotechnol., 2009, 4, 430–436 CrossRef CAS PubMed.
- J. Zhou and H. Li, ACS Appl. Mater. Interfaces, 2012, 4, 721–724 CrossRef CAS PubMed.
- W. Wei, X. He and N. Ma, Angew. Chem., Int. Ed., 2014, 53, 5573–5577 CrossRef CAS PubMed.
- Y. Zheng, X. Wang, S. He, Z. Gao, Y. Di, K. Lu, K. Li and J. Wang, Biosens. Bioelectron., 2019, 126, 261–268 CrossRef CAS PubMed.
- N. Ma, E. H. Sargent and S. O. Kelley, Nat. Nanotechnol., 2008, 4, 121 CrossRef PubMed.
- G. Tikhomirov, S. Hoogland, P. E. Lee, A. Fischer, E. H. Sargent and S. O. Kelley, Nat. Nanotechnol., 2011, 6, 485–490 CrossRef CAS PubMed.
- L. Zhang, J. Lei, L. Liu, C. Li and H. Ju, Anal. Chem., 2013, 85, 11077–11082 CrossRef CAS PubMed.
- H. Qiu, H. Guo, D. Li, Y. Hou, T. Kuang and J. Ding, Trends Biotechnol., 2020, 38, 579–583 CrossRef CAS PubMed.
- W. W. Yu, L. Qu, W. Guo and X. Peng, Chem. Mater., 2003, 15, 2854–2860 CrossRef CAS.
- J. Noh, B. Kwon, E. Han, M. Park, W. Yang, W. Cho, W. Yoo, G. Khang and D. Lee, Nat. Commun., 2015, 6, 6907 CrossRef CAS PubMed.
- Y. Xuan, X.-L. Song, X.-Q. Yang, R.-Y. Zhang, Z.-Y. Song, D.-H. Zhao, X.-L. Hou, J. An, X.-S. Zhang and Y.-D. Zhao, Chem. Eng. J., 2019, 375, 122000 CrossRef CAS.
Footnotes |
| † Electronic supplementary information (ESI) available. See DOI: https://doi.org/10.1039/d2ra05424h |
| ‡ These authors contributed equally. |
| This journal is © The Royal Society of Chemistry 2022 |

