 Open Access Article
Multi-response gelation based on the molecular assembly of Sudan I dye derivatives for phase selective gelators and chemosensors†
Ban-Peng Cao a,
Xue-Wen Shia,
Haixin Dinga,
Ya-Min Wua,
Kenta Matsumoto
 b,
Hiroaki Okamoto
 *b and
Qiang Xiao
 *a
*a
aJiangxi Key Laboratory of Organic Chemistry, Jiangxi Science and Technology Normal University, Nanchang 330013, China. E-mail: xiaoqiang@tsinghua.org.cn
bGraduate School of Sciences and Technology for Innovation, Yamaguchi University, 2-16-1 Tokiwadai, Ube 755-8611, Japan. E-mail: oka-moto@yamaguchi-u.ac.jp
First published on 23rd November 2022
Abstract
Sudan I dye-based smart low molecular weight gelators with/without a perfluoroalkyl group have been successfully synthesized and characterized by rheological measurements, scanning electron microscopy (SEM), IR, and NMR spectroscopies. The gelation behaviors in response to temperature, pH changes, metal cations, and UV-vis light irradiation are investigated. Compounds 1 and 2 could selectively sense the Cu2+ cation in the presence of other metal cations. Moreover, compound 2 with a perfluoroalkyl group shows phase selective gelation ability. This work also provides a valuable reference for exploiting photosensitive materials as chemosensors.
Introduction
As a type of smart material, physical gels based on a low molecular weight gelator (LMWG) have received increasing exposure and attention in recent years.1 Generally, physical gels can be formed by self-assembling LMWG molecules into three-dimensional networks through secondary bonds, such as hydrogen bonding, π–π stacking, electrostatic, van der Waals, coordination, and so on.2 The reversibility of the secondary binding forces indicates that LMWGs are efficiently utilized in designing advanced functional smart materials by external stimuli, such as thermal and chemical stimuli and photoirradiation.3As functional smart materials, phase selective gelators (PSGs) can repair the environment, using extraction and adsorption to remove contaminants from industrial wastewater.4,5 Since the first example was reported by Bhattacharya and Krishnan-Ghosh,6 different kinds of PSGs have been developed.7,8 The main driving force for the self-assembly of PSGs consists of the protic intermolecular hydrogen bond.7 Interestingly, many studies on LMWGs, even PSGs, having per- and/or semifluoroalkyl (Rf) groups without hydrogen bond group, have been published in the past few years.9–17 The soft materials containing Rf can show particular properties by the interplay of structural variations. It is well proven that Rf groups with distinctive properties of hydrophobic or fluorophilic/solvophobic interactions play a significant role in gelation property.11
To explore multi-stimuli responsive gels, labile functional groups are integrated into the structure of the molecules.18 For example, introducing photoresponsive functional groups such as azo group, thienyl group, imine or azomethine functional group, and disulfide group into gelator molecules leads to photo-stimuli molecular gelators capable of forming photoresponsive gels.19 Although the azo group is a typical photoresponsive functional group utilized to design smart materials,20 the applications of fluorinated azobenzene fragments to explore multi-stimuli responsive gels are seldom reported.
In this paper, Sudan I dye derivatives bearing an alkoxy/perfluoroalkoxy group as a kind of LMWGs have been designed and synthesized (Fig. 1). The gelation abilities and behaviors in response to temperature, pH changes, UV-vis light irradiation, and metal cations are investigated. It is found that compound 2 can be a PSG in an oil–aqueous mixture and a kind of chemosensor for the recognition of Cu2+. To the best of our knowledge, this is the first report that exploits fluorinated Sudan I dye derivatives as multi-responsive gelators. Herein, the properties of compound 2 are also characterized by rheological studies, SEM, FT-IR spectroscopy, and UV-vis spectroscopy to gain insight into their self-assembly process.
Results and discussion
Synthesis of compounds 1 and 2
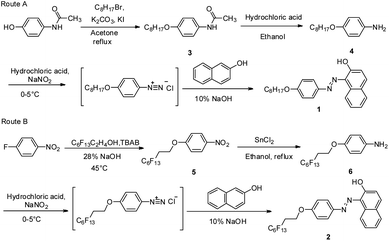
As illustrated in Scheme 1, Sudan I dye derivatives 1 and 2 are synthesized in three steps: (1) etherification, (2) amination, and (3) diazo-coupling reactions. The etherification of 4′-hydroxyacetanilide or 1-fluoro-4-nitrobenzene yields compounds 3 or 5. Deprotection of 3 by concentrated hydrochloric acid provides compound 4 with a moderate yield (84%). The reduction of compound 5 by tin(II) chloride gives compound 6 a yield of 50%. Compounds 1 and 2 are prepared via a diazo-coupling reaction, producing a higher yield (ca. 90%).Gelation ability
The gelation abilities of compounds 1 and 2 are investigated by the “stable to inversion in a test tube” method, and the results are listed in Table 1.21 Both compounds 1 and 2 form gels in particular organic liquids, as shown in Fig. S1.† As shown in Table 1, compound 2 achieves gelation in more organic liquids than compound 1. Compound 1 only gelates PEG-400 at 5 wt%, while compound 2 gelates not only PEG-400 but also four kinds of oil. The differences in the gelation abilities between compounds 1 and 2 may be due to the difference in the terminal alkoxy group, suggesting that the perfluoroalkoxy group would play a decisive role in self-assembly. In our earlier report, we found that the terminal perfluoroalkoxy group can help to elevate its gelation ability.10,11 Moreover, the minimum gelation concentration (MGC) value for compound 2 is lower than that for compound 1. For example, the MGC value for compound 1 is 5 wt% in PEG-400, whereas the MGC value for compound 2 is 2 wt%.| Solvent | Compound 1 | Compound 2 | |||
|---|---|---|---|---|---|
| Status (MGC) | Tgel (°C) | Solvent | Status (MGC) | Tgel (°C) | |
| a G = gel; S = soluble; P = precipitate; MGC values (wt%) are given in parentheses, and tests started from a gelator concentration of 5 wt%.b PEG-400, DMS, and MS indicated polyethylene glycol-400, dimethyl silicone oil, and methyl silicone oil, respectively. | |||||
| PEG-400 | G (5 wt%) | 43.5 | PEG-400 | G (2 wt%) | 31.6 |
| Paraffin oil | S (5 wt%) | — | Paraffin oil | G (2 wt%) | 31.1 |
| DMS | S (5 wt%) | — | DMS | G (2 wt%) | 48.9 |
| Mineral oil | S (5 wt%) | — | Mineral oil | G (4 wt%) | 31.1 |
| MS | S (5 wt%) | — | MS | G (5 wt%) | 32.0 |
| Acetonitrile | S (5 wt%) | — | Acetonitrile | S (5 wt%) | — |
| DMSO | P (5 wt%) | — | DMSO | S (5 wt%) | — |
| Acetic acid | S (5 wt%) | — | Acetic acid | S (5 wt%) | — |
| Acetone | S (5 wt%) | — | Acetone | S (5 wt%) | — |
| Ethanol | S (5 wt%) | — | Ethanol | S (5 wt%) | — |
The gels of compounds 1 and 2 are thermally reversible. And the thermally reversible gel–sol transition temperature (Tgel) and mechanical stiffness of physical gels are highly tunable. Based on the above two conditions, the influence of compound 2 concentration in PEG-400 on Tgel is measured as shown in Fig. 2a.22 Tgel is equivalent to the temperature at which, as a result of solubilization, a certain amount of self-assembled gelator falls.23 The Tgel value increases with the gelator concentration, indicating that stronger intermolecular interactions are present at higher concentrations of the gelator. Tgel reaches 40.4 °C when the concentration is 5 wt% (9.72 × 10⁻² mol L−1), while 31.6 °C at a concentration of 2 wt%.
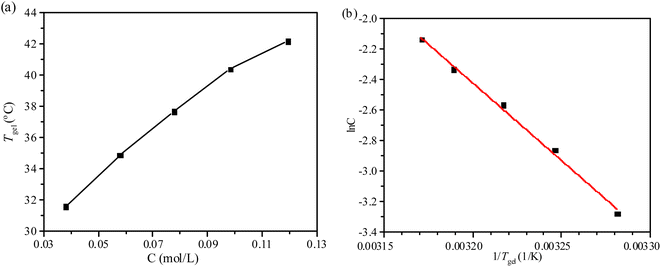 | ||
| Fig. 2 (a) Plots of Tgel versus concentration of compound 2 in PEG-400, (b) plots of the natural logarithm of the concentration of compound 2 versus 1/Tgel in PEG-400. | ||
The physical gels of compounds 1 and 2 are thermally reversible, so the thermodynamic parameters (ΔHθ, ΔSθ) associated with the gel phase to a quasi-sol phase (gel–sol) transition can be obtained with the van't Hoff method that plots ln(C) against 1/Tgel.23,24 The phase transition enthalpy of the solution can be estimated by the following equation:
Rheological analysis
Gel with viscoelastic properties is a solid-like material in the presence of a liquid phase, and the liquid phase may still diffuse through this steady system.27 The storage modulus G′ of gel is higher than its loss modulus G′′. log![[thin space (1/6-em)]](https://www.rsc.org/images/entities/char_2009.gif) G′, G′′, and the loss factors (tan
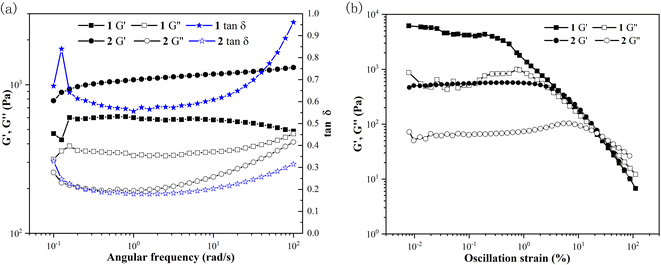
G′, G′′, and the loss factors (tan![[thin space (1/6-em)]](https://www.rsc.org/images/entities/char_2009.gif) δ = G′′/G′) are plotted as a function of angular frequency, corresponding to compounds 1 and 2 in PEG-400 at 5 wt% with the same aging time of 1 h to understand their mechanical properties (as shown in Fig. 3a). Within the measured frequency range (0.1–100 Hz) at a constant strain of 0.08%, G′ is greater than G′′, suggesting that gel behaves as a solid-like material. The values of G′ of gel formed with compound 2 are higher than those of compound 1. Within the angular frequency range of about 0.1–10 Hz, the loss factors present an almost horizontal line at about 0.6 (compound 1) and 0.2 (compound 2), respectively. The loss factors of compound 1 almost reach 1.0, while the loss factors of compound 2 are just 0.3 at the tested angular frequency of 100 Hz. The results suggest that the perfluoroalkyl group is able to elevate the mechanical strength of the gel of compound 2.28
δ = G′′/G′) are plotted as a function of angular frequency, corresponding to compounds 1 and 2 in PEG-400 at 5 wt% with the same aging time of 1 h to understand their mechanical properties (as shown in Fig. 3a). Within the measured frequency range (0.1–100 Hz) at a constant strain of 0.08%, G′ is greater than G′′, suggesting that gel behaves as a solid-like material. The values of G′ of gel formed with compound 2 are higher than those of compound 1. Within the angular frequency range of about 0.1–10 Hz, the loss factors present an almost horizontal line at about 0.6 (compound 1) and 0.2 (compound 2), respectively. The loss factors of compound 1 almost reach 1.0, while the loss factors of compound 2 are just 0.3 at the tested angular frequency of 100 Hz. The results suggest that the perfluoroalkyl group is able to elevate the mechanical strength of the gel of compound 2.28
The oscillation stress sweep experiments are performed at a constant velocity of 10 rad s−1 on the gel states after the same aging time of 2 h to obtain the yield stress of the gels, as shown in Fig. 3b. With the stress increasing, G′ and G′′ of the gels come across between 10–100 Pa at a crossover point (critical strain), which indicates the breaking of the gel–sol state. The crossover points are detected at 14.0% and 34.9% of strain for the gels of compounds 1 and 2, respectively. The crossing-over point gives the same results as the storage modulus does. The disintegration of the gel of compound 2 at a higher critical strain shows that the perfluoroalkyl group can enhance the strain bearing capability.29
Phase-selective gelation
According to the gel properties of compounds 1 and 2 shown in Table 1, the phase selective gelation properties of compound 2 are investigated. Deionized water (1 mL) is dropped into the test tube containing gel of compound 2 in paraffin oil, mineral oil, DMS, and MS at 5 wt%, respectively. The mixture is heated and shaken roughly until the gel state turns into a sol state. After cooling the mixture to room temperature, the oil layer in biphasic systems is selectively solidified by compound 2 (Fig. 4).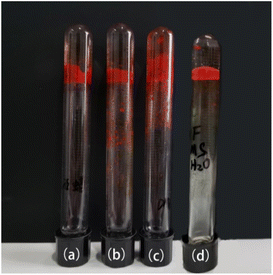 | ||
| Fig. 4 Selective gelation of compound 2 in biphasic systems. From left to right (a) paraffin oil/water mixture, (b) mineral oil/water mixture, (c) DMS/water mixture, and (d) MS/water mixture. | ||
pH response of gel
As shown in Fig. 5(a) and (d), compounds 1 and 2 at 5 wt% in PEG-400/H2O aqueous solutions (4![[thin space (1/6-em)]](https://www.rsc.org/images/entities/char_2009.gif) :
:![[thin space (1/6-em)]](https://www.rsc.org/images/entities/char_2009.gif) 1, v/v) can form gels, respectively. To investigate pH-responsive properties of gels in PEG-400/H2O aqueous solutions (4
1, v/v) can form gels, respectively. To investigate pH-responsive properties of gels in PEG-400/H2O aqueous solutions (4![[thin space (1/6-em)]](https://www.rsc.org/images/entities/char_2009.gif) :
:![[thin space (1/6-em)]](https://www.rsc.org/images/entities/char_2009.gif) 1, v/v), pH is adjusted in the PEG-400/H2O aqueous solutions by changing H2O to 0.05 M solutions of HCl or NaOH, and the pH-responsive properties of gels are examined and shown in Fig. 5.
1, v/v), pH is adjusted in the PEG-400/H2O aqueous solutions by changing H2O to 0.05 M solutions of HCl or NaOH, and the pH-responsive properties of gels are examined and shown in Fig. 5.
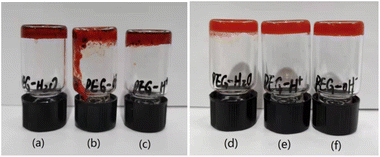 | ||
| Fig. 5 pH-response of compound 1 (a) neutral solution, (b) alkaline solution, (c) acidic solution, and compound 2 (d) neutral solution, (e) alkaline solution, (f) acidic solution. | ||
On the one hand, the gel of compound 1 can be successfully utilized as a pH-responsive gel. After substituting a 0.05 M solution of HCl for H2O, gels of compound 1 keep a similar state without a visible variance (Fig. 5(c)). Interestingly, as seen in Fig. 5(b), the gel formation process is prevented, and then the gel collapse in the solution of compound 1 after substituting 0.05 M solutions of NaOH for H2O. On the other hand, as seen in Fig. 5(d)–(f), the insensitive compound 2 towards pH changes forms gels in PEG-400/H2O aqueous solutions, as always.
A reasonable conclusion supported by the results is that the hydrogen bonding interaction of phenolic OH may play a vital role in the self-assembly of compound 1, which is disrupted in the alkaline solutions. The main driving force for the self-assembly of compound 2 may be the solvophobic interactions of the perfluoroalkoxy group.
Photoresponse of gel
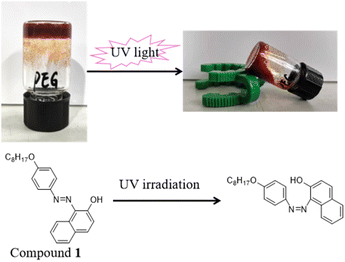
Aromatic azobenzenes are excellent candidates as molecular switches via trans–cis photoisomerization of the N![[double bond, length as m-dash]](https://www.rsc.org/images/entities/char_e001.gif) N double bonds, namely an azo group.30 As compounds 1 and 2 have an azo group, their photoresponse properties are investigated under 365 nm UV light irradiation (Fig. 6 and S2†). A sample gel containing 5 wt% of compound 1 or 2 in PEG-400/H2O aqueous solutions (4
N double bonds, namely an azo group.30 As compounds 1 and 2 have an azo group, their photoresponse properties are investigated under 365 nm UV light irradiation (Fig. 6 and S2†). A sample gel containing 5 wt% of compound 1 or 2 in PEG-400/H2O aqueous solutions (4![[thin space (1/6-em)]](https://www.rsc.org/images/entities/char_2009.gif) :
:![[thin space (1/6-em)]](https://www.rsc.org/images/entities/char_2009.gif) 1, v/v) is prepared and exposed to UV light. After being irradiated by UV light for 2 hours, the gels formed by either compound collapse. Interestingly, not only can UV light cause the collapse of the gels, but also daylight can. For example, the gel of compound 2 collapses after one day's daylight irradiation. However, the collapsed gels can reform the gel phase with a heating–cooling cycle.
1, v/v) is prepared and exposed to UV light. After being irradiated by UV light for 2 hours, the gels formed by either compound collapse. Interestingly, not only can UV light cause the collapse of the gels, but also daylight can. For example, the gel of compound 2 collapses after one day's daylight irradiation. However, the collapsed gels can reform the gel phase with a heating–cooling cycle.
Cation response of gel
The cation-responsive properties of gels of compounds 1 and 2 at 5 wt% in PEG-400/H2O aqueous solutions (4![[thin space (1/6-em)]](https://www.rsc.org/images/entities/char_2009.gif) :
:![[thin space (1/6-em)]](https://www.rsc.org/images/entities/char_2009.gif) 1, v/v) toward different cations are examined and shown in Fig. 7 and S3.† The tested cations (0.05 M) contain Mg2+, Na+, K+, Li+, Al3+, Cu2+,Co2+, Mn2+, Ni2+, Ca2+, Zn2+, Fe3+, and Ba2+ as chloride, while Cu2+ and Cs+ as CuSO4 and Cs2CO3, respectively. It is found that the gel of compound 1 turns into a sol phase after being irritated by the Cu2+ cation. Ni2+ cations can visibly observe a deep color change, and Na+, Fe3+, and Ba2+ cations can visibly observe a slope in the gel phase, while the other cations do not give rise to a visible variance. Meanwhile, the Cu2+ cation can visibly observe a deep color change in the gel phase formed by compound 2 (Fig. S3†), but other cations do not give rise to a visible variance. The influences of the copper salt anion on the performance of gelation ability were investigated, as shown in Fig. S4.† In PEG-400/H2O (4
1, v/v) toward different cations are examined and shown in Fig. 7 and S3.† The tested cations (0.05 M) contain Mg2+, Na+, K+, Li+, Al3+, Cu2+,Co2+, Mn2+, Ni2+, Ca2+, Zn2+, Fe3+, and Ba2+ as chloride, while Cu2+ and Cs+ as CuSO4 and Cs2CO3, respectively. It is found that the gel of compound 1 turns into a sol phase after being irritated by the Cu2+ cation. Ni2+ cations can visibly observe a deep color change, and Na+, Fe3+, and Ba2+ cations can visibly observe a slope in the gel phase, while the other cations do not give rise to a visible variance. Meanwhile, the Cu2+ cation can visibly observe a deep color change in the gel phase formed by compound 2 (Fig. S3†), but other cations do not give rise to a visible variance. The influences of the copper salt anion on the performance of gelation ability were investigated, as shown in Fig. S4.† In PEG-400/H2O (4![[thin space (1/6-em)]](https://www.rsc.org/images/entities/char_2009.gif) :
:![[thin space (1/6-em)]](https://www.rsc.org/images/entities/char_2009.gif) 2, v/v) system with different copper salts, such as NO3−, Cl−, and SO42−, compound 2 was able to form stable gels, and compound 1 failed to solidify the PEG-400/H2O system. That means the Cu2+ cation plays a key role in the ion-responsive properties of compounds 1 and 2.
2, v/v) system with different copper salts, such as NO3−, Cl−, and SO42−, compound 2 was able to form stable gels, and compound 1 failed to solidify the PEG-400/H2O system. That means the Cu2+ cation plays a key role in the ion-responsive properties of compounds 1 and 2.
The selectivity of compounds 1 and 2 as ion probes is verified by determining the changes in absorbance intensity caused by the presence of tested cations, as shown in Fig. S5.† The absorbance intensity of the probe is measured when tested cations are present at 6 × 10⁻⁴ M in the acetonitrile solution containing 3 × 10⁻⁵ M compounds 1 or 2, using the same conditions for each test. Fig. S4† shows the absorbance enhancement of compounds 1 and 2 with Cu2+ cation in the presence of all the other metal cations. The maximum spectroscopic transition energy of the dye originates from the π–π* transition. The π–π* transition can show a slight solvatochromic shift (shoulder peaks) due to the presence of the –OH group.31
To explore the variances after irritation by Cu2+, Ni2+, Na+, Fe3+, and Ba2+ cations, the changes in absorbance intensity are shown in Fig. 8. Fig. 8a shows the absorbance enhancement of compound 1 with Cu2+ cation (λ = 265 and 317 nm) in the presence of all the other metal ions. A similar result that the absorbance peaks appeared at 262 and 310 nm is also found in the absorption spectra of compound 2 (Fig. 8b). Meanwhile, the perfluoroalkyl group leads to a blueshift of the optical absorption edge in the UV-vis transmission spectra of the Sudan I dye derivative. It is concluded that compounds 1 and 2 are outstandingly specific and selective for Cu2+ cation.
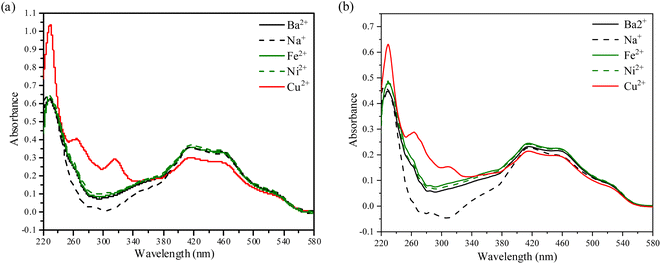 | ||
| Fig. 8 (a). UV-vis absorption spectral changes of compound 1, (b). UV-vis absorption spectral changes of compound 2. | ||
To ensure the sensitivity of compounds 1 and 2 toward Cu2+ cation, different concentrations of Cu2+ cation are tested in the acetonitrile solution containing 3 × 10⁻⁶ M compounds 1 or 2 by UV-vis spectrophotometric method and shown in Fig. 9 and S6.† As seen in Fig. 9, the absorbance bands at 228 and 310 nm increase sharply, while at 414 and 460 nm, they decrease slowly upon adding Cu2+ cation. In other words, introducing Cu2+ cation can enhance the absorbance bands at 228 and 310 nm.
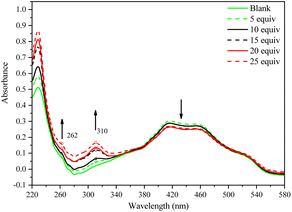 | ||
| Fig. 9 UV-vis absorption spectral changes of compound 2 in the acetonitrile solution when stimulated with Cu2+ cations at different concentrations. | ||
Investigation of the gelation mechanism
The aggregation morphologies of xerogels of compounds 1 and 2 obtained from PEG-400 are investigated by SEM. As seen in Fig. 10, the xerogel of compound 1 is in uneven thin sheets, while compound 2 is in a dendritic system consisting of fibrils entangled with each other by self-assembling molecules into three-dimensional networks through secondary bonds.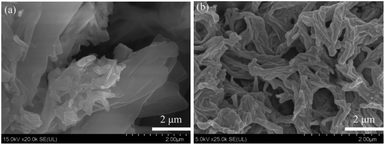 | ||
| Fig. 10 SEM images of compound 1 xerogel (a) compound 2 xerogel (b) obtained from 5 wt% in PEG-400. The scale bars represent 2 μm. | ||
To investigate the H-bonding role of naphthalene–OH in the self-assembling process, the FT-IR spectra of compound 2 in powder, xerogel complexed with Cu2+ cation (xerogel–Cu2+) and xerogel are recorded and compared. As displayed in Fig. 11, the peak of the C![[double bond, length as m-dash]](https://www.rsc.org/images/entities/char_e001.gif) O stretching bond (1560 cm−1) and the imine C
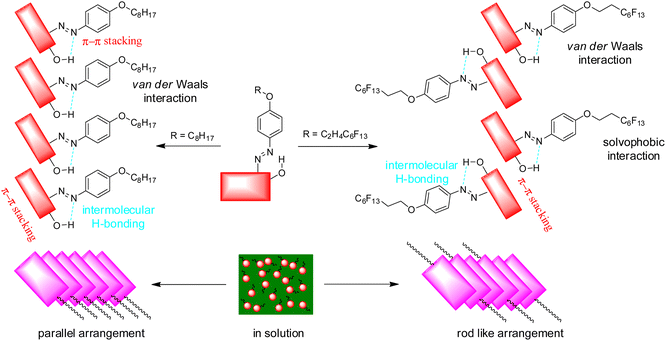
O stretching bond (1560 cm−1) and the imine C![[double bond, length as m-dash]](https://www.rsc.org/images/entities/char_e001.gif) N stretching bond (1638 cm−1) disappear, meaning that compound 2 mainly keeps azo-form in xerogel.32,33 The peak of the methylene group (CH2) stretching bond (2921 cm−1) appears in the xerogel state due to van der Waals interactions.34 A low-intensity stretching bond (2921 cm−1) is also found in the xerogel–Cu2+ state. The peak of the O–H stretching band at ca. 3400 cm−1 becoming a low-intensity broad peak from a high-intensity sharp peak suggests that more intermolecular hydrogen bonding seems to exist in xerogel.35,36 In the self-assembling process for compound 1, similar results are also found in Fig. S7.† In FE-IR spectra of compound 2 in xerogel–Cu2+, these peaks appear at 1302 and 1354 cm−1, both of which are associated with Cu–O bond.37 Meanwhile, the gelator molecules based on Sudan I dyes derivatives can be aggregated by a π–π stacking force occurring among the naphthalenes molecules.32 According to the abovementioned studies, the self-assembling process for compounds 1 and 2 can be attributed to the π–π stacking of the aromatic ring of the naphthylene and phenyl group, hydrogen bonding of the hydroxyl group, and van der Waals interactions. However, it should be noted that the solvophobic interactions of the perfluoroalkyl group as the main driving force for the self-assembly of compound 2 may play a decisive role. Herein, a suggested packing process for compounds 1 and 2 during gelation is shown in Fig. 12.
N stretching bond (1638 cm−1) disappear, meaning that compound 2 mainly keeps azo-form in xerogel.32,33 The peak of the methylene group (CH2) stretching bond (2921 cm−1) appears in the xerogel state due to van der Waals interactions.34 A low-intensity stretching bond (2921 cm−1) is also found in the xerogel–Cu2+ state. The peak of the O–H stretching band at ca. 3400 cm−1 becoming a low-intensity broad peak from a high-intensity sharp peak suggests that more intermolecular hydrogen bonding seems to exist in xerogel.35,36 In the self-assembling process for compound 1, similar results are also found in Fig. S7.† In FE-IR spectra of compound 2 in xerogel–Cu2+, these peaks appear at 1302 and 1354 cm−1, both of which are associated with Cu–O bond.37 Meanwhile, the gelator molecules based on Sudan I dyes derivatives can be aggregated by a π–π stacking force occurring among the naphthalenes molecules.32 According to the abovementioned studies, the self-assembling process for compounds 1 and 2 can be attributed to the π–π stacking of the aromatic ring of the naphthylene and phenyl group, hydrogen bonding of the hydroxyl group, and van der Waals interactions. However, it should be noted that the solvophobic interactions of the perfluoroalkyl group as the main driving force for the self-assembly of compound 2 may play a decisive role. Herein, a suggested packing process for compounds 1 and 2 during gelation is shown in Fig. 12.
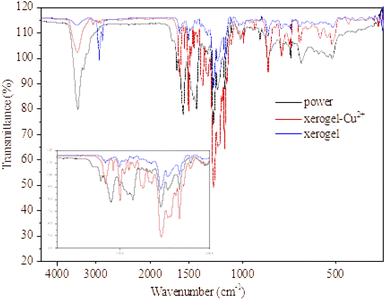 | ||
Fig. 11 FT-IR spectrum of compound 2 with different states, xerogel obtained from 5 wt% in PEG-400/H2O aqueous solutions (4![[thin space (1/6-em)]](https://www.rsc.org/images/entities/char_2009.gif) : :![[thin space (1/6-em)]](https://www.rsc.org/images/entities/char_2009.gif) 1, v/v). 1, v/v). | ||
Conclusions
Sudan I dye derivatives bearing an alkoxy/perfluoroalkoxy group have been synthesized, and the gelation behaviors with different stimuli are investigated. The results indicate that the gelation behaviors of compounds 1 and 2 can respond to temperature, metal ions, and UV-vis light irradiation. What's more, compounds 1 and 2 can also selectively sense the Cu2+ cation in the presence of other metal cations, such as Mg2+, Na+, K+, Li+, Al3+, Co2+, Mn2+, Ni2+, Ca2+, Zn2+, Fe3+, Ba2+, and Cs+. As the hydrogen bonding interaction plays a vital role in the self-assembly, the pH-responsive gel of compound 1 can be successfully utilized. Meanwhile, compound 2, bearing a perfluoroalkyl group which may play a decisive role, can be utilized as a phase selective gelator. Our findings provide a brand-new perspective for designing multifunction photosensitive materials with/without an alkoxy/perfluoro-alkoxy group.Experimental
Chemicals and reagents
Expect perfluoro-n-hexyl-2-ethanol (Jinan Guochen Taifu Chemical Co., Ltd.), paraffin oil (Guangzhou Jinhuada Chemical Reagent Co., Ltd.), methyl silicone oil (MS) (Zhejiang Rongcheng Silicone Material Co., Ltd.), and others are purchased from Energy Chemical Co., Ltd. or Shanghai Tansoole Technology Co. Ltd. All the raw materials and solvents as analytically pure are used without further purification. The distinction between dimethyl silicone oil (DMS) and MS is the viscosity of 1000 and 500![[thin space (1/6-em)]](https://www.rsc.org/images/entities/char_2009.gif) mPa s at 250 °C, respectively. Silica gel (200–300 mesh) for column chromatography and silica GF254 (10–20 mm) for thin layer chromatography (TLC) are purchased from Qingdao Haiyang Chemical Co. Ltd.
mPa s at 250 °C, respectively. Silica gel (200–300 mesh) for column chromatography and silica GF254 (10–20 mm) for thin layer chromatography (TLC) are purchased from Qingdao Haiyang Chemical Co. Ltd.
Instruments
The melting points are obtained with an X-4 micro-melting point apparatus (Beijing Tech Instrument Co., Ltd.). All the chemicals are characterized by 1H NMR, 13C NMR, and 19F NMR spectroscopy on a 400 MHz Bruker Ultrashiled Spectrometer (Bruker, Germany), where tetramethylsilane is used as an internal standard. UV/vis spectra are recorded on a Shimadzu UV-2501 spectrometer. The intermolecular hydrogen bonding corroboration is carried out by Bruker Vertex-70 Infrared Spectrophotometer using KBr disc. SEM analyses are performed by Hitachi SU8220 model field scanning microscope.The rheological properties of a sample with high viscosity are measured using the Discovery Hybrid Rheometer DHR-3 equipped with a cone and plate geometry of 40 mm diameter.
Preparation of xerogel
Firstly, 30 mg Sudan I dye derivative is added to 570 mg PEG-400 to get a concentration of 5 wt%. Secondly, the mixture is heated until the gelator completely dissolves for proper network formation. The solution is then cooled to room temperature to gelatinize. Thirdly, after adding 4 mL of water to the surface of the gel, the mixture is stirred for 5 minutes and then sonicated for 3 minutes to gain precipitation. Lastly, the precipitated solid is filtered off, washed with water three times, and vacuum dried to produce xerogel.Rheological analysis
All rheological measurements are performed using the rotational rheometer TA DHR-3. The Sudan I dye derivative is heated to 80 °C and maintained for 3 min to make it completely dissolved. The solution is then cooled to room temperature and held for 1 h to form a stable gel. Frequency sweeps are carried out from an angular frequency of 0.1–100 rad s−1 at a constant strain of 0.5%. Stress sweeps are carried out from 0.01 to 100% strain at a frequency of 10 rad s−1. The strain when the gel broke is determined as the point G′ and G′′ deviated from linearity, a manifestation of permanent deformation.Investigation of the effect of metal ions on gelation
In order to investigate the response of the gelators toward metal ions, compounds 1 and 2 (0.01 mmol) are dissolved in acetonitrile (10 mL), respectively. In the process of testing, the total concentration of gelation is 3.0 × 10⁻⁵ M, and the total concentration of metal ions is 60 × 10−5 M. UV-vis absorption spectra are recorded on a Shimadzu UV-2501 spectrometer at room temperature, whichsScan range from 200–650 nm.Syntheses
![[thin space (1/6-em)]](https://www.rsc.org/images/entities/char_2009.gif) :
:![[thin space (1/6-em)]](https://www.rsc.org/images/entities/char_2009.gif) 1, Rf 0.45) to afford a brown solid (compound 4, 6.04 g, 84% yield). m.p.: 36–37 °C. 1H NMR (400 MHz, CDCl3) δ 6.74 (d, J = 8.8 Hz, 2H), 6.64 (d, J = 8.8 Hz, 2H), 3.88 (t, J = 6.6 Hz, 2H), 1.78–1.69 (m, 2H), 1.44–1.27 (m, 12H), 0.89 (t, J = 6.4 Hz, 3H) ppm. 13C NMR (101 MHz, CDCl3) δ 152.5, 140.0, 116.5, 116.0, 68.9, 32.0, 29.6, 29.5, 29.4, 26.2, 22.8, 14.2 ppm.
1, Rf 0.45) to afford a brown solid (compound 4, 6.04 g, 84% yield). m.p.: 36–37 °C. 1H NMR (400 MHz, CDCl3) δ 6.74 (d, J = 8.8 Hz, 2H), 6.64 (d, J = 8.8 Hz, 2H), 3.88 (t, J = 6.6 Hz, 2H), 1.78–1.69 (m, 2H), 1.44–1.27 (m, 12H), 0.89 (t, J = 6.4 Hz, 3H) ppm. 13C NMR (101 MHz, CDCl3) δ 152.5, 140.0, 116.5, 116.0, 68.9, 32.0, 29.6, 29.5, 29.4, 26.2, 22.8, 14.2 ppm.![[thin space (1/6-em)]](https://www.rsc.org/images/entities/char_2009.gif) :
:![[thin space (1/6-em)]](https://www.rsc.org/images/entities/char_2009.gif) 2) to afford a red solid (compound 1, 3.12 g, 92% yield). m.p.: 69–70 °C. 1H NMR (400 MHz, CDCl3) δ 15.72 (s, 1H), 8.72 (d, J = 8.4 Hz, 1H), 7.82 (d, J = 9.2 Hz, 2H), 7.76 (d, J = 9.2 Hz, 1H), 7.70 (d, J = 8.0 Hz, 1H), 7.58 (t, J = 7.6 Hz, 1H), 7.40 (t, J = 7.8 Hz, 1H), 7.05 (d, J = 9.2 Hz, 1H), 7.01 (d, J = 9.2 Hz, 2H), 4.02 (t, J = 6.4 Hz, 2H), 1.86–1.77 (m, 2H), 1.51–1.30 (m, 12H), 0.91 (t, J = 6.6 Hz, 3H) ppm. 13C NMR (101 MHz, CDCl3) δ 161.1, 160.5, 141.9, 136.7, 133.4, 130.0, 128.4, 128.3, 128.2, 124.9, 122.3, 121.8, 115.4, 77.5, 77.2, 76.8, 68.6, 32.0, 29.5, 29.4, 29.3, 26.2, 22.8, 14.2 ppm.
2) to afford a red solid (compound 1, 3.12 g, 92% yield). m.p.: 69–70 °C. 1H NMR (400 MHz, CDCl3) δ 15.72 (s, 1H), 8.72 (d, J = 8.4 Hz, 1H), 7.82 (d, J = 9.2 Hz, 2H), 7.76 (d, J = 9.2 Hz, 1H), 7.70 (d, J = 8.0 Hz, 1H), 7.58 (t, J = 7.6 Hz, 1H), 7.40 (t, J = 7.8 Hz, 1H), 7.05 (d, J = 9.2 Hz, 1H), 7.01 (d, J = 9.2 Hz, 2H), 4.02 (t, J = 6.4 Hz, 2H), 1.86–1.77 (m, 2H), 1.51–1.30 (m, 12H), 0.91 (t, J = 6.6 Hz, 3H) ppm. 13C NMR (101 MHz, CDCl3) δ 161.1, 160.5, 141.9, 136.7, 133.4, 130.0, 128.4, 128.3, 128.2, 124.9, 122.3, 121.8, 115.4, 77.5, 77.2, 76.8, 68.6, 32.0, 29.5, 29.4, 29.3, 26.2, 22.8, 14.2 ppm.ESI-TOF-MS: m/z calculated for C24H28N2O2, [M + H]+: 377.2229, found: 377.2230.
![[thin space (1/6-em)]](https://www.rsc.org/images/entities/char_2009.gif) :
:![[thin space (1/6-em)]](https://www.rsc.org/images/entities/char_2009.gif) 1 Rf 0.25) to afford a yellowish oil (compound 5, 11.13 g, 63% yield). 1H NMR (400 MHz, CDCl3) δ 8.22 (d, J = 9.2 Hz, 2H), 6.98 (d, J = 9.2 Hz, 2H), 4.37 (t, J = 6.6 Hz, 2H), 2.76–2.61 (m, 2H) ppm. 13C NMR (101 MHz, CDCl3) δ 163.0, 142.3, 126.2, 114.6, 60.90 (t, J = 4.6 Hz), 31.30 (t, J = 21.9 Hz) ppm. 19F NMR (376 MHz, CDCl3) δ −80.79 (t, J = 9.9 Hz), −113.28 (t, J = 13.6 Hz), −121.84 (s), −122.86 (s), −123.52 (s), −125.26–126.93 (m) ppm.
1 Rf 0.25) to afford a yellowish oil (compound 5, 11.13 g, 63% yield). 1H NMR (400 MHz, CDCl3) δ 8.22 (d, J = 9.2 Hz, 2H), 6.98 (d, J = 9.2 Hz, 2H), 4.37 (t, J = 6.6 Hz, 2H), 2.76–2.61 (m, 2H) ppm. 13C NMR (101 MHz, CDCl3) δ 163.0, 142.3, 126.2, 114.6, 60.90 (t, J = 4.6 Hz), 31.30 (t, J = 21.9 Hz) ppm. 19F NMR (376 MHz, CDCl3) δ −80.79 (t, J = 9.9 Hz), −113.28 (t, J = 13.6 Hz), −121.84 (s), −122.86 (s), −123.52 (s), −125.26–126.93 (m) ppm.![[thin space (1/6-em)]](https://www.rsc.org/images/entities/char_2009.gif) :
:![[thin space (1/6-em)]](https://www.rsc.org/images/entities/char_2009.gif) 1) to afford a brownish solid (compound 6, 1.40 g, 50% yield). m.p.: 50–53 °C. 1H NMR (400 MHz, CDCl3) δ 6.75 (d, J = 8.8 Hz, 2H), 6.65 (d, J = 8.8 Hz, 2H), 4.20 (t, J = 7.0 Hz, 2H), 3.47 (d, J = 10.4 Hz, 2H), 2.65–2.50 (m, 2H) ppm. 13C NMR (101 MHz, CDCl3) δ 151.3, 141.0, 116.5, 116.2, 61.01 (t, J = 5.0 Hz), 31.48 (t, J = 22.5 Hz) ppm. 19F NMR (376 MHz, CDCl3) δ −80.80 (t, J = 9.9 Hz), −111.31 (td, J = 14.3, 3.76 Hz), −121.89 (s), −122.88 (s), −123.59 (s), −125.80–126.71 (m) ppm.
1) to afford a brownish solid (compound 6, 1.40 g, 50% yield). m.p.: 50–53 °C. 1H NMR (400 MHz, CDCl3) δ 6.75 (d, J = 8.8 Hz, 2H), 6.65 (d, J = 8.8 Hz, 2H), 4.20 (t, J = 7.0 Hz, 2H), 3.47 (d, J = 10.4 Hz, 2H), 2.65–2.50 (m, 2H) ppm. 13C NMR (101 MHz, CDCl3) δ 151.3, 141.0, 116.5, 116.2, 61.01 (t, J = 5.0 Hz), 31.48 (t, J = 22.5 Hz) ppm. 19F NMR (376 MHz, CDCl3) δ −80.80 (t, J = 9.9 Hz), −111.31 (td, J = 14.3, 3.76 Hz), −121.89 (s), −122.88 (s), −123.59 (s), −125.80–126.71 (m) ppm.ESI-TOF-MS: m/z calculated for C24H15F13N2O2, [M + H]+: 611.1004, found: 611.1006.
Conflicts of interest
There are no conflicts to declare.Acknowledgements
This work is financially supported by the National Natural Science Foundation of China (no. 22066011), the Science Foundation of Jiangxi Province (no. 20192BBHL80017), the Department of Education of Jiangxi Province (no. GJJ211105), and Jiangxi Science & Technology Normal University (no. 2017BSQD020 and 2021QNBJRC002).References
- X. Cai, Y. Wu, L. Wang, N. Yan, J. Liu, X. Fang and Y. Fang, Soft Matter, 2013, 9(24), 5807 RSC.
- J. Zhong, H. Fu, X. Jia, H. Lou, T. Wan, H. Luo, H. Liu, D. Zhong and X. Luo, RSC Adv., 2019, 9(21), 11824–11832 RSC.
- Y.-S. Zhang, A. V. Emelyanenko and J.-H. Liu, J. Taiwan Inst. Chem. Eng., 2016, 65, 444–451 CrossRef CAS.
- D. A. Makeiff, J.-Y. Cho, B. Smith, R. Carlini and N. Godbert, Gels, 2022, 8(5), 285 CrossRef CAS.
- Y. Cui, M.-C. Li, Q. Wu, J. A. Pojman and D. G. Kuroda, ACS Appl. Mater. Interfaces, 2017, 9(39), 33549–33553 CrossRef CAS PubMed.
- S. Bhattacharya and Y. Krishnan-Ghosh, Chem. Commun., 2001, 2, 185–186 RSC.
- A. M. Vibhute and K. M. Sureshan, ChemSusChem, 2020, 13(20), 5343–5360 CrossRef CAS.
- F. L. Motta, S. R. Stoyanov and J. B. P. Soares, Chemosphere, 2018, 194, 837–846 CrossRef CAS PubMed.
- T. Yoshida, T. Nakamura, Y. Morita and H. Okamoto, Chem. Lett., 2015, 44(4), 512–514 CrossRef CAS.
- B.-P. Cao, G.-R. Huang, X.-P. Tao, H. Okamoto and Q. Xiao, J. Nanomater., 2022, 2022, 1–4 CrossRef.
- B.-P. Cao, C. Shen, Y. Xu, Q. Zhou, Y. Morita, H. Okamoto and Q. Xiao, J. Fluorine Chem., 2019, 226, 109348 CrossRef CAS.
- B. Cao, Y. Kaneshige, Y. Matsue, Y. Morita and H. Okamoto, New J. Chem., 2016, 40(6), 4884–4887 RSC.
- Y. Morita, T. Tasaka, K. Kawabe, H. Okamoto, S. Takenaka and H. Kita, Mol. Cryst. Liq. Cryst., 2005, 435(1), 153–162 Search PubMed.
- T. Shimasaki, Y. Ohno, M. Tanaka, M. Amano, Y. Sasaki, H. Shibata, M. Watanabe, N. Teramoto and M. Shibata, Bull. Chem. Soc. Jpn., 2019, 92(1), 97–104 CrossRef CAS.
- A. Iuchi, Y. Morita, T. Hirakawa, K. Kasatani and H. Okamoto, ECS Trans., 2009, 16(24), 65–70 CrossRef CAS.
- N. Saito, S. Itoyama, R. Takahashi, Y. Takahashi and Y. Kondo, J. Colloid Interface Sci., 2021, 582, 638–646 CrossRef CAS.
- N. Saito, S. Itoyama and Y. Kondo, J. Colloid Interface Sci., 2021, 588, 418–426 CrossRef CAS PubMed.
- J. Morris, J. Bietsch, K. Bashaw and G. Wang, Gels, 2021, 7(1), 24 CrossRef CAS PubMed.
- C. P. Kabb, C. S. O'Bryan, C. C. Deng, T. E. Angelini and B. S. Sumerlin, ACS Appl. Mater. Interfaces, 2018, 10(19), 16793–16801 CrossRef CAS PubMed.
- Z. Khayat and H. Zali-Boeini, Dyes Pigm., 2018, 159, 337–344 CrossRef CAS.
- J. G. Hardy, A. R. Hirst, I. Ashworth, C. Brennan and D. K. Smith, Tetrahedron, 2007, 63(31), 7397–7406 CrossRef CAS.
- S. Xuan, C.-U. Lee, C. Chen, A. B. Doyle, Y. Zhang, L. Guo, V. T. John, D. Hayes and D. Zhang, Chem. Mater., 2016, 28(3), 727–737 CrossRef CAS PubMed.
- A. R. Hirst, I. A. Coates, T. R. Boucheteau, J. F. Miravet, B. Escuder, V. Castelletto, I. W. Hamley and D. K. Smith, J. Am. Chem. Soc., 2008, 130(28), 9113–9121 CrossRef CAS PubMed.
- Y. Zhang, P. Xue, B. Yao and J. Sun, New J. Chem., 2014, 38(12), 5747–5753 RSC.
- K. Li and P. Xue, Dyes Pigm., 2018, 156, 206–212 CrossRef CAS.
- M. Côte, T. Nicholls, D. W. Knight, I. R. Morgan, P. G. A. Rogueda, S. M. King, R. K. Heenan and P. C. Griffiths, Langmuir, 2009, 25(15), 8678–8684 CrossRef.
- S. Mondal, P. Bairi, S. Das and A. K. Nandi, J. Mater. Chem. A, 2019, 7(1), 381–392 RSC.
- A. Panja and K. Ghosh, Mater. Chem. Front., 2018, 2(10), 1866–1875 RSC.
- M. Colak, J. Mater. Sci., 2022, 57(2), 1044–1057 CrossRef CAS.
- E. Merino and M. Ribagorda, Beilstein J. Org. Chem., 2012, 8, 1071–1090 CrossRef CAS PubMed.
- C. Toro, A. Thibert, L. De Boni, A. E. Masunov and F. E. Hernández, J. Phys. Chem. B, 2008, 112(3), 929–937 CrossRef CAS PubMed.
- A. Panja and K. Ghosh, Mater. Chem. Front., 2018, 2(10), 1866–1875 RSC.
- G. R. Ferreira, H. C. Garcia, M. R. C. Couri, H. F. Dos Santos and L. F. C. de Oliveira, J. Phys. Chem. A, 2013, 117(3), 642–649 CrossRef CAS PubMed.
- B. R. Ganapuram, M. Alle, R. Dadigala, A. Dasari, V. Maragoni and V. Guttena, Int. Nano Lett., 2015, 5(4), 215–222 CrossRef CAS.
- L. S. Athira, S. Balachandran and R. Sudha Devi, J. Mol. Struct., 2019, 1180, 100–109 CrossRef CAS.
- F. Mandegani, H. Zali-Boeini, Z. Khaya and R. Scopelliti, Talanta, 2020, 219, 121237 CrossRef CAS PubMed.
- M. A. Gondal, T. F. Qahtan, M. A. Dastageer, T. A. Saleh, Y. W. Maganda and D. H. Anjum, Appl. Surf. Sci., 2013, 286, 149–155 CrossRef CAS.
Footnote |
| † Electronic supplementary information (ESI) available. See DOI: https://doi.org/10.1039/d2ra05545g |
| This journal is © The Royal Society of Chemistry 2022 |


