DOI:
10.1039/D2RA05579A
(Paper)
RSC Adv., 2022,
12, 34066-34079
Gadolinium molybdate decorated graphitic carbon nitride composite: highly visualized detection of nitrofurazone in water samples
Received
5th September 2022
, Accepted 18th November 2022
First published on 28th November 2022
Abstract
In this work, a graphitic carbon nitride/gadolinium molybdate (g-C3N4/Gd2MoO6) composite manufactured glassy carbon electrode (GCE) was used to detect nitrofurazone (NFZ) at the trace level. A quick and inexpensive electrochemical sensor for NFZ analysis is described in this paper. The material structure and properties were determined by scanning electron microscopy, X-ray diffraction, X-ray photoelectron spectroscopy, Fourier-transform infrared spectroscopy, and transmission electron microscopy. The GCE/g-C3N4/Gd2MoO6 electrode was studied using cyclic voltammetry and amperometry. The electrocatalytic studies of the GCE/g-C3N4/Gd2MoO6 electrode showed significantly improved detection of NFZ. The electrocatalytic studies of the GCE/g-C3N4/Gd2MoO6 electrode was significantly improved for the detection of NFZ than bare GCE, GCE/g-C3N4, and GCE/Gd2MoO6 modified electrodes. The linear response and the detection limit of NFZ were 0.006 μM (S/N = 3) and 0.02–2000 μM, respectively. The electrode sensitivity was identified as 2.057 μA μM−1 cm−2 under ideal experimental conditions. The modified electrode was able to detect NFZ even when there were 500-fold as many interfering ions present. The practical applicability of the electrode was tested in a variety of water samples, with satisfactory results. Overall, the NFZ sensor demonstrated satisfactory repeatability, stability, and reproducibility. Meanwhile, it has proven to be a reliable, stable, and practical platform for the analysis of NFZ in various water samples, with acceptable recoveries.
1. Introduction
Nitrofurazone (NFZ) is a derivative of nitrofuran (5-nitro-2-furaldehyde semicarbazone), which has antibacterial properties against Gram-positive and Gram-negative bacteria.1,2 NFZ derivative inhibits acetyl coenzyme-A and stops microorganism metabolism.3 It has been added to feed to prevent and cure infectious disorders in poultry, livestock, and aquatic fish, and also used as an antiseptic and disinfectant to treat human skin illnesses.4,5 It is also an anti-infective used to treat or monitor infections of the skin, genitourinary system, eyes, nose, and ears. NFZ residues present in food can be transferred via the food chain to the human body, where chronic intake can cause carcinogenic and teratogenic effects.6 Because of its carcinogenic and mutagenic effects, NFZ has been banned in Australia (1993), Brazil (2002), Thailand (2002), the Philippines (2001), the United States (2002), and the European Union (1993).7,8 Nevertheless, NFZ is illegally used on a large scale due to its great antibacterial effects, low cost, and high effectiveness, and the European Commission has set the low-performance level for NFZ at 1 g kg−1.9
The necessity of identifying NZF is particularly crucial because of its high toxicity and slow breakdown, which leads to high quantities of residues in the human body. NFZ appears to be swiftly digested in animals, leaving very few residues in the body.10 To achieve direct detection of NFZ, an extremely low detection level approach is required. Hence, a sensitive, quick, efficient analytical, and convenient approach to identifying NFZ is needed for adequate monitoring of the environmental hazards that NFZ may generate.11 Metal molybdates (AMo1O2; A = Ni, Cu, Co, Bi, Fe, etc.) have recently found numerous applications in photoluminescence, batteries, supercapacitors, optical materials fibers, light-emitting diodes, catalysts, and sensors due to their intriguing optical and electronic properties.12,13 Rare-earth metal molybdates (REAMoBOC, RE = Pr, Ce, Gd, Nd, and Yb) have attracted great attention in the fields of laser materials, photocatalysis, optical fibers, and electrocatalysis.14–17
In particular, gadolinium molybdate (Gd2MoO6) exhibits high electrical, mechanical, and chemical stability as well as outstanding thermal characteristics.18,19 Gd2MoO6 is a common rare earth category metal molybdate with strong chemical and thermal durability, and it is frequently used as the luminescent material for the creation of new phosphors for commercial use.20 Gadolinium (Gd) ions may effectively transfer energy from Gd3+ to molybdate because of their broad excitation band, brought on by charge transport between O and Mo.21,22 As a result, Gd2MoO6 has a lot of potential as a host matrix with a strong crystalline structure and distinct electromagnetic and catalytic properties.23 It has been discovered that the size of nanomaterials has a significant impact on the electrochemical characteristics of rare earth metal molybdates.24–26 Researchers are interested in Gd2MoO6 nanosheets because of their low agglomeration, large surface area, excellent charge transfer, outstanding conductivity, and linked porous channels.27 The hydrothermal method to make Gd2MoO6 nanosheets has several advantages over other procedures, including nanomaterial homogeneity, high stability, cheap cost, and low usage of harmful chemicals.28–30
Due to their outstanding features, carbon-based materials are garnering special attention in electrochemical sensor research. The reason is that highly conductive carbon-based nanomaterials such as carbon nanotubes, graphene nanomaterials, and g-C3N4 increase the electrocatalytic efficiency of Gd2MoO6.31,32 When coupled with graphene oxide, carbon nanotubes, and metal oxides, it has outperformed pure graphitic carbon nitride (g-C3N4) in terms of electrocatalytic performance.33,34 However, g-C3N4 is receiving more attention because of its easy production, low cost, low density, strong biocompatibility, unusual electronic structure, great stability, high porosity, biocompatibility, and chemical stability.35,36 Furthermore, the tri-s-triazine ring structure and nitrogen coordinates of g-C3N4 combined with a high degree of condensation lead to better electrocatalytic active sites for energy storage, electrocatalysis, heavy metals detection, photocatalysis, hydrogen production, fuel cells, and sensing applications.37,38 As a result of a strong coordination, contact between Gd2MoO6 and g-C3N4 operates as a heterogeneous interface, enhancing sensing behavior. Compared to pure molybdate material, the g-C3N4/Gd2MoO6 electrode has an active surface area and a high-volume surface ratio, which facilitates permeation into the electrode interface.39 In this paper, we used a two-step technique to combine Gd2MoO6 with g-C3N4 sheets to create a g-C3N4/Gd2MoO6 composite material. The Gd2MoO6 was prepared using a co-precipitation method, and the g-C3N4/Gd2MoO6 composite was prepared by the ultra-sonication method.
2. Material and methods
Materials were acquired from Sigma Aldrich, Taiwan, as follows: sulfuric acid (H2SO4, 99%), urea (NH2CONH2, 99%), gadolinium(III) nitrate (Gd(NO3)3, 99.9%), sodium molybdate (Na2MoO4, 98%), ethylene glycol (C2H6O2, 99.8%), methanol (CH3OH, 99.9%), sodium hydroxide (NaOH, 98%), hydrochloric acid (HCl, 37%), sodium dihydrogen phosphate (NaH2PO4, 99.9%) and disodium hydrogen phosphate (Na2HPO4, 99.9%). The buffer solution (PBS) was created using NaH2PO4 and Na2HPO4, and the pH of the solution was adjusted using H2SO4 and NaOH. Only analytical-grade substances were employed in this study, and none were further refined. Pure N2 was used to completely deoxygenate the electrolyte in the electrochemical cell for 15 minutes. The tests were all conducted at ambient temperature. All solutions for the electrochemical studies were prepared with double distilled (DD) water. All electrochemical studies in this work were performed at a CHI 1211B workstation with an Ag/AgCl reference electrode, a working electrode of a glassy carbon electrode (GCE, area = 0.07 cm2), and a Pt wire counter electrode. The electrochemical sensor studies were carried out in a saturated electrolyte of N2 (purged for 15 minutes). The surface morphology and the elemental analysis were evaluated by field emission scanning electron microscopy combined with energy-dispersive X-ray spectroscopy (FESEM-EDX, JEOL JSM-7610F, Tokyo, Japan, and Hitachi Regulus 8100). A high-resolution transmission electron microscope (TEM, JEM-2100F) was applied for Fourier transform infrared spectroscopy (FT-IR) (PerkinElmer, Inc. Waltham, MA, USA). EIS spectra were collected using EIM6EX ZAHNER equipment from Kroanch, Germany. X-ray diffraction (D2 Phaser, Bruker, Billerica, MA, USA) studies were performed with X-ray diffractometer under CuKα radiation (λ = 1.5418 Å).
3. GCE/g-C3N4/Gd2MoO6 modified electrode preparation
3.1 Gadolinium molybdate synthesis
The Gd2MoO6 was synthesized following previously published articles with minor changes.17,18 In addition, 0.98 g of Gd(NO3)3 (0.1 M) and 0.82 g of Na2MoO4 (0.2 M) were separately dissolved in 40 mL DI water. After that, 7 mL (3.5 M) of ethylene glycol was added to the above solution and the homogeneously distributed suspension was then combined in a 250 mL beaker under constant stirring. Following that, 0.5 g (1 M) of urea (10 mL of H2O) was added to the aforesaid suspension and the beaker was agitated for an hour. The resultant material was then dried for 12 hours at 80 °C and subsequently washed with water and ethanol. Finally, the white precipitate was calcined for 4 hours at 400 °C to form gadolinium molybdate.
3.2 g-C3N4 synthesis
The g-C3N4 preparation was carried out following previously published reports with some modifications.39–42 None of the chemical reagents required additional purification because all were of analytical quality. The nitrogen-rich organic precursors (urea) received direct heat treatment. Hence, 6 g of urea was placed in an alumina crucible heated to 520 °C at a heating rate of 10 °C min−1 and held for 4 hours. The light yellowish prepared powder was crushed into fine powder for future use after the crucible cooled to laboratory temperature. After natural cooling, the obtained powders were yolk-yellow color. Samples were gathered and ground into fine powders. The sheet shape of the g-C3N4 sheets was obtained with a thickness below the micrometer range. The corresponding reaction paths of g-C3N4 synthesis are illustrated in Scheme 2.
3.3 GCE/g-C3N4/Gd2MoO6 electrode preparation
The g-C3N4/Gd2MoO6 composite was prepared following this procedure. The prepared Gd2MoO6 (6 mg, 66%) and g-C3N4 (3 mg, 33%) were dispersed at DMF (5 mL) in the 2![[thin space (1/6-em)]](https://www.rsc.org/images/entities/char_2009.gif) :
:![[thin space (1/6-em)]](https://www.rsc.org/images/entities/char_2009.gif) 1 ratio, and the mixture was sonicated for 30 minutes to form g-C3N4/Gd2MoO6 composite. After that, the g-C3N4/Gd2MoO6 composite was dried in the oven for further studies. The non-covalent stacking attraction between the g-C3N4 and Gd2MoO6 forms the g-C3N4/Gd2MoO6 composite. Afterward, 5 mg of g-C3N4/Gd2MoO6 composite was dispersed in water (100 μL) and ultra-sonicated for up to 20 minutes at room temperature. After the ultra-sonication, the 10 μL of g-C3N4/Gd2MoO6 composite mixture was drop cast on the precleaned GCE electrode surface and dry at room temperature to form the GCE/g-C3N4/Gd2MoO6 electrode. The prepared GCE/g-C3N4/Gd2MoO6 electrode was used for the electrochemical detection of NFZ. The whole GCE/g-C3N4/Gd2MoO6 electrode preparation procedure is described in Scheme 1.
1 ratio, and the mixture was sonicated for 30 minutes to form g-C3N4/Gd2MoO6 composite. After that, the g-C3N4/Gd2MoO6 composite was dried in the oven for further studies. The non-covalent stacking attraction between the g-C3N4 and Gd2MoO6 forms the g-C3N4/Gd2MoO6 composite. Afterward, 5 mg of g-C3N4/Gd2MoO6 composite was dispersed in water (100 μL) and ultra-sonicated for up to 20 minutes at room temperature. After the ultra-sonication, the 10 μL of g-C3N4/Gd2MoO6 composite mixture was drop cast on the precleaned GCE electrode surface and dry at room temperature to form the GCE/g-C3N4/Gd2MoO6 electrode. The prepared GCE/g-C3N4/Gd2MoO6 electrode was used for the electrochemical detection of NFZ. The whole GCE/g-C3N4/Gd2MoO6 electrode preparation procedure is described in Scheme 1.
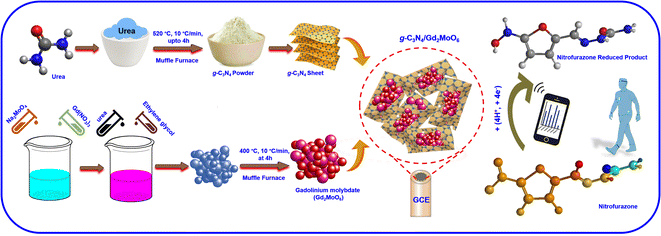 |
| | Scheme 1 Synthesis of g-C3N4, Gd2MoO6, and g-C3N4/Gd2MoO6 composites and applied for NFZ sensor. | |
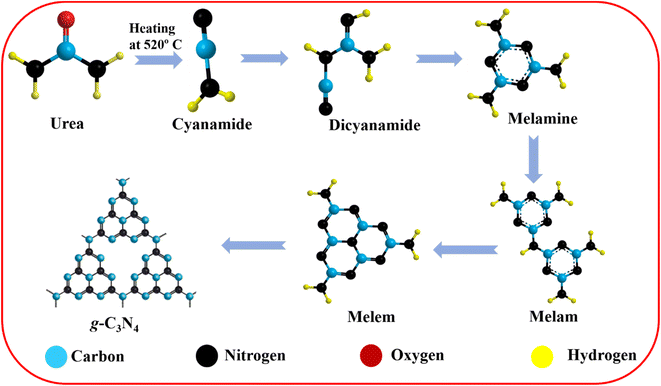 |
| | Scheme 2 Proposed reaction paths of g-C3N4 synthesis. | |
4. Characterization studies
4.1 XRD and FT-IR studies
XRD studies were used to determine the atomic structure and interlayer spacing of the produced nanocomposites. The XRD spectra of g-C3N4, Gd2MoO6, and g-C3N4/Gd2MoO6 composite are shown in Fig. 1a. The XRD diffraction peaks of (a) g-C3N4 showed typical diffraction at 27.4° and were indexed to the (002) plane, indicating that g-C3N4 had a d-spacing. The diffraction peaks of Gd2MoO6 were at 28.56°, 31.0°, 34.11°, 38.7°, 45.5°, 47.0°, 49.1°, 53.6°, 57.9° and 59.4°, corresponding to the planes of (321), (231), (600), (312), (512), (042), (602), (123), (921) and (642), respectively. Meanwhile, the g-C3N4/Gd2MoO6 composite diffraction peaks were quite similar and somewhat shifted from the peaks of g-C3N4 and Gd2MoO6. The XRD studies confirmed the formation of the g-C3N4/Gd2MoO6 nanocomposite via non-covalent π–π interaction.
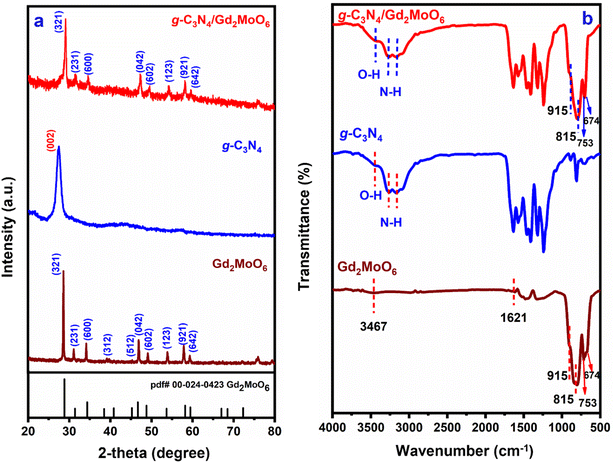 |
| | Fig. 1 (a) XRD patterns of Gd2MoO6, g-C3N4, and g-C3N4/Gd2MoO6 composites, (b) FT-IR spectra of Gd2MoO6, g-C3N4, and g-C3N4/Gd2MoO6 composite. | |
The bonding characteristics and surface modification of the nanocomposite were investigated by FT-IR spectroscopy. The FT-IR spectra of g-C3N4, Gd2MoO6, and g-C3N4/Gd2MoO6 are shown in Fig. 1b. The IR absorption peaks of g-C3N4 at 3169 cm−1 and 3266 cm−1 for the stretching vibration of N–H group. Furthermore, the broadband at 3446 cm−1 was indicative of strong vibrations of the O–H group. The strong peak observed at 810 cm−1 was attributed to the breathing mode of s-triazine units. The synthesized g-C3N4 were similar patterns of strong bonds observed in the range of 1200–1700 cm−1. The strong peak of 1242 cm−1, 1321 cm−1, 1406 cm−1, and 1465 cm−1 corresponded to the aromatic C–N stretching vibrations, and 1573 cm−1 and 1640 cm−1 were indicating the C![[double bond, length as m-dash]](https://www.rsc.org/images/entities/char_e001.gif) N stretching vibrations of g-C3N4.40,43,44 Gd2MoO6 shows the stretching and bending vibrations of O–H bonds of H2O molecules absorbed at the surface at 1621 cm−1 and 3367 cm−1 respectively. The main bands appeared at 753 cm−1, 815 cm−1, and 915 cm−1 ascribed to the Mo–O vibrations and the weak peak at 674 cm−1 for the Gd–O bond. These values are in almost matching with those reported in the literature values.18,20,51,52,54 The FT-IR spectrum of the g-C3N4/Gd2MoO6 composite showed an insignificant variation of Gd2MoO6 and g-C3N4 vibration peak. The FT-IR data implies and confirmed the non-covalent interactions between the Gd2MoO6 complex and g-C3N4.
N stretching vibrations of g-C3N4.40,43,44 Gd2MoO6 shows the stretching and bending vibrations of O–H bonds of H2O molecules absorbed at the surface at 1621 cm−1 and 3367 cm−1 respectively. The main bands appeared at 753 cm−1, 815 cm−1, and 915 cm−1 ascribed to the Mo–O vibrations and the weak peak at 674 cm−1 for the Gd–O bond. These values are in almost matching with those reported in the literature values.18,20,51,52,54 The FT-IR spectrum of the g-C3N4/Gd2MoO6 composite showed an insignificant variation of Gd2MoO6 and g-C3N4 vibration peak. The FT-IR data implies and confirmed the non-covalent interactions between the Gd2MoO6 complex and g-C3N4.
4.2 FESEM and HRTEM studies
FESEM studies were used to study the surface arrangement and combination of the as-prepared g-C3N4/Gd2MoO6 composite. Fig. 2 shows the FESEM images of (A) g-C3N4, (B) Gd2MoO6, and (C) the g-C3N4/Gd2MoO6 composite. The g-C3N4 carbon materials were crumpled, with an exfoliated folding sheet structure. These exfoliated g-C3N4 sheets could provide more area for the interaction with the Gd2MoO6 molecules, which implies the uniform decoration of Gd2MoO6 on the g-C3N4 sheets. The high and low magnification FESEM images of Gd2MoO6 exhibited a randomly arranged hierarchical flower-like structure formation with an average diameter range of 500 nm. Furthermore, the average diameter of the rod-like Gd2MoO6 was estimated to be between 1 and 2 μm.
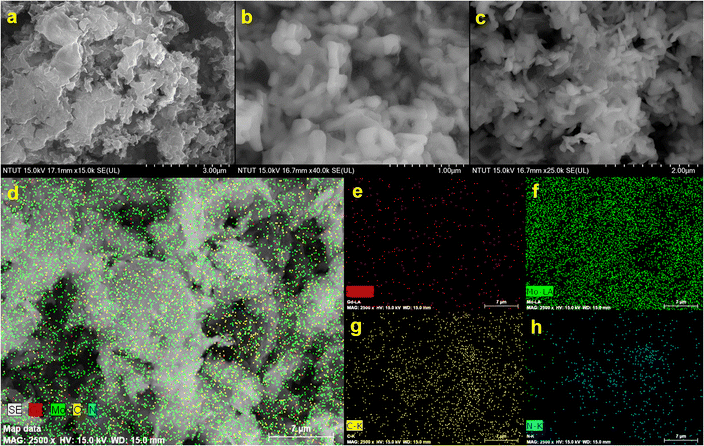 |
| | Fig. 2 FESEM images of (a) g-C3N4, (b) Gd2MoO6, and (c) g-C3N4/Gd2MoO6 nanocomposites at different magnifications. (d) shows the EDX elemental mapping of nanocomposites of (e) Gd, (f) Mo, (g) C, and (h) N. | |
These features of Gd2MoO6 make it easier to increase the contact area and the reactant diffusivity, which is better for increasing the electrocatalytic activity. Furthermore, the surface area of the g-C3N4/Gd2MoO6 composite increased as a result of the good interaction synergy between g-C3N4 and Gd2MoO6. Based on this finding, the g-C3N4/Gd2MoO6 composite be employed well for the NFZ sensor. In addition, energy dispersive X-ray spectra and elemental mapping analysis studies were used to study the chemical composition and distribution of the g-C3N4/Gd2MoO6 composite (Fig. 2d). Gadolinium (Gd), molybdenum (Mo), carbon (C), and nitrogen (N) components were found in the EDS spectrum, without any other contaminants. Additionally, the elemental mapping results in Fig. 2(e)–(h) demonstrated that the gadolinium, molybdate, carbon, and nitrogen in the scanning area were distributed uniformly throughout the g-C3N4/Gd2MoO6 composite. Fig. 3(a)–(c) also depicts HRTEM images of g-C3N4/Gd2MoO6. The g-C3N4 had a wrinkled, folded sheet-like structure. The Gd2MoO6 molecules were depicted in the images as tiny balls and aggregated small cubic structures. Furthermore, the morphology of the g-C3N4/Gd2MoO6 composite revealed that the Gd2MoO6 molecules were randomly dispersed on the g-C3N4 surface.
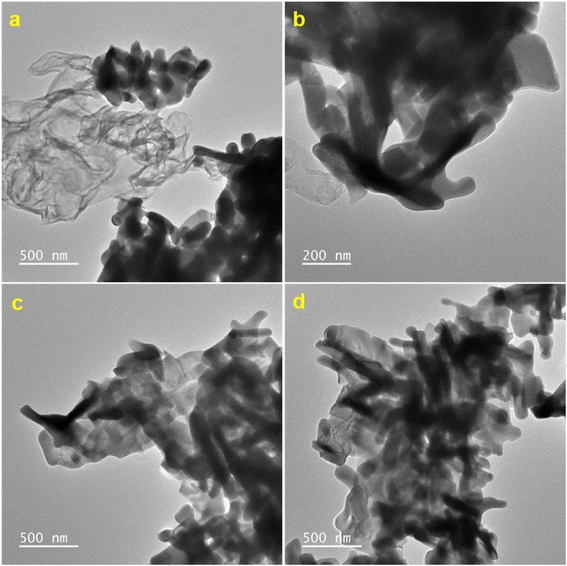 |
| | Fig. 3 (a)–(d) HR-TEM analysis of g-C3N4/Gd2MoO6 nanocomposites. | |
4.3 XPS analysis
Furthermore, as can be seen in Fig. 4, XPS studies were performed to identify the precise elemental composition of the g-C3N4/Gd2MoO6 nanocomposite. The wide scan of the survey spectrum in Fig. 4a exhibited the presence of Gd, Mo, C, N, and O in the g-C3N4/Gd2MoO6 composites. Fig. 4b shows a higher resolution of the Gd 4d spectra located at the binding energies of 141.0 eV and 147.1 eV, which were related to Gd 4d5/2 and Gd 4d3/2, indicating the presence of the oxidized state of Gd3+.20 Fig. 4c shows the Mo 3d spectra at the binding energies of 232.2 eV and 235.4 eV, corresponding to Mo 3d5/2 and Mo 3d3/2, respectively. The core level of Mo 3d indicated the spin–orbit of the Mo6+ state.20 Fig. 4d shows the O 1s spectrum in the range of 529–533 eV. The broad peak indicated the O2− oxidation state of Gd2MoO6.20 Fig. 4e shows the C 1s peak in the range of 281–290 eV. The three peaks in the C 1s spectrum at 286.2 eV, 284.6 eV, and 287.9 eV were attributed to C–O, C–C, and N![[double bond, length as m-dash]](https://www.rsc.org/images/entities/char_e001.gif) C–N, respectively. The C–C peak represented the g-C3N4 defect. The second peak was attributed to the C–O on the surface of the g-C3N4, and the remaining peak of N
C–N, respectively. The C–C peak represented the g-C3N4 defect. The second peak was attributed to the C–O on the surface of the g-C3N4, and the remaining peak of N![[double bond, length as m-dash]](https://www.rsc.org/images/entities/char_e001.gif) C–N was related to the sp2 bonding.45 The high-resolution spectra of N 1s were deconvoluted into three peaks (Fig. 4f), namely, N–(C)3, C
C–N was related to the sp2 bonding.45 The high-resolution spectra of N 1s were deconvoluted into three peaks (Fig. 4f), namely, N–(C)3, C![[double bond, length as m-dash]](https://www.rsc.org/images/entities/char_e001.gif) N–C, and C–N–H, representing binding energies of 400.4, 399.2, and 402.4 respectively. The C
N–C, and C–N–H, representing binding energies of 400.4, 399.2, and 402.4 respectively. The C![[double bond, length as m-dash]](https://www.rsc.org/images/entities/char_e001.gif) N–C peak was attributed to the triazine rings, and the second peak of N–(C3) was attributed to the tertiary nitrogen. The remaining peak of C–N–H indicated the amino functions in the composite material45
N–C peak was attributed to the triazine rings, and the second peak of N–(C3) was attributed to the tertiary nitrogen. The remaining peak of C–N–H indicated the amino functions in the composite material45
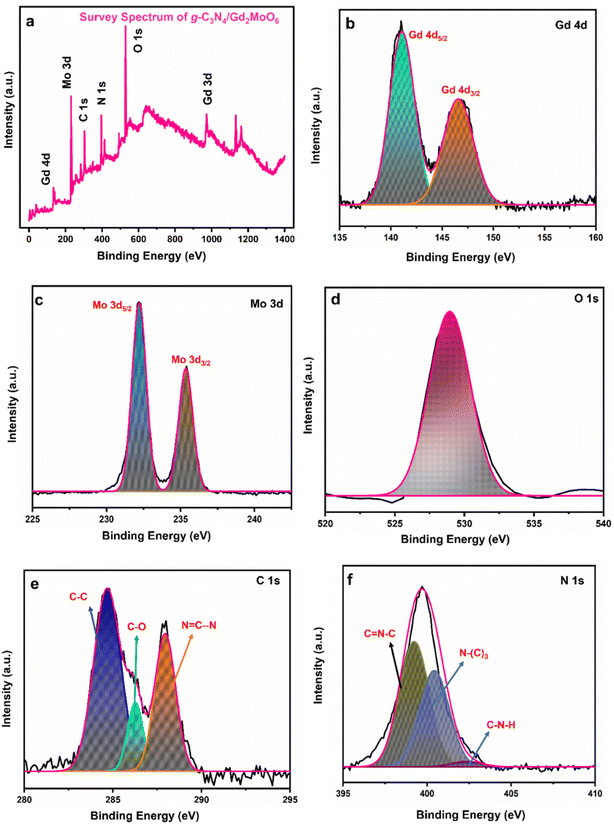 |
| | Fig. 4 XPS analysis of g-C3N4/Gd2MoO6 nanocomposites. (a) Survey spectrum of g-C3N4/Gd2MoO6, (b) Gd 4d, (c) Mo 3d, (d) O 1s, (e) C 1s, and (f) N 1s. | |
4.4 Electrochemical impedance studies
Electrochemical impedance spectra studies are the most important electroanalytical techniques for determining the internal polarization resistance (Rp) between the electrolyte interface and electrode. In this research, such studies were used for the identification of the electron transfer properties of the bare GCE, GCE/Gd2MoO6, GCE/g-C3N4, and GCE/g-C3N4/Gd2MoO6 electrodes. Fig. 5 represents the Nyquist plots of the (a) bare GCE, (b) GCE/Gd2MoO6, (c) GCE/g-C3N4, and (d) GCE/g-C3N4/Gd2MoO6 modified electrodes in 0.1 M KCl at 5 mM [Fe(CN)6]3−/4− in the 100 mHz to 100 kHz frequency range. Both the modified and unmodified bare electrodes showed two distinct regions: a semicircle for the high-frequency region and a straight line for the low-frequency region. The straight portion of the diagram corresponds to the diffusion-limited process, and the broader semicircle indicates the charge transfer resistance (Rct). The inset figure presents the Randles circuit, where Rs, Zw, Rct, and Cdl are electrolyte resistance, Warburg impedance, charge transfer resistance, and double-layer capacitance, respectively. The Rct values of the bare GCE, GCE/Gd2MoO6, GCE/g-C3N4, and GCE/g-C3N4/Gd2MoO6 were calculated at about 235.1 Ω, 198.8 Ω, 119.8 Ω, and 37.1 Ω, respectively. The final nanocomposite had a very low resistivity of about 37.1 Ω because of its high surface area and excellent electron transfer to the electrode and electrolyte.
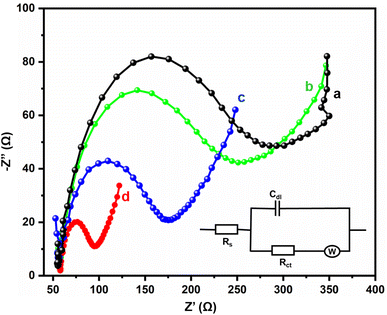 |
| | Fig. 5 EIS investigation of (a) bare GCE, (b) GCE/Gd2MoO6, (c) GCE/g-C3N4, and (d) GCE/g-C3N4/Gd2MoO6 modified electrodes in KCl (0.1 M) at 5 mM [Fe (CN)6]3−/4−. | |
5. Electrochemical reduction studies of NFZ on the GCE/g-C3N4/Gd2MoO6 electrode
5.1 Different film and concentration studies
Fig. 6A illustrates the electrocatalytic activity at (a) bare GCE, (b) GCE/g-C3N4, (c) GCE/Gd2MoO6, and (d) GCE/g-C3N4/Gd2MoO6 in 150 μM of NFZ containing 0.05 M PBS (pH 7). This electrocatalytic behavior was performed by NFZ reduction at the electrode surface. Moreover, the bare GCE exhibited a weak reduction peak potential (Ep) of NFZ at −0.513 V and an anodic reduction peak current (Ipa) of 9.95 μA. In contrast, the GCE/g-C3N4 electrode exhibited a good reduction peak current at (Epa) −0.511 V and an anodic peak current of (Ipa) 36.6 μA. The peak current was higher than those of g-C3N4 and bare GCE electrodes. In addition, the GCE/g-C3N4/Gd2MoO6 composite-modified electrode also exhibited a good NFZ reduction catalytic peak at (Ep) −0.523 V and a peak current of (Ipa) 47.2 μA. The GCE/Gd2MoO6 electrode had a well NFZ irreversible reduction peak that appeared at (Epa) −0.511 V and a cathodic peak current of (Ipa) 31.61 μA. These reduction peaks are indicating that the reduction of nitrofurazone molecules (nitro group) into hydroxylamine derivatives by the 4e− and 4H+ transfer process (Scheme 3).5,6,53 In contrast, the GCE/g-C3N4/Gd2MoO6 electrode showed no reaction without the addition of NFZ. Furthermore, the GCE/g-C3N4/Gd2MoO6 composite showed an increased electrocatalytic signal for NFZ reduction at low potential. The peak current of the different modified electrodes was demonstrated in the bar diagram (Fig. 6B). The GCE/g-C3N4/Gd2MoO6 composite modified electrode demonstrated outstanding electrocatalytic activity with a higher fold peak current response for NFZ than those of the bare GCE, GCE/g-C3N4, and GCE/Gd2MoO6 electrodes. Because the GCE/Gd2MoO6 increases the electrode active area and electron transfer qualities when combined with g-C3N4, it is a superior electrode material for NFZ detection at low voltage. The CV curves for NFZ reduction at various concentrations in N2 saturated 0.05 M PBS are shown in Fig. 6C. The peak current was remarkably increased (R2 = 0.9982) by NFZ at different concentrations. As a result of the π–π stacking interaction and high surface area, the GCE/g-C3N4/Gd2MoO6 composite surface exhibited good electrocatalytic and electron transport responses. The linear relation plot between the concentration and the corresponding peak current is shown in Fig. 6D. Furthermore, for the concentration of the linear equation y = 0.27327 + 0.00511 with the coefficient R2 = 0.9982, the correlation coefficient was almost equal to 1, indicating that the GCE/g-C3N4/Gd2MoO6 modified electrode had an excellent electrocatalytic activity of NFZ.
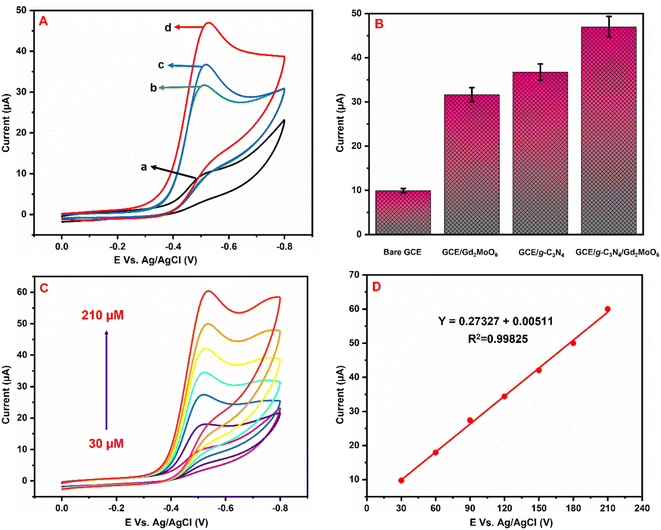 |
| | Fig. 6 (A) Cyclic voltammograms of (a) bare GCE, (b) GCE/Gd2MoO6, (c) GCE/g-C3N4, and (d) GCE/g-C3N4/Gd2MoO6 in 0.05 M PBS (pH 7) with 150 μM of NFZ at a scan rate of 50 mV s−1. (B) Bar diagram of different electrode responses. (C) CV curves of GCE/g-C3N4/Gd2MoO6 electrode at different concentrations of NFZ (30–210 μM). (D) Correspondence to the calibration plot for NFZ concentrations (30–210 μM). | |
 |
| | Scheme 3 Electrochemical detection mechanisms of NFZ over the GCE/g-C3N4/Gd2MoO6 electrode. | |
5.2 pH studies
Fig. 7A shows the electrocatalytic performance of GCE/g-C3N4/Gd2MoO6 electrodes in PBS of various pH (3 to 11) in the presence of 150 μM NFZ at a scan rate of 50 mV s−1. From a low pH to a high pH, the catalytic peak current increased. The peak current obtained a maximum at pH 7.0 and then decreased moderately. As a result, pH 7.0 was chosen as the starting point for all analytical studies. The linear relationship between the NFZ anodic peak potential (Ep) and pH. The slope value of the pH studies was almost identical to that of the Nernst equation. As found in this study, the reduction of NFZ at the GCE/g-C3N4/Gd2MoO6 electrode adopts equal numbers of protons and electrons. The related reduction mechanisms are proposed in Scheme 3. Additionally, the electrochemical reduction of NFZ involves both a chemical and an electrochemical process. The surface area of the working electrode can be calculated using a ferric cyanide system (K3[Fe(CN)6]3−/4−) following the Randles–Sevcik equation.
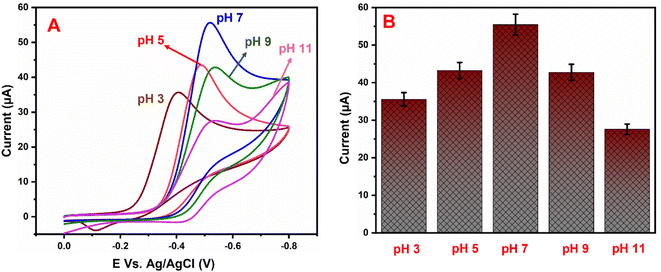 |
| | Fig. 7 (A) Cyclic voltammograms of GCE/g-C3N4/Gd2MoO6 electrode in PBS containing 150 μM NFZ at various pH levels (3–11). (B) pH vs. Ip. | |
As the electrochemical behavior of NFZ and the effect of pH on the GCE/g-C3N4/Gd2MoO6 electrode shows, as the pH rises from 3 to 11, the anodic peak potential of NFZ shifts negatively, which indicates that protons are involved in the reduction reaction. The peak potential (Ep) of the NFZ is linearly correlated with pH, obeying Ep = −0.01319 + 6.131 pH (R2 = 0.994).
| |
 | (1) |
The numbers of electrons and protons that participate in the electrode reaction are represented by m and n in the Nernst eqn (1). The value of m/n was identified to be 0.98 for the NZF sensor. Based on these results, the electrons and protons are identical in the electrochemical sensing of NFZ. This indicates equal numbers of electrons and protons involved in the reduction process.
5.3 Different scan rate studies
Fig. 8A exhibits the influence of scan rate examined by CVs at the GCE/g-C3N4/Gd2MoO6 electrode in 0.05 M PBS with 150 μM NFZ at scan rates of 10–200 mV s−1. Both the scan rate and the cathodic peak currents increased. Fig. 8B shows the plot of Ipa vs. scan rate; Ipa was linearly increased by the scan rate. Furthermore, as the scan rate was increased, the cathodic (Epc) peak potentials migrated to greater negative potentials, respectively. Furthermore, the corresponding linear regression equation was derived as Ipc = 0.1976 + 0.00537 with a correlation coefficient of R2 = 0.9904, which indicated that the NFZ reduction reaction at the GCE/g-C3N4/Gd2MoO6 electrode was surface-controlled.
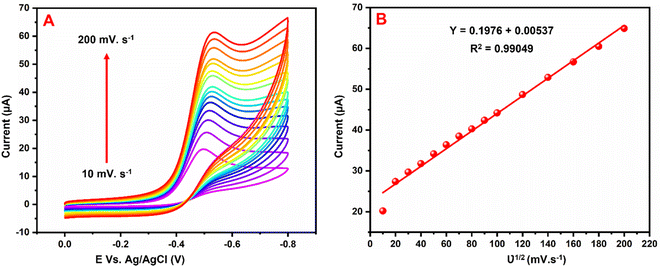 |
| | Fig. 8 (A) CV responses of the GCE/g-C3N4/Gd2MoO6 electrode in PBS with 150 μM of NFZ at various scan rates. (B) Calibration plot of the scan rate vs. NFZ detection peak current. | |
The effect of scan rate on NFZ detection at the GCE/g-C3N4/Gd2MoO6 electrode was investigated via CV technique by altering the scan rate in the range of 10–200 mV s−1. The number of electrons involved in the NFZ detection electrochemical reactions were measured. This result demonstrated an adsorption-controlled reaction of NFZ by showing a linear peak current. Additionally, Ep migrated to a more positive value, and an excellent linear relationship between Ep and the logarithm of the scan rate was revealed as Ep = 0.1976 + 0.00537 ln(R2 = 0.990). According to the Laviron model, the value of n in an adsorption-controlled reaction can be determined by eqn (2).
| |
 | (2) |
Here,
k0,
E0, and
α refer to the electron transfer rate constant, formal potential, and charge transfer coefficient, respectively. The factors of
F,
R, and
T are respectively the Faraday constant, ideal gas constant, and temperature. Based on the slope, the electrochemical reduction of NFZ shows an irreversible reaction. Consequently, the reduction of NFZ is a transfer process involving equal number of electron and proton transfer and the appropriate mechanism is illustrated in
Scheme 3.
46
5.4 Differential pulse voltammetry studies
Fig. 9A illustrates the NFZ reduction at the GCE/g-C3N4/Gd2MoO6 electrode used for DPV studies in 0.05 M PBS solution with various concentrations of NFZ added. The g-C3N4/Gd2MoO6 composite electrode did not show any reduction peaks in the absence of NFZ; however, well-defined reduction peaks (Epa) were obtained at −0.43 V due to the addition of NFZ. However, the reduction peak current was increased by increasing the concentration of NFZ in N2 saturated 0.05 M PBS. Fig. 9B shows the linear relationship between the peak current (Ipa) and the concentration of NFZ. The concentration range for the proposed electrode was measured to be between 0.02 to 2000 μM. The equivalent linear regression equation can be written as y = 0.02775 + 0.00179, R2 = 0.9917. Moreover, the modified electrode had a low detection limit of 0.006 μM (S/N = 3), and the sensitivity was calculated to be 2.057 μA μM−1 cm−2. Table 1 compares the analytical performance of the GCE/g-C3N4/Gd2MoO6 electrode with those of previously published NFZ sensors. The modified electrode has a detection limit of 0.006 μM (S/N = 3) and an electrode sensitivity of 2.057 μA μM−1 cm−2. As can be observed from the comparison, the g-C3N4/Gd2MoO6 composite shows an outstanding detection performance as compared with other reported NFZ sensors. Hence, the GCE/g-C3N4/Gd2MoO6 electrode has the potential for the selective and sensitive detection of NFZ. Moreover, the detection limit of the NFZ at the GCE/g-C3N4/Gd2MoO6 electrode is lower than that of the other modified electrodes such us, Ag+@UiO-66-NH2/CsPbBr3/GCE-ECL electrode (LOD = 0.09 μM),1 Ag-SDS fabricated electrode (LOD = 0.37 μM),5 poly ACBK/GCE electrode (LOD = 0.250 μM),9 [Ru–PMo/PDDAg–GO]3 electrodes (LOD 50.0 μM),4 LMNSs/SPCE electrode (LOD = 0.08 μM),47 Ag2S QDs/g-C3N4 electrode (LOD = 0.054 μM),48 hollow MIL-101/GCE electrode (LOD = 0.01 μM),2 Ag-NPS@CPE electrode (LOD = 0.012 μM),3 WS2QDs electrode (LOD = 0.055 μM)49 and PACBK/GCE electrode (LOD = 0.028 μM)50 exhibit the NFZ detection at long linear response range than other aforementioned modified electrode due to the large surface area as well as the higher electrocatalytic effect.
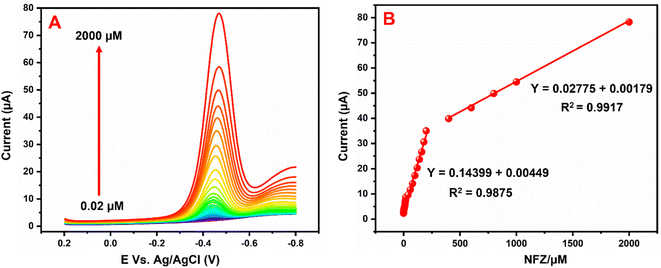 |
| | Fig. 9 (A) DPV response of NFZ reduction at GCE/g-C3N4/Gd2MoO6 electrode in PBS (pH = 7). (B) Linear plot between peak current (Ipa) and NFZ concentration. | |
Table 1 Comparison of GCE/g-C3N4/Gd2MoO6 modified electrode and previously published modified electrodes
| Modified electrode |
Linear range (μM) |
The detection limit (μM) |
Sensitivity (μA μM−1 cm−2) |
Reference |
| Glassy carbon electrode. Silver nanoparticle. Sodium dodecyl sulfate. Acid chrome blue K. Lanthanum molybdate nanospheres. Screen printed carbon electrode. Polydiallydimethyl ammonium chloride. Graphene oxide. Silver sulfide quantum dots. Graphitic carbon nitride. Carbon paste electrode. Tungsten disulfide quantum dots. Poly(acid chrome blue K). Gadolinium molybdate. |
| Ag+@UiO-66-NH2/ |
0.0005–100 |
0.09 |
— |
1 |
| CsPbBr3/GCEa-ECL |
|
|
|
|
| Agb-SDSc |
0.66–47.62, 47.62–930 |
0.37 |
— |
5 |
| Poly ACBKd/GCEa |
0.250 |
— |
9 |
| LMNSse/SPCEf |
0.720–192 |
0.072 |
2.94 |
47 |
| [Ru–PMo12/PDDAg-GOh]3 |
0.010–144 |
0.08 |
0.9511 |
4 |
| 2–350 |
| Ag2S QDsi/g-C3N4j |
0–30 |
0.054 |
— |
48 |
| Hollow MIL-101/GCEa |
0.030–55 |
0.01 |
— |
2 |
| Ag-NPSb@CPEk |
0.04–1000 |
0.012 |
— |
3 |
| WS2 QDsl |
0.17–166 |
0.055 |
— |
49 |
| PACBKm/GCEa |
15–80 |
0.028 |
— |
50 |
| g-C3N4j/Gd2MoO6n |
0.02–2000 |
0.006 |
2.057 |
This work |
5.5 Repeatability and reproducibility studies
The repeatability and reproducibility of the GCE/g-C3N4/Gd2MoO6 electrode were tested by CV studies in the presence of 30 μM NFZ in PBS (pH 7). This electrode had acceptable repeatability with an RSD of about roughly 3.55% for 10 consecutive measurements by a single electrode (Fig. 10A). Furthermore, the GCE/g-C3N4/Gd2MoO6 electrode showed a considerable reproducibility of 3.45% in five experiments performed with ten separate customized electrodes (Fig. 10B). The aforementioned electrode exhibited good repeatability and reproducibility, according to the results.
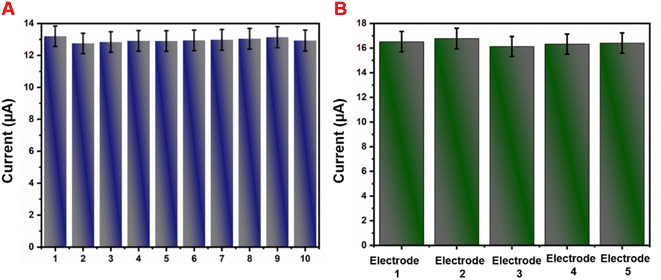 |
| | Fig. 10 (A) The CV curve of GCE/g-C3N4/Gd2MoO6 in the presence of the NFZ repeatability test. (B) Five different GCE/g-C3N4/Gd2MoO6 modified electrodes for reproducibility test. | |
5.6 Interference and stability performance studies
Selectivity is one of the most important characteristics of the developed sensor electrode. Hence, we studied the selectivity behavior of the GCE/g-C3N4/Gd2MoO6 electrode for NFZ detection in the presence of other interfering species. The amperometry responses in Fig. 11A show that the GCE/g-C3N4/Gd2MoO6 exhibited a good reduction peak for each 30 μM addition of (a) NFZ; however, there was no discernible peak detected for each higher fold concentration of interfering material, such as biological molecules, nitro compounds, and heavy metal ions such as (b) ascorbic acid, (c) uric acid, (d) furazolidone, (e) nitrofurantoin, (f) Mg2+, (g) Zn2+, (h) Ca2+ and (i) Pb2. However, even in the presence of those interferent analytes in the electrolyte solution, the addition of 30 μM NFZ exhibited a good detection response. Although the concentrations of metal ions and organic compounds were higher than that of NFZ, there was no voltametric peak change after the addition of interfering ions. The reason was that the NFZ and the GCE/g-C3N4/Gd2MoO6 electrode interacted and interfering species were repelled from the electrode due to the electrostatic repulsion. Therefore, the detection of NFZ was unaffected in the presence of the aforementioned interfering species, implying that the GCE/g-C3N4/Gd2MoO6 electrode has flawless anti-interference capabilities and great selectivity. The storage stability of the GCE/g-C3N4/Gd2MoO6 electrode was tested regularly in PBS containing 30 μM NFZ in an inert atmosphere. Fig. 11B shows an amperometric approach used to test the operational stability of the GCE/g-C3N4/Gd2MoO6 electrode in the presence of 30 μM NFZ for 3000 seconds. The experimental conditions are described in the DPV section, and the oxidized peak current loss from the initial current was just 3.7 percent. The obtained results showed the high operational stability and antifouling capabilities of the GCE/g-C3N4/Gd2MoO6 electrode.
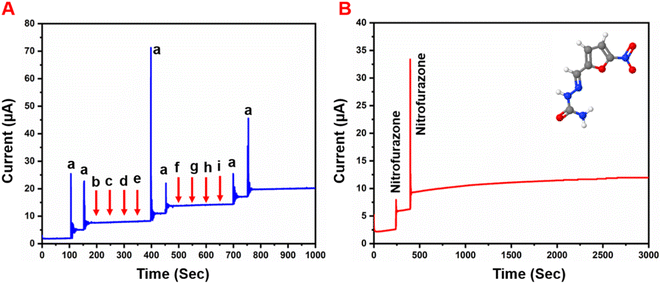 |
| | Fig. 11 (A) Interference studies of GCE/g-C3N4/Gd2MoO6 electrode towards detection of NFZ, (B) g-C3N4/Gd2MoO6 modified RRD electrode operational stability test towards NFZ in 0.05 M PBS (pH 7) up to 3000 s. | |
5.7 Real sample analysis
As shown in Fig. 12, the practical feasibility of the GCE/g-C3N4/Gd2MoO6 electrode was analyzed by sensing NFZ in Fig. 12A human urine and Fig. 12B milk samples with the DPV detection technique. Here, the standard addition method was applied for the sensing of NFZ in real samples. The real sample analysis was conducted at a laboratory temperature under ideal circumstances. Human urine was acquired from healthy men and diluted with PBS (pH 7) solution. Commercial milk samples were obtained from a local store. After being diluted to pH 7.0, the received human urine and milk samples were used immediately for the analysis. Furthermore, NFZ measurements of real samples were performed by electrochemical detection. Increasing the concentration of NFZ increased the reduction peak current response. The acquired results are listed in Table 2. The recovery results on human urine (98.9%) and milk (98.7%) revealed that the spiking and recovery values for the sensing of NFZ were acceptable. The HPLC procedure was also used to detect and compare the concentrations of NFZ in the real samples for purposes of comparison. This result confirmed that there was no discernible difference between these two approaches, showing that this sensor is suitable for voltammetry-based NFZ measurement in food and biological materials. The recovered values and relative standard deviations were good, as well as being similar to those of a previously published NFZ sensor. This real sample study indicates that the GCE/g-C3N4/Gd2MoO6 electrode is a good choice for electrochemical detection of NFZ in various samples. Despite these methods having their advantages such as excellent selectivity, simple operation, high sensitivity, low cost, fast detection, and short response time. However, these electrochemical detection methods have some disadvantages, such as long electrode pretreatment time, poor conductivity of electrode materials, expensive electrode raw materials, and environmental pollution during the electrode material preparation. Moreover, these experimental data were repeated three times for accuracy after we used them for this study.
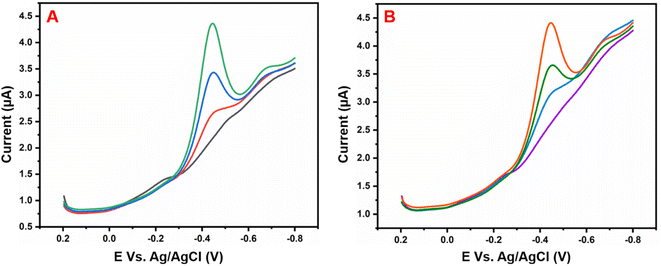 |
| | Fig. 12 Electrochemical sensing of NFZ with the GCE/g-C3N4/Gd2MoO6 electrode in two samples: (A) human urine and (B) milk. | |
Table 2 Real sample analysis of NFZ in water samples
| Sample |
Added (μM) |
Found (μM) |
Recovery (%) |
RSD (%) |
| Human urine |
30 |
29.54 |
98.48 |
3.01 |
| 60 |
59.46 |
99.10 |
1.76 |
| 90 |
89.39 |
99.32 |
2.17 |
| Milk |
30 |
29.36 |
97.89 |
2.73 |
| 60 |
59.42 |
99.04 |
2.23 |
| 90 |
89.42 |
99.36 |
1.48 |
6. Conclusion
In conclusion, the g-C3N4/Gd2MoO6 nanocomposite has been prepared and characterized by different characterization studies. The electrocatalytic activity of the GCE/g-C3N4/Gd2MoO6 electrode was identified by several electrochemical techniques such as cyclic voltammetry, electrochemical impedance, differential pulse voltammetry, and amperometry technique. The proposed g-C3N4/Gd2MoO6 composite has an excellent electrochemical response towards the detection of NFZ, with a very low detection limit of 0.006 μM, high sensitivity of 2.057 μA μM−1 cm−2, and a long linear range of 0.02–2000 μM. Furthermore, the GCE/g-C3N4/Gd2MoO6 electrode shows good selectivity for the detection of NFZ in the presence of similar interfering ions. During NFZ detection on the surface of the GCE/g-C3N4/Gd2MoO6 electrode, the reduction involves equal numbers of electrons and protons. In addition, the GCE/g-C3N4/Gd2MoO6 electrode shows excellent repeatability, stability, and reproducibility. In real sample analysis, the proposed sensor demonstrated great practical feasibility with acceptable recoveries. As a result, the GCE/g-C3N4/Gd2MoO6 electrode is a potential electrode for NFZ detection in aquatic products, biological samples, and pharmacological products so as to enhance their quality and safety. Finally, the electrochemical performance of the GCE/g-C3N4/Gd2MoO6 electrode would be suitable for in vitro toxicity monitoring and food safety administration to protect people life and health.
Conflicts of interest
The authors declare that they have no known competing financial interests or personal relationships that could have appeared to influence the work reported in this paper.
Acknowledgements
The Ministry of Science and Technology, Taiwan, provided funding for this project (MOST 109-2221-E-027-059, 109-2222-E-027-001, MOST 110-2221-E-027-041 and MOST 110-2221-E-027-024). This work was supported by the National Science and Technology Council of Taiwan (NSTC 111-2221-E-027-104). The Precision Research and Analysis Center, National Taipei University of Technology (NTUT), provided the measuring resources.
References
- T. Liu, J. He, Z. Lu, M. Sun, M. Wu, X. Wang, Y. Jiang, P. Zou, H. Rao and Y. Wang, J. Chem. Eng., 2022, 429, 132462 CrossRef CAS.
- T. Gan, J. Li, L. Xu, Y. Yao and Y. Liu, J. Electroanal. Chem., 2019, 848, 113287 CrossRef CAS.
- J. Zoubir, A. Assabbane and I. Bakas, Carbon Lett., 2022, 32(3), 767–780 CrossRef.
- S. Cai, T. Jiao, L. Wang, F. Wang and Q. Chen, Food Chem., 2022, 378, 132084 CrossRef CAS PubMed.
- Y.-S. Lu, W.-Y. Pan, T.-C. Hung and Y.-T. Hsieh, Langmuir, 2020, 36, 11358–11365 CrossRef CAS PubMed.
- T.-W. Chen, E. Tamilalagan, D. A. Al Farraj, S.-M. Chen, A. Muthumariappan, S. Maheshwaran and M. S. Elshikh, Nanotechnology, 2020, 31, 445502 CrossRef CAS PubMed.
- Y. Hiraku, A. Sekine, H. Nabeshi, K. Midorikawa, M. Murata, Y. Kumagai and S. Kawanishi, Cancer Lett., 2004, 215, 41–150 CrossRef PubMed.
- S.-P. Khong, E. Gremaud, J. Richoz, T. Delatour, P. A. Guy, R. H. Stadler and P. Mottier, J. Agric. Food Chem., 2004, 52, 5309–5315 CrossRef CAS PubMed.
- Y. Wang, Y. Guo, K. Pan, X. Lin and Y. Ni, Chem. Afr., 2020, 3(3), 727–734 CrossRef CAS.
- G. Qin, L. Li, W. Bai, Z. Liu, F. Yuan and Y. Ni, Dyes Pigm., 2021, 190, 109309 CrossRef CAS.
- S. Velmurugan, T.-C. K. Yang, J. C. Juan and J.-N. Chen, J. Colloid Interface Sci., 2021, 596, 108–118 CrossRef CAS PubMed.
- D. Guo, P. Zhang, H. Zhang, X. Yu, J. Zhu, Q. Li and T. Wang, J. Mater. Chem. A, 2013, 1, 9024–9027 RSC.
- D. Zhang, R. Zhang, C. Xu, Y. Fan and B. Yuan, Sens. Actuators, B, 2015, 206, 1–7 CrossRef CAS.
- S. Swathi, R. Yuvakkumar, P. S. Kumar, G. Ravi, D. Nanthini and D. Velauthapillai, Fuel, 2022, 308, 122051 CrossRef CAS.
- A. M. Kaczmarek and R. V. Deun, Chem. Soc. Rev., 2013, 42, 8835–8848 RSC.
- E. A. Tkachenko and P. P. Fedorov, Inorg. Mater., 2003, 39, S25–S45 CrossRef CAS.
- R. Karthik, J. V. Kumar, S. M. Chen, T. Kokulnathan, T. W. Chen, S. Sakthinathan, T. W. Chiu and V. Muthuraj, Sens. Actuators, B, 2018, 270, 353–361 CrossRef CAS.
- J. V. Kumar, R. Karthik, S.-M. Chen, K. Natarajan, C. Karuppiah, C.-C. Yang and V. Muthuraj, ACS Appl. Mater. Interfaces, 2018, 10, 15652–15664 CrossRef PubMed.
- J. Zhang, B. Han, P. Huang, J. Yu and L. Zhao, Polyhedron, 2017, 133, 398–403 CrossRef CAS.
- G. Singh, A. Kushwaha and M. Sharma, J. Environ. Chem. Eng., 2021, 9, 106713 CrossRef CAS.
- W. Sun, Z. Chen, Q. Zhang, J. Zhou, F. Li, X. Jin, D. Li and Q. Li, Phys. Chem. Chem. Phys., 2016, 18, 30837 RSC.
- P. Sharma, M. M. Sundaram, D. Singh and R. Ahuja, ACS Appl. Energy Mater., 2020, 3, 12385–12399 CrossRef CAS.
- X. Liu, J.-H. He, R. Sakthivel and R.-J. Chung, Electrochim. Acta, 2020, 358, 136885 CrossRef CAS.
- A. Kumada, Ferroelectrics, 1972, 3, 115–123 CrossRef CAS.
- P. Kumar and B. K. Gupta, RSC Adv., 2015, 5, 24729–24736 RSC.
- B. K. Ponomarev and A. Zhukov, Phys. Res. Int., 2012, 2012, 22 CrossRef.
- G. Li, Z. Wang, Z. Quan, X. Liu, M. Yu, R. Wang and J. Lin, Surf. Sci., 2006, 600, 3321–3326 CrossRef CAS.
- F. Lei, B. Yan and H.-H. Chen, J. Solid State Chem., 2008, 181, 2845–2851 CrossRef CAS.
- Y. Pan, Q. Zhang, C. Zhao and Z. Jiang, Solid State Commun., 2007, 142, 24–27 CrossRef CAS.
- F. Lei and B. Yan, J. Am. Ceram. Soc., 2009, 92(6), 1262–1267 CrossRef CAS.
- S. Vinoth, K. S. S. Devi and A. Pandikumar, Trends Anal. Chem., 2021, 140, 116274 CrossRef CAS.
- V. D. Dang, J. Adorna Jr, T. Annadurai, T. A. N. Bui, H. L. Tran, L.-Y. Lin and R.-A. Doong, Chem. Eng. J., 2021, 422, 130103 CrossRef CAS.
- E. V. Kermani, A. H. Yangjeh, H. D. Khalilabad and S. Ghosh, J. Colloid Interface Sci., 2020, 563, 81–91 CrossRef PubMed.
- K. Prakash, V. Selvam, S. G. Babu, S. Meena and S. Karuthapandian, Appl. Surf. Sci., 2021, 569, 151104 CrossRef CAS.
- X. Yang, F. Qian, G. Zou, M. Li, J. Lu, Y. Li and M. Bao, Appl. Catal., B, 2016, 193, 22–35 CrossRef CAS.
- F. Wang, Z. Liu and L. Shi, Mater. Lett., 2021, 296, 129894 CrossRef CAS.
- M. Sun, Q. Yan, T. Yan, M. Li, D. Wei, Z. Wang, Q. Wei and B. Du, RSC Adv., 2014, 4, 31019–31027 RSC.
- W.-J. Ong, L.-L. Tan, Y. H. Ng, S.-T. Yong and S.-P. Chai, Chem. Rev., 2016, 116, 7159–7329 CrossRef CAS PubMed.
- P. Balasubramanian, M. Annalakshmi, S.-M. Chen and T.-W. Chen, Ultrason. Sonochem., 2019, 50, 96–104 CrossRef CAS PubMed.
- I. Rapti, F. Bairamis and I. Konstantinou, Photochem, 2021, 1, 358–370 CrossRef.
- V. D. Dang, J. J. Adorna, T. Annadurai, T. A. N. Bui, H. L. Tran, L. Y. Lin and R. A. Doong, Chem. Eng. J., 2021, 422, 130103 CrossRef CAS.
- X. Yang, Z. Tian, Y. Chen, H. Huang, J. Hu and B. Wen, J. Alloys Compd., 2021, 859, 157754 CrossRef CAS.
- Y. Zhao, R. Wei, X. Feng, L. Sun, P. Liu, Y. Su and L. Shi, ACS Appl. Mater. Interfaces, 2016, 8, 21555–21562 CrossRef CAS PubMed.
- T. Narkbuakaew and P. Sujaridworakun, Top. Catal., 2020, 63, 1086–1096 CrossRef CAS.
- V. Alman, K. Singh, T. Bhat, A. Sheikh and S. Gokhale, Appl. Phys. A, 2020, 126, 724 CrossRef CAS.
- R. Rani, A. Deep, B. Mizaikoff and S. Singh, J. Electroanal. Chem., 2022, 909, 116124 CrossRef CAS.
- B. Karuppaiah, R. Ramachandran, S.-M. Chen, S. W-Ling and J.-Y. Wan, New J. Chem., 2020, 44, 46–54 RSC.
- H. Wang, F. Pei, C. Liu, Y. Ni, M. Xia, S. Feng, Q. Hao, T. Yang and W. Lei, Spectrochim. Acta, Part A, 2022, 269, 120727 CrossRef CAS PubMed.
- X. Guo, Y. Wang, F. Wu, Y. Ni and S. Kokot, Talanta, 2015, 144, 1036–1043 CrossRef CAS PubMed.
- C. Chen, W. Chen, J. Jiang, L. Qian and F. Qiu, Int. J. Environ. Anal. Chem., 2021, 101, 1099–1115 CrossRef CAS.
- R. Sasikumar and K. Byungki, Colloids Surf., A, 2022, 650, 129593 CrossRef CAS.
- D. L. Shruthi, O. Shanker, L. Gowda, P. Kudige, A. J. Reddy and G. A. Kumar, Mater. Today: Proc., 2022, 49, 824–829 CAS.
- R. Rajakumaran, R. Sukanya, S. M. Chen, R. Karthik, C. B. Breslin and P. M. Shafi, Inorg. Chem., 2021, 60, 2464–2476 CrossRef CAS PubMed.
- E. Tothova, R. Tarasenko, V. Tkac, M. Orendac, M. Hegedus, Z. Dankova, M. Holub, M. Balaz and M. Matik, J. Mater. Sci., 2019, 54, 6111–6121 CrossRef CAS.
|
| This journal is © The Royal Society of Chemistry 2022 |
Click here to see how this site uses Cookies. View our privacy policy here.  Open Access Article
 *ab
*ab
![[thin space (1/6-em)]](https://www.rsc.org/images/entities/char_2009.gif) :
:![[thin space (1/6-em)]](https://www.rsc.org/images/entities/char_2009.gif) 1 ratio, and the mixture was sonicated for 30 minutes to form g-C3N4/Gd2MoO6 composite. After that, the g-C3N4/Gd2MoO6 composite was dried in the oven for further studies. The non-covalent stacking attraction between the g-C3N4 and Gd2MoO6 forms the g-C3N4/Gd2MoO6 composite. Afterward, 5 mg of g-C3N4/Gd2MoO6 composite was dispersed in water (100 μL) and ultra-sonicated for up to 20 minutes at room temperature. After the ultra-sonication, the 10 μL of g-C3N4/Gd2MoO6 composite mixture was drop cast on the precleaned GCE electrode surface and dry at room temperature to form the GCE/g-C3N4/Gd2MoO6 electrode. The prepared GCE/g-C3N4/Gd2MoO6 electrode was used for the electrochemical detection of NFZ. The whole GCE/g-C3N4/Gd2MoO6 electrode preparation procedure is described in Scheme 1.
1 ratio, and the mixture was sonicated for 30 minutes to form g-C3N4/Gd2MoO6 composite. After that, the g-C3N4/Gd2MoO6 composite was dried in the oven for further studies. The non-covalent stacking attraction between the g-C3N4 and Gd2MoO6 forms the g-C3N4/Gd2MoO6 composite. Afterward, 5 mg of g-C3N4/Gd2MoO6 composite was dispersed in water (100 μL) and ultra-sonicated for up to 20 minutes at room temperature. After the ultra-sonication, the 10 μL of g-C3N4/Gd2MoO6 composite mixture was drop cast on the precleaned GCE electrode surface and dry at room temperature to form the GCE/g-C3N4/Gd2MoO6 electrode. The prepared GCE/g-C3N4/Gd2MoO6 electrode was used for the electrochemical detection of NFZ. The whole GCE/g-C3N4/Gd2MoO6 electrode preparation procedure is described in Scheme 1.

![[double bond, length as m-dash]](https://www.rsc.org/images/entities/char_e001.gif) N stretching vibrations of g-C3N4.40,43,44 Gd2MoO6 shows the stretching and bending vibrations of O–H bonds of H2O molecules absorbed at the surface at 1621 cm−1 and 3367 cm−1 respectively. The main bands appeared at 753 cm−1, 815 cm−1, and 915 cm−1 ascribed to the Mo–O vibrations and the weak peak at 674 cm−1 for the Gd–O bond. These values are in almost matching with those reported in the literature values.18,20,51,52,54 The FT-IR spectrum of the g-C3N4/Gd2MoO6 composite showed an insignificant variation of Gd2MoO6 and g-C3N4 vibration peak. The FT-IR data implies and confirmed the non-covalent interactions between the Gd2MoO6 complex and g-C3N4.
N stretching vibrations of g-C3N4.40,43,44 Gd2MoO6 shows the stretching and bending vibrations of O–H bonds of H2O molecules absorbed at the surface at 1621 cm−1 and 3367 cm−1 respectively. The main bands appeared at 753 cm−1, 815 cm−1, and 915 cm−1 ascribed to the Mo–O vibrations and the weak peak at 674 cm−1 for the Gd–O bond. These values are in almost matching with those reported in the literature values.18,20,51,52,54 The FT-IR spectrum of the g-C3N4/Gd2MoO6 composite showed an insignificant variation of Gd2MoO6 and g-C3N4 vibration peak. The FT-IR data implies and confirmed the non-covalent interactions between the Gd2MoO6 complex and g-C3N4.![[double bond, length as m-dash]](https://www.rsc.org/images/entities/char_e001.gif) C–N, respectively. The C–C peak represented the g-C3N4 defect. The second peak was attributed to the C–O on the surface of the g-C3N4, and the remaining peak of N
C–N, respectively. The C–C peak represented the g-C3N4 defect. The second peak was attributed to the C–O on the surface of the g-C3N4, and the remaining peak of N![[double bond, length as m-dash]](https://www.rsc.org/images/entities/char_e001.gif) C–N was related to the sp2 bonding.45 The high-resolution spectra of N 1s were deconvoluted into three peaks (Fig. 4f), namely, N–(C)3, C
C–N was related to the sp2 bonding.45 The high-resolution spectra of N 1s were deconvoluted into three peaks (Fig. 4f), namely, N–(C)3, C![[double bond, length as m-dash]](https://www.rsc.org/images/entities/char_e001.gif) N–C, and C–N–H, representing binding energies of 400.4, 399.2, and 402.4 respectively. The C
N–C, and C–N–H, representing binding energies of 400.4, 399.2, and 402.4 respectively. The C![[double bond, length as m-dash]](https://www.rsc.org/images/entities/char_e001.gif) N–C peak was attributed to the triazine rings, and the second peak of N–(C3) was attributed to the tertiary nitrogen. The remaining peak of C–N–H indicated the amino functions in the composite material45
N–C peak was attributed to the triazine rings, and the second peak of N–(C3) was attributed to the tertiary nitrogen. The remaining peak of C–N–H indicated the amino functions in the composite material45


