 Open Access Article
Highly effective removal of Hg(II) solution using corn bract@MoS2 as a new biomass adsorbent†
Xiaoxu Xu‡
a,
Qihui Guo‡b,
Chengyue Yangb,
Zhuang Hub,
Qifan Chen*a and
Jianshe Hu *b
*b
aCollege of Chemical Engineering and Machinery, Eastern Liaoning University, Dandong, 118001, P. R. China. E-mail: qifan_C405@163.com
bCenter for Molecular Science and Engineering, College of Science, Northeastern University, Shenyang, 110819, P. R. China. E-mail: hujs@mail.neu.edu.cn
First published on 7th November 2022
Abstract
As known, mercury contamination is one of the current environmental issues due to the high toxicity of mercury. Corn bract (CB) is an agricultural by-product, and its final treatment is generally incineration that causes air pollution. In this study, a new type of high-efficiency biomass adsorbent (CB@MoS2) for adsorption of Hg(II) was obtained, and its morphology and structure were characterized with FT-IR, XRD, SEM and TEM. The results showed that when the pH value, Hg(II) ion concentration and adsorption time were 4, 100 mg L−1 and 120 min, the adsorption capacity and removal rate could reach 332.50 mg g−1 and 99.75%. In addition, CB@MoS2 had a good selectivity for Hg(II) ions. The adsorption behavior followed pseudo-second-order kinetics, indicating that the adsorption of Hg(II) ions by CB@MoS2 was a chemical adsorption. After five adsorption–desorption experiments, it still possessed good adsorption performance and effective regeneration. In short, CB@MoS2 has high efficiency and good reusability, and will become a candidate material for the treatment of mercury-containing industrial wastewater.
1. Introduction
Due to rapid industrialization and urbanization, pollution of water by heavy metals is still an issue of increasing concern.1 Heavy metal ions (such as Hg(II)) have high toxicity, bioaccumulation and non-degradability, and their continuous emission is very harmful to the food chain and human health.2,3 Therefore, it is necessary for us to remove heavy metals from aqueous solutions. The Hg(II) ion removal methods include adsorption, biological treatment, chemical precipitation, ion exchange, extraction and other methods.4,5 In the process of heavy metal wastewater treatment, the precipitation method may cause secondary pollution, while the biological method and the ion exchange method are costly and poor in recycling.6,7 In contrast, the adsorption method is widely used in the removal of heavy metal ions due to its low cost, environmental friendliness, easy operation, high efficiency, good reusability and selectivity.8 There are usually two kinds of adsorbents for removing Hg(II): natural materials and synthetic polymers. Compared with other commercial adsorbents, the practical application of synthetic polymers with small specific surface area in removing mercury ions is limited.9 Natural adsorbents include microbial adsorbents, inorganic mineral materials and biomass adsorbents. The adsorption capacity of inorganic mineral materials needs to be increased by chemical or physical modification. When the microbial adsorbent removes higher concentrations of mercury from wastewater, the adsorption effect is limited due to the long microbial culture cycle. Biomass adsorbents have excellent adsorption capacity for heavy metal ions existing in industrial wastewater, and are also good at renewable environmental protection.10Corn bract (CB) is usually burned as an agricultural by-product, and its combustion is considered an important source of carbon in the air.11 The large amount of carbon black produced by burning CB would make the air pollution problem more and more serious. CB contains 54–58% lignocellulose with rich hydroxyl. In addition, hydrophilicity and biodegradability were the significant merits of CB, so there are many advantages when using this material in the field of adsorption.12 For example, CB functionalized with polyethyleneimine was used to remove hexavalent chromium in the water through the concept of “using waste to treat waste”.13
MoS2 is a two-dimensional nanomaterial with a lamellar structure similar to the carbon material graphene. It has a large specific surface area, acid resistance, alkali resistance, high temperature resistance, and stable chemical properties.14,15
In recent years, there are many metal sulfides that can be used as adsorption materials for mercury ions.16,17 Although they have good adsorption capacity, their regeneration capacity is not ideal. Moreover, metal organic framework and other emerging porous materials with good adsorption capacity, their high cost need to be resolved.18,19 Although MoS2 has a good adsorption capacity for heavy metal ions,20 its price is expensive. Considering the price and adsorption effect from the practical application, we choose CB@MoS2 composite material to investigate its adsorption behavior.
Herein, a new biomass adsorbent (CB@MoS2) was constructed by introducing the MoS2 onto CB though a hydrothermal method, and it was used for the adsorption of Hg(II) ions. The adsorption performance of CB@MoS2 was inspected by exploring the effect on Hg(II) ion removal by changing the pH, adsorbent dosage, temperature, adsorption time, initial concentration and coexisting ions and other factors, then, adsorption isotherm and kinetics were applied to describe the adsorption process, finally, the mechanism of CB@MoS2 for Hg(II) was systematically explored.
2. Experimental section
2.1. Materials and instruments
Materials and instruments see ESI (Text S1).†2.2. Preparation of CB@MoS2 composite material
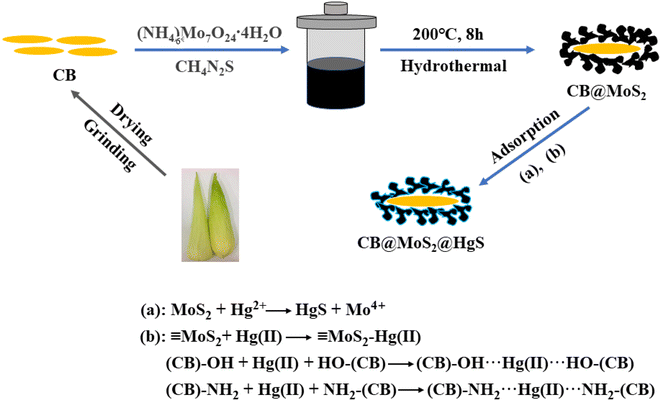
The preparation of CB@MoS2 composite material was shown in Fig. 1. The CB was added in an oven to remove a large amount of water, then cut and ground it into powder, and the MoS2 was loaded on CB by hydrothermal method. First of all, 0.35 g (NH4)6Mo7O24·4H2O and 0.76 g CH4N2S were put into 15 mL of deionized water, subsequent ultrasonic treatment for 30 min to form a uniform solution. Next, 2.4 g processed CB powder was added to the above solution and magnetic stirring for 30 min to make full contact and then dispersed by ultrasonic treatment for 30 min, then the mixture was put into a stainless steel autoclave with polytetrafluoroethylene incubate at 200 °C for 8 h. Finally, the resulting black product was centrifuged multiple times, then washed with ethanol and water multiple times, and finally dried in vacuum at 60 °C for 12 h to obtain a CB@MoS2 (the composition ratio of CB![[thin space (1/6-em)]](https://www.rsc.org/images/entities/char_2009.gif) :
:![[thin space (1/6-em)]](https://www.rsc.org/images/entities/char_2009.gif) MoS2 was 8
MoS2 was 8![[thin space (1/6-em)]](https://www.rsc.org/images/entities/char_2009.gif) :
:![[thin space (1/6-em)]](https://www.rsc.org/images/entities/char_2009.gif) 1) composite material. To study the effect of CB content, the different amounts of CB were added the same solution as above, respectively. According to the results of cost and adsorption effect, the above ratio was selected as the best ratio, and a series of investigations on the adsorption effect of mercury ions were carried out.
1) composite material. To study the effect of CB content, the different amounts of CB were added the same solution as above, respectively. According to the results of cost and adsorption effect, the above ratio was selected as the best ratio, and a series of investigations on the adsorption effect of mercury ions were carried out.
2.3. Adsorption and desorption study
The adsorption performance of the prepared CB@MoS2 was studied as follows. Firstly, to discuss the influence of pH value, 15 mg CB@MoS2 was added to 50 mL of 100 mg L−1 series of solutions for adsorption experiments, and the pH of solution was adjusted from 1 to 8 with HNO3 (0.8 mol L−1) and NaOH (0.1 mol L−1). Because the dosage of adsorbent has a certain effect on the adsorption of Hg(II) ions, the 5–30 mg of adsorbent was added into Hg(II) ion solution (50 mL, 100 mg L−1) at pH 4. Taking the influence of the initial concentration of Hg(II) ions into account, 15 mg CB@MoS2 was added in Hg(II) ion solution (50 mL) with a concentration of 100–500 mg L−1 and a pH of 4. CB@MoS2 (15 mg) and Hg(II) ion solution (pH = 4, V = 50 mL, C = 100 mg L−1) contact time (1–120 min) to evaluate the effect of adsorption time. In the above experiments, the concentration of Hg(II) ions after the adsorption process was measured by mercury vapour analyzer (CG-1C) with the method of direct reading. The adsorption capacity (Qt) and removal rate (R) of CB@MoS2 were measured by eqn (1) and (2).
 | (1) |
 | (2) |
Among them, the adsorption capacity at equilibrium is represented by Qt (mg g−1); the initial concentration of Hg(II) ions is represented by C0 (mg L−1); the equilibrium concentration of Hg(II) ions is represented by Ct (mg L−1); m (g) and V (mL) are the amount of adsorbent (g) and solution volume (mL); R represents the removal rate (%).
3. Results and discussion
3.1. Structure and morphology of the adsorbent
3.2. Effect of mass ratio of CB and MoS2 on adsorption
Fig. 4(a) showed the effect of the different mass ratios of CB and MoS2 on the adsorption capacity of Hg(II). It could be clearly seen that the adsorption capacity of CB@MoS2 composite material could reach the maximum when the ratio was 6![[thin space (1/6-em)]](https://www.rsc.org/images/entities/char_2009.gif) :
:![[thin space (1/6-em)]](https://www.rsc.org/images/entities/char_2009.gif) 1–8
1–8![[thin space (1/6-em)]](https://www.rsc.org/images/entities/char_2009.gif) :
:![[thin space (1/6-em)]](https://www.rsc.org/images/entities/char_2009.gif) 1, and when the ratio was 9
1, and when the ratio was 9![[thin space (1/6-em)]](https://www.rsc.org/images/entities/char_2009.gif) :
:![[thin space (1/6-em)]](https://www.rsc.org/images/entities/char_2009.gif) 1–11
1–11![[thin space (1/6-em)]](https://www.rsc.org/images/entities/char_2009.gif) :
:![[thin space (1/6-em)]](https://www.rsc.org/images/entities/char_2009.gif) 1, its adsorption capacity showed a downward trend. Therefore, the ratio of 8
1, its adsorption capacity showed a downward trend. Therefore, the ratio of 8![[thin space (1/6-em)]](https://www.rsc.org/images/entities/char_2009.gif) :
:![[thin space (1/6-em)]](https://www.rsc.org/images/entities/char_2009.gif) 1 was selected as the best ratio for the next adsorption study.
1 was selected as the best ratio for the next adsorption study.
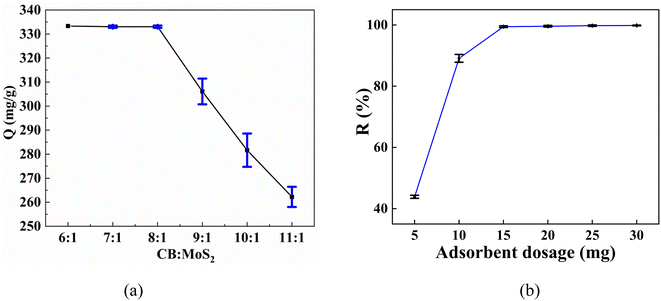 | ||
| Fig. 4 (a) Effect of the mass ratios of CB and MoS2 on the adsorption capacity of Hg(II); (b) effect of adsorbent dosage on uptake of Hg(II). | ||
3.3. Effect of adsorbent dosage
The effect of adsorbent dosage was explored by adding a certain amount of adsorbent (5–30 mg) to the Hg(II) aqueous solution. Fig. 4(b) showed the removal rate under different doses. As the amount of adsorbent increased, the removal rate increased, and when the amount of adsorbent was 15 mg, 99.75% of Hg(II) ions could be removed, and then the removal rate value remains basically unchanged with adsorbent dosage. Therefore, CB@MoS2 with an optimal adsorbent dosage of 15 mg was selected for removing Hg(II) in water.3.4. Effect of pH value on adsorption
The effect of the initial pH on the adsorption performance of the material is very critical, because it affects the ionization level of the material and the form of Hg(II) ions.25 The effect of pH on the adsorption capacity of Hg(II) and Zeta potentials by CB@MoS2 were shown in Fig. 5(a). Based on the image below, the pH value increased from 2 to 8, and the zeta potential on the surface gradually decreased. When the pH value was lower than 4.1, the active surface of CB@MoS2 had a positive charge. First, the adsorption capacity increased significantly as the pH value went from 2.0 to 4.0. As the pH value increased from 4.0 to 8.0, the adsorption capacity was found to decrease. The following the fact could be explained: At lower pH, the binding site was occupied by Hg(II) competing with the high concentration of H+ in the solution, resulting in electrostatic repulsion, so that the formation of Hg(II) coordination complexes would be prevented. The zeta potential of CB@MoS2 gradually decreased as the pH increased from 2 to 4, which reduced the electrostatic repulsion of functional groups and increased the adsorption capacity rapidly. When the pH value was greater than 4.1, Hg(II) cations were easily precipitated in the form of Hg(OH)+ or Hg(OH)2, for which adhere to the active center and hindered the next adsorption.26 So the optimal pH of the adsorbent was 4.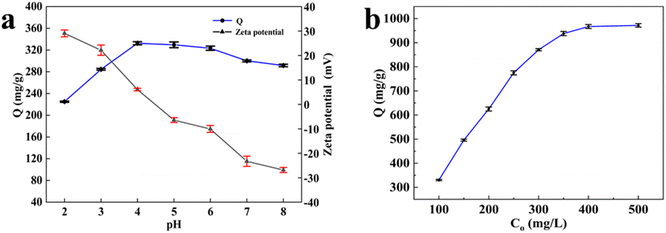 | ||
| Fig. 5 (a) Effect of pH on adsorption of Hg(II) ions; (b) effect of initial concentration on adsorption of Hg(II) ions. | ||
3.5. Effect of Hg(II) concentration and adsorption isotherm
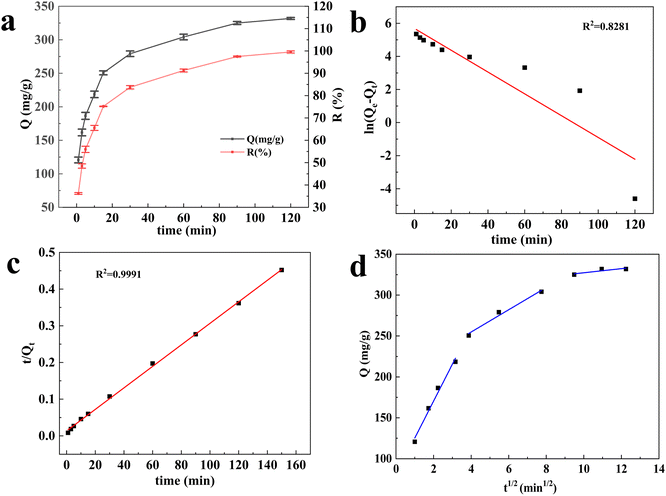
3.6. Effect of contact time on adsorption and adsorption kinetics
For comparison, the adsorption capacity of the reported biomass adsorbents was shown in Table 1. It was found that the adsorption capacity of CB@MoS2 was higher than the reported adsorbents listed in Table 1.
| Adsorbent | Qe (mg g−1) | Ref. |
|---|---|---|
| AT-MCS nano-biosorbent | 246.00 | 28 |
| Cellulose nanofibrils (CNF) | 131.86 | 29 |
| AC – rice husk (RH) | 55.870 | 30 |
| Corn cob activated carbon (CCAC) | 145.80 | 31 |
| PPy-Fe3O4/kaolin | 317.10 | 32 |
| PoVan/CoFe2O4@mSiO2 | 263.60 | 33 |
| Tannic acid cross-linking cellulose/polyethyleneimine (MCP) | 247.51 | 34 |
| This study (CB@MoS2) | 332.50 |
3.7. Effect of temperature and thermodynamic analysis
Fig. 8 showed the effect of the temperature on the adsorption of Hg(II) and the corresponding thermodynamic parameters were listed in Table S3.† The adsorption capacity increased with the temperature from 298 K to 328 K, indicating that increasing the temperature was beneficial to the adsorption process.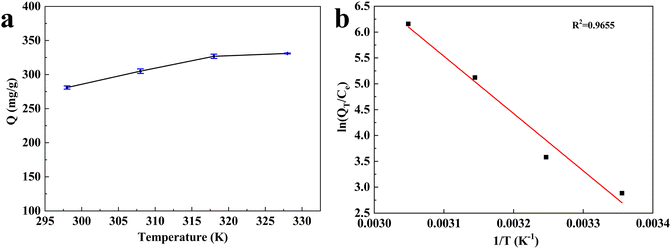 | ||
| Fig. 8 (a) Effect of the temperature on the adsorption of Hg(II), (b) plot dependence of ln(Qt/Ce) on 1/T for the estimation of thermodynamic parameters. | ||
The standard free energy change ΔG decreased with the increase of temperature, which proved that the adsorption process could proceed spontaneously. The positive enthalpy change ΔH showed that the absorption of CB@MoS2 to Hg(II) was an endothermic reaction. The positive entropy change ΔS verified the increase in the randomness of the interface between Hg(II) and CB@MoS2 during the adsorption process.
3.8. Effect of coexisting ions and practical application in industrial wastewater
Various coexisting cations may affect the adsorption performance in the competition. All ion concentrations are 100 mg L−1. Therefore, in this work, Zn2+, Ca2+, Mg2+, Al3+, Pb2+, Cu2+ and Ni2+ were used to study the effects of Hg(II) ions. As shown in Fig. 9(a), the comparison results revealed that the CB@MoS2 exhibited good Hg(II) absorption capacity in the presence of competing cations, which proved the high selectivity to Hg(II). This is mainly because the PKsp of HgS is the largest, so that the sulfide combines with Hg first to form HgS. At the same time, the sulfur atom also had a strong complexing ability for Pb(II).35 Therefore, when Pb(II) and Hg(II) coexist, the adsorbent would have an impact on the adsorption selectivity of Hg(II).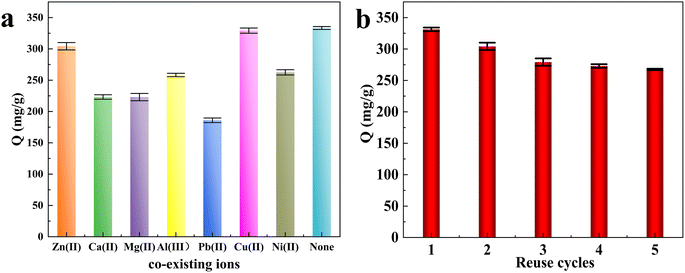 | ||
| Fig. 9 (a) The effect of coexisting cations on the Hg(II) adsorption, (b) regeneration test of CB@MoS2. | ||
Based on the above experiments, the practical application of CB@MoS2 for the adsorption of Hg(II) in industrial wastewater was investigated. The adsorbent (15 mg) was put into the industrial wastewater adjusted to the optimal pH value (pH = 4.0, c = 77.5 mg L−1) for adsorption comparison, it was found that at the optimal pH value, the adsorption capacity was 216.67 mg g−1, and the removal rate was 83.87%.
3.9. Regeneration experiments
The regeneration experiments are particularly important for evaluating the stability of CB@MoS2 and reducing wastewater treatment costs. In the desorption experiment, since HgS is soluble in Na2S and MoS2 is insoluble in Na2S,36 it is treated with Na2S solution to quickly elute the adsorbed mercury ions. The CB@MoS2 attached with Hg(II) was added into a Na2S solution (20 mL, 1 mol L−1), then washed with water several times, dried and reused in the next cycle. As seen in Fig. 9(b), CB@MoS2 still exhibited excellent adsorption performance after five adsorption–desorption cycles. These results indicated that the prepared CB@MoS2 could be effectively regenerated.3.10. Possible adsorption mechanism of CB@MoS2
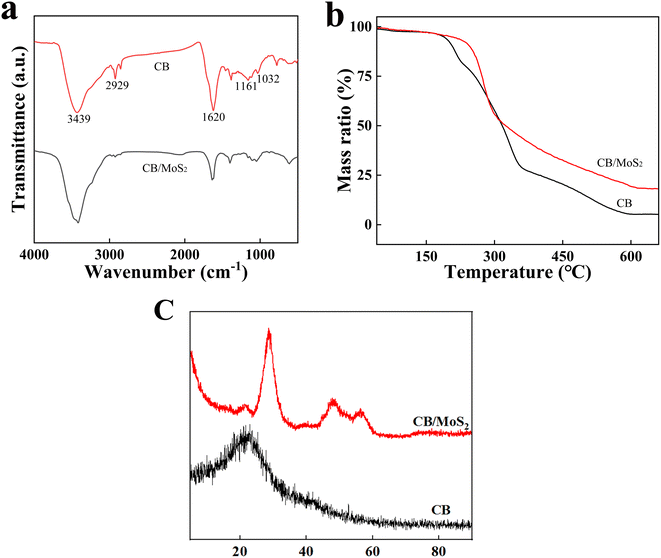
In order to explore the adsorption mechanism of Hg(II), the chemical structure and composition of CB@MoS2 before and after Hg(II) adsorption was analyzed using FT-IR, XRD and XPS techniques. The corresponding results were shown in Fig. S2.†According to Fig. S2,† the XRD patterns of CB@MoS2@Hg confirmed the presence of HgS on the MoS2 surface, and the FT-IR spectra of CB/MoS2@Hg showed that the peak intensity was obviously weakened, which indicating that –OH or –NH2 groups might be involved in the adsorption of Hg(II).
XPS technology at the range of 0–800 electron volts was used to measure the binding energy of CB@MoS2 and CB@MoS2@Hg surface components. As shown in Fig. 10(a), compared with CB@MoS2, new binding energy bands could be observed in the CB@MoS2@Hg spectrum, including Hg 4f, Hg 4d5 and Hg 4d3, which confirmed the adsorption of Hg(II) on CB@MoS2. The appearance of Hg 4f5/2 and Hg 4f7/2 at 104.56 eV and 100.54 eV, respectively, which confirmed that CB@MoS2 had adsorbed Hg(II) (Fig. 10(b)). The comparison before and after adsorption revealed that, except for the C–C, the binding energy of the C–O, O–H and –NH2 had slightly changed (Fig. 10(c–e)). It showed that the –OH and –NH2 groups were chelated with Hg(II), which was consistent with the results of FT-IR spectra analysis. Furthermore, the S 2p spectra of CB@MoS2 were shifted from 162.46 eV of S 2p1/2 and 161.25 eV of S 2p3/2 to 163.54 eV and 162.37 eV (Fig. 10(f)). The intensity of the peak was reduced, and the results indicated that the sulfur group was also chelated with mercury.
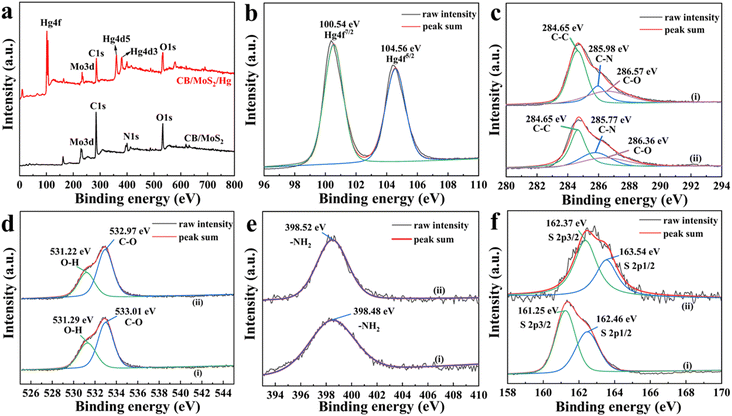 | ||
| Fig. 10 (a) Full survey XPS spectra; (b) high resolution Hg 4f; (c) C 1s; (d) O 1s; (e) N 1s and (f) S 2p spectra of CB@MoS2 (i) before and (ii) after Hg(II) adsorption. | ||
4. Conclusions
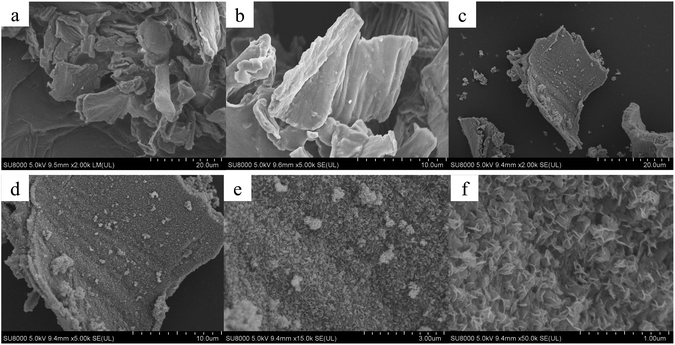
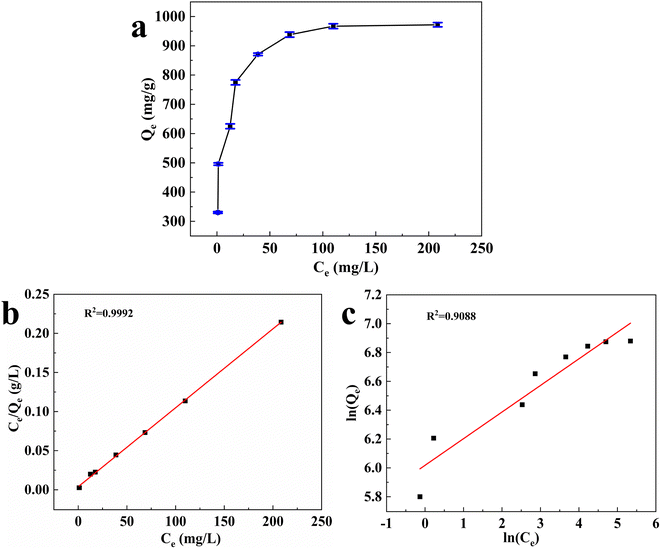
In summary, we reported effective mercury adsorbed materials CB@MoS2 using hydrothermal method. The structure of CB@MoS2 was confirmed by FI-IR, XRD, SEM and TEM. The CB@MoS2 exhibited excellent adsorption performance with the adsorption capacity of 332.50 mg g−1 and removal rate of 99.75% at 120 min, meanwhile, it had good selectivity and reutilization for Hg(II) ions. Moreover, the adsorption performance conformed to the pseudo-second-order model, the L isotherm model and belonged to the spontaneous endothermic process. All in all, the results showed that CB@MoS2 was a fast and economical adsorbent, which have great prospects for removing Hg(II) in industrial wastewater.Conflicts of interest
There are no conflicts to declare.Acknowledgements
This work was supported by the Natural Science Foundation of Liaoning Province (2022-NLTS-15-03) and Science Research Project of Educational Department of Liaoning Province (LNSJYT202014).References
- K. Chen, Z. Zhang, K. Xia, X. Zhou, Y. Guo and T. Huang, ACS Omega, 2019, 4, 8568–8579 CrossRef CAS PubMed.
- Z. Zhang, K. Xia, Z. Pan, C. Yang, X. Wang, G. Zhang, Y. Guo and R. Bai, Appl. Surf. Sci., 2020, 500, 143970 CrossRef CAS.
- Y. Zhao, K. Xia, Z. Zhang, Z. Zhu, Y. Guo and Z. Qu, Nanomaterials, 2019, 9, 455 CrossRef CAS PubMed.
- A. M. Donia, A. A. Atia and K. Z. Elwakeel, J. Hazard. Mater., 2008, 151, 372–379 CrossRef CAS PubMed.
- M. K. Uddin, Chem. Eng. J., 2017, 308, 438–462 CrossRef CAS.
- B. Merzouk, B. Gourich, A. Sekki, K. Madani and M. Chibane, J. Hazard. Mater., 2009, 164, 215–222 CrossRef CAS PubMed.
- T. A. Kurniawan, G. Y. Chan, W. H. Lo and S. Babel, Chem. Eng. J., 2006, 118, 83–98 CrossRef CAS.
- Z. Yu, Q. Dang, C. Liu, D. Cha, H. Zhang, W. Zhu, Q. Zhang and B. Fan, Carbohydr. Polym., 2017, 172, 28–39 CrossRef CAS PubMed.
- F. Lu and D. Astruc, Coord. Chem. Rev., 2018, 356, 147–164 CrossRef CAS.
- P. M. Godwin, Y. Pan, H. Xiao and M. T. Afzal, J. Bioresour. Bioprod., 2019, 4, 31–42 CrossRef CAS.
- C. Xiong, L. Pi, X. Chen, L. Yang, C. Ma and X. Zheng, Carbohydr. Polym., 2013, 98, 1222–1228 CrossRef CAS PubMed.
- F. Ke, L. G. Qiu, Y. P. Yuan, F. M. Peng, X. A. Jiang, J. Xie, Y. H. Shen and J. F. Zhu, J. Hazard. Mater., 2011, 196, 36–43 CrossRef CAS PubMed.
- T. Luo, X. Tian, C. Yang, W. Luo, Y. Nie and Y. Wang, J. Agric. Food Chem., 2017, 65, 7153–7158 CrossRef CAS PubMed.
- Z. Wang and B. Mi, Environ. Sci. Technol., 2017, 51, 8229–8244 CrossRef CAS PubMed.
- C. L. Fausey, I. Zucker, D. E. Lee, E. Shaulsky, J. B. Zimmerman and M. Elimelech, ACS Appl. Mater. Interfaces, 2020, 12, 18446–18456 CrossRef CAS PubMed.
- M. Hu, H. Tian and J. He, ACS Appl. Mater. Interfaces, 2019, 11, 19200–19206 CrossRef CAS PubMed.
- I. R. Pala and S. L. Brock, ACS Appl. Mater. Interfaces, 2012, 4, 2160–2167 CrossRef CAS PubMed.
- L. Huang, M. He, B. Chen and B. Hu, J. Mater. Chem. A, 2015, 3, 11587–11595 RSC.
- G. Yang, H. Han, C. Du, Z. Luo and Y. Wang, Polymer, 2010, 51, 6193–6202 CrossRef CAS.
- Z. Wang, J. Zhang, T. Wen, X. Liu, Y. Wang, H. Yang, J. Sun, J. Feng, S. Dong and J. Sun, Sci. Total Environ., 2020, 699, 134341–134351 CrossRef CAS PubMed.
- L. Guo, S. X. Wang, L. Zhang, T. Hu, S. Cheng, L. K. Fu and C. Xiong, Environ. Pollut., 2019, 244, 938–946 CrossRef PubMed.
- R. K. Liew, W. L. Nam, M. Y. Chong, X. Y. Phang, M. H. Su, P. N. Y. Yek, N. L. Ma, C. K. Cheng, C. T. Chang and S. S. Lam, Process Saf. Environ., 2018, 115, 57–69 CrossRef CAS.
- C. Xiong, S. Wang, L. Zhang, Y. Li, Y. Zhou and J. Peng, J. Mol. Liq., 2018, 254, 340–348 CrossRef CAS.
- J. Sun, Y. Shen and X. Hu, Polym. Bull., 2018, 75, 653–667 CrossRef CAS.
- Y. Fu, Y. Sun, Z. P. Chen, S. M. Ying, J. W. Wang and J. S. Hu, Sci. Total Environ., 2019, 691, 664–674 CrossRef CAS PubMed.
- H. Ge and T. Hua, Carbohydr. Polym., 2016, 153, 246–252 CrossRef CAS PubMed.
- D. G. Trikkaliotis, A. K. Christoforidis, A. C. Mitropoulos and G. Z. Kyzas, Carbohydr. Polym., 2020, 234, 115890–115903 CrossRef CAS PubMed.
- C. Hou, D. Zhao, S. Zhang and Y. Wang, Colloid Polym. Sci., 2018, 296, 547–555 CrossRef CAS.
- V. Bisla, G. Rattan, S. Singhal and A. Kaushik, Int. J. Biol. Macromol., 2020, 161, 194–203 CrossRef CAS PubMed.
- Z. Liu, Y. Sun, X. Xu, J. Qu and B. Qu, ACS Omega, 2020, 5, 29231–29242 CrossRef CAS PubMed.
- Z. Liu, Y. Sun, X. Xu, X. Meng and B. Qu, Bioresour. Technol., 2020, 306, 123154–123160 CrossRef CAS PubMed.
- Z. Lin, Z. Pan, Y. Zhao, L. Qian, J. Shen, K. Xia, Y. Guo and Z. Qu, Removal of Hg2+ with Polypyrrole-Functionalized Fe3O4/Kaolin: Synthesis, Performance and Optimization with Response Surface Methodology, Nanomaterials, 2020, 10(7), 1370 CrossRef CAS PubMed.
- L. Qian, Z. Zeng, S. Zhang, K. Xia and Y. Guo, Magnetic poly-o-vanillin-functionalized core–shell nanomaterials as a smart sorbent for scavenging mercury(II) from aqueous solution, New J. Chem., 2021, 45(32), 14724–14738 RSC.
- Y. Sun, Y. Wu, Y. Fu, C. Y. Yang, J. W. Jiang, G. Yan and J. S. Hu, Int. J. Biol. Macromol., 2021, 182, 1120–1129 CrossRef CAS PubMed.
- Q. Wang, L. Peng, Y. Gong, F. Jia, S. Song and Y. Li, J. Mol. Liq., 2019, 282, 598–605 CrossRef CAS.
- Z. Qu, L. Yan, L. Li, J. Xu, M. Liu, Z. Li and N. Yan, ACS Appl. Mater. Interfaces, 2014, 6, 18026–18032 CrossRef CAS PubMed.
Footnotes |
| † Electronic supplementary information (ESI) available. See DOI: https://doi.org/10.1039/d2ra05638k |
| ‡ These authors contributed equally to this work. |
| This journal is © The Royal Society of Chemistry 2022 |

