 Open Access Article
Identification and classification of particle contaminants on photomasks based on individual-particle Raman scattering spectra and SEM images
Dongxian Li†
abc,
Tao Zhang†a,
Weisheng Yuea,
Ping Gaoa,
Yunfei Luoa,
Changtao Wanga and
Xiangang Luo *ac
*ac
aState Key Laboratory of Optical Technologies on Nano-Fabrication and Micro-Engineering, Institute of Optics and Electronics, Chinese Academy of Sciences, P.O. Box 350, Chengdu 610209, China. E-mail: lxg@ioe.ac.cn
bSchool of Optoelectronic Science and Engineering, University of Electronic Science and Technology of China, P.O. Box 350, Chengdu 610209, China
cSchool of Optoelectronics, University of Chinese Academy of Sciences, Beijing 100049, China
First published on 22nd November 2022
Abstract
Particle contamination of photo masks is a significant issue facing the micro-nanofabrication process. It is necessary to analyze the particulate matter so that the contamination can be effectively controlled and eliminated. In this study, Raman spectroscopy was used in combination with scanning electron microscopy with energy analysis (SEM-EDX) techniques to study the contamination of individual particles on the photomask. From Raman spectroscopic analysis, the Raman bands of particles mainly contributed to the vibrational modes of the elements C, H, O, and N. Their morphology and elemental composition were determined by SEM-EDX. The sizes of the particles are mostly less than 0.8 μm according to the SEM image analysis. Hierarchical clustering analysis (HCA) of the Raman spectra of particles have shown that the particles can be classified into six clusters which are assigned to CaCO3, hydrocarbon and hydrocarbon polymers, mixture of NH4NO3 and few (NH4)2SO4, mixtures metal oxides, D and G peaks of carbon, fluorescent and (NH4)2SO4 clusters. Finally, principal component analysis (PCA) was used to verify the correctness of the classification results. The identification and classification analysis of individual particles of photomask contamination illustrate the chemical components of the particles and provide insights into mask cleaning and how to effectively avoid particle contamination.
Introduction
Photolithography is a critical technique for fabrication of nano chips in integration circuit (IC) industries. The photomask plays an important role in the photolithography process, in which the designed patterns are transferred to wafers by the exposure of the photomasks with UV light. The defects or particles on the photomask will then be imaged on the wafer, which leads to failure of the whole chip fabrication. As lithography moves towards shorter wavelengths, this issue is increasingly becoming a topic of concerns.1,2 According to the International Roadmap for Devices and Systems (IRDS) 2021, the allowed particle for defect size on the photomask is 28 nm for the 3.5 nm technology nodes or below.3 Due to the stringent requirement, measures should be adopted to control the particle contamination of the photomasks. However, it is difficult to strictly control the contamination as the formation of the contamination is complex. The manufacturing process, storage, machinery movement and environment may all be the causes of contamination of the photomask. Once the photomasks are contaminated, it is required to clean the particle on the surface before the lithography process. Therefore, it is important to identify and classify the chemical and physical properties of the particles so that the pollution can be controlled and the particles can be effectively removed. However, most of the metrologies for particle analysis are for the particles number by using principles of light scattering, reflection and absorption. These methods are fast and non-destructive but cannot obtain chemical composition of the particles. Seldom methods are available to obtain chemical compositions of the particles. Due to the complexity and small size of mask patterns, the sensitive and non-destructive analysis of the particles on the photomasks is still a challenge.Chemical compositions of particles on the surface of the photomasks are mostly analyzed using chemical analysis methods, such as thermal desorption gas chromatography–mass spectrometry (TD-GC/MS).4,5 The chemical analyzing methods require complex and time-consuming sample pre-treatment, which may cause damage to the fine patterns of the photomasks. Other methods, such as Auger electron spectroscopy (AES),6 Fourier transform infrared spectroscopy (FTIR),7 time-of-flight secondary ion mass spectrometry (TOF-SIMS),8–10 X-ray photoemission spectroscopy (XPS),11 and energy dispersive X-ray spectroscopy (EDX)12 have been reported to analyze particle contaminants of photomasks. The studies have found that the particulate contamination components are mainly ammonium sulphate salts13 from cleaning chemicals and hydrocarbons10 formed by pollutant exhaust. However, there are some limitations of these methods. The AES, XPS and EDX are performed in a vacuum environment, which limits the size of the mask plate. In addition, the efficiency is low. The FTIR has relatively low sensitivity and it is difficult to analyze particles small than 2 μm due to the large spot size. The TOF-SIMS need to gasify the particles, which may cause damage to mask patterns.
The chemical analyses of contamination particles are mostly bulk analyses, with which many particles are analyzed as a whole. The chemical composition can be obtained at one time in the bulk analysis and the analysis is fast. However, some particles may have some elements lower than detection limit of the bulk analysis and the elemental information may be lost in the bulk analysis. In addition, it is difficult to identify the source of each particle with the bulk analysis. Individual-particle analysis can partly overcome the limitations of bulk analysis. In the past years, individual-particle analysis has been proven to be a useful technique to analyze the physical and chemical properties of aerosol particles to identify the sources of pollution.14–16 Although individual-particle analysis has some advantages over bulk analysis in particle studies, it requires the analyzing instrument to be able to discriminate each particle and then analyze it. EDX, single particle laser spectroscopy, focused proton beam and focused X-ray beam have been used to obtain chemical compositions of individual particles.14,17,18
Raman spectroscopy has received a great deal of attention from all walks of life since its discovery in 1928. The Raman effect has led to an in-depth study of the structure of molecules by spectroscopy, hence the name “fingerprint spectroscopy”, which is specific, fast, sensitive and non-destructive.19–21 Raman shift corresponds to the vibration or rotation mode of the corresponding chemical bond, which can realize the detection and identification of the small particle.22–25 It is therefore of great advantage in the analysis of the structure of compounds. E. M. Malykhin et al. investigated the structure and chemical properties of carbon films under 13.5 nm UV irradiation using Raman and IR spectroscopy, respectively.26 It was found that the deposited carbon films were amorphous carbon based on sp2 carbon, and the mechanism of the formation of this amorphous carbon was briefly described, providing important theoretical support for the subsequent cleaning method. T. Horiuchi et al. detected by Raman that the particulate contamination on the surface consisted mainly of (NH4)2SO4.6 R. J. Naber and K. Saga et al. used Raman spectroscopy for the detection and analysis of asymptotic mask contamination particles.9 The main Raman feature peaks detected included 980–1000 cm−1 (SO4+), 3000–3600 cm−1 (NH4+) and 2800–2900 cm−1 (C–H), while the S–O and N–H bonds were not detected due to the small size of the particles. These studies all demonstrate the enormous potential of Raman to detect particle contamination of masks. In the Raman spectroscopy analysis, the exciting laser beam is highly focused on a small pot of less than 1 μm. The particles of photomasks can be analyzed individually.
In this work, we performed a comprehensive study of particle contaminants on the surface of photomasks by a combination of Raman spectroscopy with SEM-EDX. The individual-particle analysis method is used to discriminate each particle. Raman spectroscopy and EDX readily detect chemical compositions, while SEM readily analyses microscopic morphologies of the particles. The measured spectra of individual particles are analyzed with cluster analysis (HCA and PCA). Cluster analysis is a classification method that integrates disorganized data into several classes based on the correlation or dissimilarity between the classes. According to the cluster analysis, the sources of the particles on the photomasks can be analyzed. To our knowledge, there are very few systematic studies for the detection on the chemical components of mask contamination particles in the literature. This study will help to understand the chemical components of photomask pollution, so as to predict the source of pollution and take effective measures.
Experiment
Measurement methods
Photomasks composed of chromium (Cr) absorption layer and quartz substrates were used for the analysis. The sizes of the patterns of the masks range from 45 nm to a few microns. The masks have been used for producing resist patterns using near-field UV lithography methods. Fig. 1(a) showed an image of dark field optical microscopy of a photomask. Where there are particles, the image will be bright. It was shown that there are a few particles on the photomask after being used for a few times.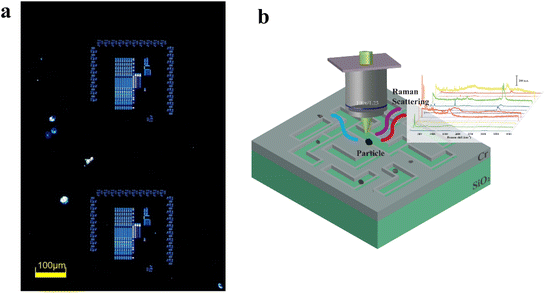 | ||
| Fig. 1 Dark field image of a photomask (a) and schematic of measurement of contaminated particles with Raman spectroscopy (b). | ||
The photomasks were used for direct measurements of the particles with Raman spectroscopy. A total of 200 sample particles were collected in this study. Before doing the Raman spectroscopy measurements, the contaminated particles were detected and position marked with a dark field microscope (Fig. 1(b)). The Raman spectra were obtained using a Horiba LabRaman HR Evolution confocal Raman microscopy system (HORIBA JOBIN YVON, France) equipped with a 532 nm laser and 100–4000 cm−1 in the spectral range. The laser with a spot size of 0.7 μm is focused onto the surface of the particle sample using a 100× objective lens. The acquisition time was set to no exceed 5 s to avoid burning of the particles. The system is calibrated to a silicon substrate standard of 520 cm−1 prior to measurement of particles. Raman spectral data of individual particles were collected randomly over the surface of the photomask.
The morphology and elemental composition of the position-marked particles were characterized by SEM equipped with EDX (Hitachi SU800). The SEM can analyze the morphology of particles down to the nanometer level. The EDX can provide information on the chemical elements of particles with the excitation of characteristic X-ray spectrum of elements by the energy electron beam.
Cluster analysis
Due to the complexity of the tissue, hierarchical cluster analysis (HCA) was applied to classify the spectra of mask contaminant particles. Cluster analysis is a common classification method that integrates disorganised data into of several classes, with some correlation or dissimilarity between the classes. The result of HCA is a tree-like clustering structure of different levels. It can visually determine the data categories based on the tree structure. According to the results of cluster analysis, relevant information and patterns are obtained and a scientific and fast classification model is established. Both hierarchical clustering analysis (HCA) and principal component analysis (PCA) are unsupervised clustering methods that select all spectral features of all Raman bands for automatic clustering, maintaining the integrity of the clusters.27–29 Based on the Raman spectral similarity, a clustering map and several representative Raman spectra for each cluster can be obtained. The reliability and accuracy of system clustering were verified by principal component analysis (PCA). PCA is simply the extraction of the main information in complex data to represent the full information. These key messages are referred to as the main components.Results and discussions
Raman spectroscopy and EDX analysis
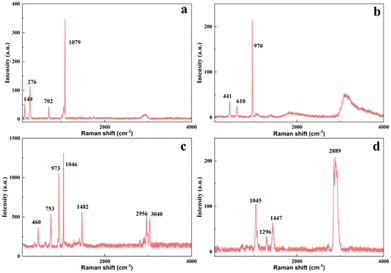
The Raman spectrum of a single particle on the mask is representative of the chemical composition of the particle. The Raman spectrum of a particle can be considered as its “fingerprint”. The source of each particle can be traced according to this “fingerprint” spectrum. Fig. 2 showed some typical types of Raman spectra of the analyzed particles of the photomasks. Some major Raman scattering peaks at 970 cm−1, 1079 cm−1, 1046 cm−1, 1482 cm−1, 2889 cm−1, etc., were identified. As can be seen from the figure, the intensities of all Raman spectra are less than 6000 a.u. and almost all below 2000 a.u. B. J. Grenon et al. examined mask particles with Raman intensities not exceeding 2000 a.u.30 The particles detected by B. J. Grenon et al. had much lower Raman intensities, even when the fluorescence was so strong that their Raman peaks were drowned out.31 R. M. Silver et al. detected particles with Raman intensities of up to about 600 a.u.32 On the one hand this indicates a weaker Raman spectral signal and on the other hand a smaller concentration or size of particles by comparison with the particle morphology. From the Raman peak attribution, it was found that particle contamination came from the vibrational rotation of the C–C bond,![[double bond, length as m-dash]](https://www.rsc.org/images/entities/char_e001.gif) C–H the bending vibration of trans, N–O bond, C–O bond and so on (see Table 1). Most Raman bands are assigned to vibrational modes of C, H, O, and N elements. That is to say, contamination particles were dominated by carbon, oxide and nitrogen. Nonetheless, large numbers of samples require systematic categorization for rapid identification of particulate contamination components.
C–H the bending vibration of trans, N–O bond, C–O bond and so on (see Table 1). Most Raman bands are assigned to vibrational modes of C, H, O, and N elements. That is to say, contamination particles were dominated by carbon, oxide and nitrogen. Nonetheless, large numbers of samples require systematic categorization for rapid identification of particulate contamination components.
| Category | Raman shift (cm−1) | Assignment | Ref. |
|---|---|---|---|
| a | 149 | Ti–O | 33 and 34 |
| 276 | O–O | ||
| 702 | C![[double bond, length as m-dash]](https://www.rsc.org/images/entities/char_e001.gif) O O |
||
| 1079 | C–O | ||
| b | 441 | S–O/S![[double bond, length as m-dash]](https://www.rsc.org/images/entities/char_e001.gif) O O |
35 |
| 610 | S–O/S![[double bond, length as m-dash]](https://www.rsc.org/images/entities/char_e001.gif) O O |
||
| 970 | S–O/S![[double bond, length as m-dash]](https://www.rsc.org/images/entities/char_e001.gif) O O |
||
| c | 460 | Si–O | 35 |
| 753 | O–C–O | ||
| 973 | S–O/S![[double bond, length as m-dash]](https://www.rsc.org/images/entities/char_e001.gif) O O |
||
| 1046 | N–O | ||
| 1482 | C–O | ||
| 2956∼3040 | C–H (asymmetric CH3 stretch, helical and non-helical conformation) | ||
| d | 1045 | N–O | 36 |
| 1296 | CH2 (CH2 twist, trans-conformers) | ||
| 1447 | C–O | ||
| 2889 | CH3 (symmetric CH3 stretch, helical and non-helical conformation) |
EDX measurements of the particles were performed as a complementary way to understand the chemical compositions. The EDX has advantage to analyze inorganic components. A typical Raman spectrum and corresponding EDX elemental analysis of two particles was shown in Fig. 3. From these, it was clearly found that a represented a calcium salt particle and b represented a carbon containing particle. We simply divided all particles into two main categories of elements based on this. One class of particles mainly contained Si, O, Cr, and Fe. The mask is prepared by coating a quartz substrate with a chromium film before forming the lithographic pattern, so it maybe comes from the mask. Another class of particles contained mainly Ca, Na, C, S, O and some other minor elements. Photolithography is exposed under vacuum conditions and the reaction of various component materials (photoresists, micro sensors, etc.) during the exposure process will release some volatile gases, the common gas components are mainly NH3, CO2, SO2 and some organic volatile gases (e.g. acetone). Calcium is chemically active and can form a layer of oxide (calcium oxide) or a film of nitride (calcium nitride) on its surface in the air. These components adhere to the surface of optical components and break under the energy of laser, reacting with water vapour to form carbon deposits and oxide particles, resulting in a reduction in reflectance, transmittance and throughput of optical components, affecting the printing performance of mask patterns and chip preparation. The third class of particles contained very few identified elements, such as Ti. The origins of these particles were not clear. In addition, there may be some light elements that were not detected due to the detection limit of the EDX.
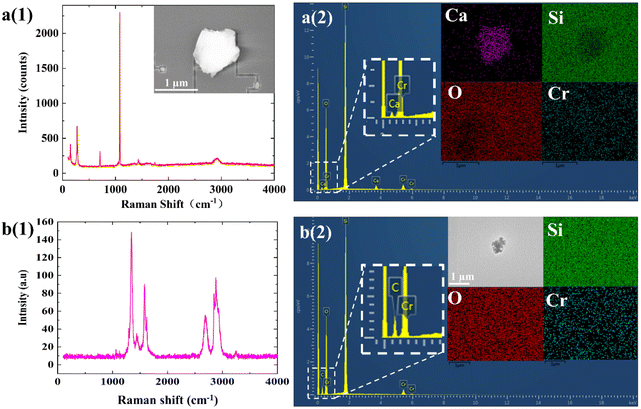 | ||
| Fig. 3 A typical Raman spectrum (a(1) and b(1)) and corresponding EDX (a(2) and b(2)) elemental analysis of two particles. | ||
By analyzing the individual particles using SEM-EDX, these contamination particles were observed and identified based on their morphologies and elemental composition. A preliminary guess is that it contains a composition of calcium carbonate, ammonium sulphate, silica and other components.
Particle morphology analysis
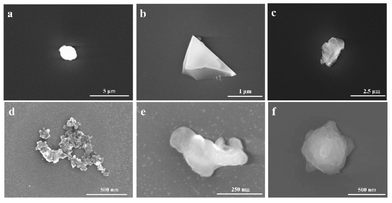
As the morphology of the particles is highly dependent on the origin and sources of the particles, the morphologies of the particles were measured using SEM. Fig. 4 illustrated some typical SEM images of the measured particles. According to the SEM images, the particles were classified into 6 types based on the morphology loaded on the mask. The first type of particles is, in most cases, nearly spherical (Fig. 4(a)). This particle type was the most abundant. The second type of particle morphology looks like crystals, having sharp edges (Fig. 4(b)). These particles are likely from dust in the air or some broken pieces in the process. The third morphology is nearly rectangular (Fig. 4(c)). The particles may be some sulphate or nitrate salts formed by the photochemistry process. The fourth morphology is a chain or cluster formed by many particles aggregated together (Fig. 4(d)). These types of particles are identified as carbonaceous particles, which come from soots in the air or exhausted C-contained gases. The fifth type is other irregular shapes (Fig. 4(e)). The last type is nearly flower shape (Fig. 4(f)). These types of particles are some salts formed by photochemical reactions. Other particles might be formed in more complex ways.Particle morphology was analyzed qualitatively by Image-J software to study the size of the particles. We use equivalent diameter (Dequ) to estimate the size of the irregular particles. In the calculation, the size of the particles is calculated as the diameter of a spherical particle with the same area. The calculation is using the equation:37
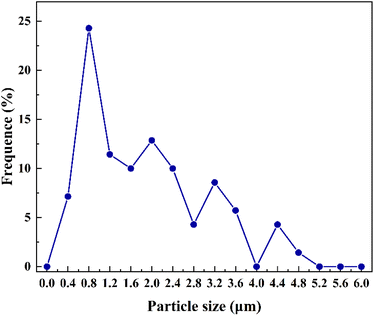
70 particles were measured for the size. The number-size distribution of individual particles in the masks measured from the SEM images is shown in Fig. 5. It showed that the measured particles are mainly in a diameter range of less than 0.8 μm. The largest proportion of the size distribution is smaller than 2 μm, which meant that a large number of particles exist in small sizes, mostly at the micron level or even the nano level. B. J. Grenon et al. reported particles of about 0.5 μm in size.31 R. M. Silver et al. detected particles with a size of 1 μm.32 W. Staud et al. observed nucleation particles smaller than 5 μm and elongated particles larger than 10 μm.38 B. J. Grenon et al. discovered a large growth of 10 μm sized particles on the mask.30 R. J. Naber et al. prepared and analyzed defective particles of 0.5 μm.9 T. Horiuchi et al. characterised and analysed the haze particles for 1 μm × 0.3 μm and 0.1 μm × 0.1 μm.6 However, for the sub-resolution size of 40 nm on the mask (corresponding to 22 nm nodes and below), the allowable particle size is 18 nm.39 Therefore, detection techniques for smaller nodes need to be further developed.
Cluster analysis of particles
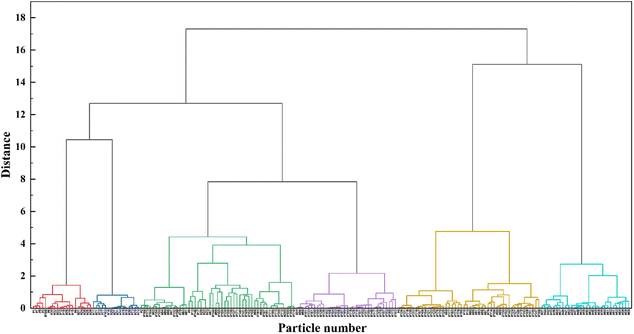
In order to get a more comprehensive understanding of the pollution sources, source apportionment was carried out based on the “fingerprints” of individual particles. Based on the above analysis, the Raman spectra of all contamination particles can be found to be more complex. Therefore, hierarchical cluster analysis was used to standardize the Raman spectral data, choosing the sum of squares of the deviations (ward) as the distance between classes and absolute correlation as the distance type. The Raman spectra of the classification results were shown in Fig. 6. The horizontal axis represented the connectivity and vertical axis illustrated the similarity, representing the distance between each pair. In chemical analysis, the greater the distance between the dendrograms, the greater the difference between the samples. The 200 samples can be divided into 14 classes when ward is 3, into 6 classes when distance is 6, and finally clustered into one class when distance is 17–18. After comparative analysis, the best clustering was achieved when the distance was 6, at which point the 200 particles were classified into 6 clusters.The 200 particles samples were divided into 6 main clusters, with 10% of the first category, 8% of the second, 26% of the third, 17% of the fourth, 24% of the fifth and 15% of the sixth. The Raman spectral characteristic peaks and assignments analysis are in Table 2.
| Cluster | Component | Raman shift (cm−1) | Ref. |
|---|---|---|---|
| 1 | CaCO3 | 153, 281, 713, 1085, 1437, 1749, 2885 | 33 and 40 |
| 2 | Hydrocarbon and hydrocarbon polymers | 1081, 1300, 1443, 2885 | 36 |
| 3 | Mixture of NH4NO3 and few (NH4)2SO4 | 138, 462, 541, 757, 937, 1043, 1472, 2959, 3039 | 35 |
| 4 | Mixtures metal oxides | 217, 284, 397, 541, 1010, 1086, 1288 | 41 and 42 |
| 5 | D and G peaks of carbon and fluorescent | 1346, 1588 | 43 |
| 6 | (NH4)2SO4 | 441, 611, 973, ∼3124 | 35 |
The first cluster was mainly calcium carbonate (CaCO3) and mostly circular in shape. In this cluster of the Raman spectra of CaCO3, the Raman shifts were attributed to 153 cm−1, 281 cm−1, 713 cm−1 and 1085 cm−1, 1437 cm−1, and 1749 cm−1. The C–O vibrations of the internal carbonate group at room temperature and pressure were mainly two lattice vibrations at 153 cm−1 of advection and at 281 cm−1 of oscillation, in-plane bending vibrations at 713 cm−1, symmetric stretching vibrations at 1085 cm−1, antisymmetric stretching vibrations at 1437 cm−1 and out-of-plane bending vibrations at 1749 cm−1. 33,40 The second cluster was mainly hydrocarbon and mainly the vibration peak of the C–C bond and C–H bond. This Raman shift were attributed to 1081 cm−1, 1300 cm−1, 1443 cm−1 and 2885 cm−1. These Raman shifts were attributed to the vibration of the C–C stretch, CH2 twist, CH2 bend + asymmetric CH3 bend and asymmetric CH2 stretch, respectively. In addition these mixtures also contained hydrocarbon polymers.36 The third cluster was mainly a mixture of ammonium nitrate (NH4NO3). Mixtures Raman shifts were attributed to 138 cm−1, 462 cm−1, 541 cm−1, 757 cm−1, 937 cm−1, 1043 cm−1, 1472 cm−1, 2959 cm−1 and 3039 cm−1. 1043 cm−1 was attributed to the vibration of the N–O bond of nitrate. The remaining Raman shift was attributed to a mixture of NH4NO3 and a few ammonium sulphates ((NH4)2SO4).35 The fourth cluster was mainly mixtures of metal oxides. The Raman shifts were attributed to 217 cm−1, 284 cm−1, 397 cm−1, 541 cm−1, 1010 cm−1, 1086 cm−1and 1288 cm−1. Mixtures of metal oxides mainly included iron oxide (FeO, Fe3O4, Fe(OH)2 and Fe2O3) and chromium oxides (Cr2O3).41,42 The fifth cluster category was mainly the D and G peaks of carbon and fluorescent. Of these, 1346 cm−1 and 1588 cm−1 belonged to the D and G peaks of carbon, respectively.43 This type of contamination may be caused by soot in the air environment during transport or storage transfer. Fluorescent had no very distinctive characteristic Raman shift and the Raman peak was almost swamped by the fluorescence signal. This is one of the disadvantages of Raman detection. The sixth cluster was mainly ammonium sulphate ((NH4)2SO4). The Raman shifts of (NH4)2SO4 were attributed to 441 cm−1, 611 cm−1, 973 cm−1 and 3124 cm−1. The Raman shifts of 441 cm−1, 611 cm−1 and 973 cm−1 were mainly from vibrations of SO4+, and ∼3124 cm−1 was from broad overlap peak of NH4−.35
According to the hierarchical cluster results, three of the particle samples were misclassified as cluster 3, three particles were misclassified as cluster 4 and five particles were misclassified as cluster 5. It was possible that some of the particles were so small that only one characteristic peak appeared and the others were not evident and therefore classified as other. Additionally, some particles had low peak Raman feature intensities and fluorescent signals so strong that the Raman signal is ignored and classified as fluorescent. After calculation, the sensitivity of the complete data set classification was 94.5%.
The Raman spectra of the measured particles were compared with Raman spectra database KnowItAll that is built in LabSpec6 software. The chemical components such as calcium carbonate and ammonium sulphate were identified as the main types of particles by the comparisons, which were consistent with classification. However, due to the complexity of particulate matter and limitation of the database, and there are some particles unidentified.
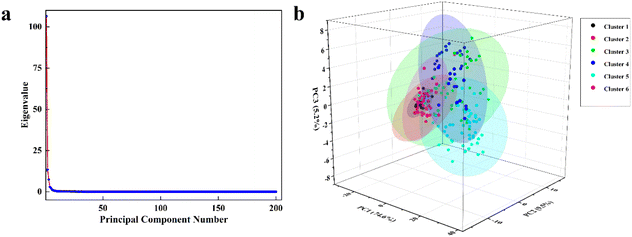
Hierarchical cluster analysis is suitable for simple data scenarios and is more complex to calculate for larger data volumes. For the accuracy of the classification, principal component analysis (PCA) was also selected for validation. PCA allows the projection of high-dimensional data onto a two- or three-dimensional plane. For the 200 particles of high-dimensional Raman data in this paper, the PCA method can be effectively used for dimensionality reduction analysis.
The full Raman spectrum was first processed to baseline subtraction and normalization. Then, the covariance matrix was selected for PCA calculation. Fig. 7(a) illustrated the calculation results of eigenvalue of all the PCs. Based on these results, the Raman spectrum information of the above particle samples were extracted three principal components, and the total contribution rate can reach 89.2%. The contribution rates of PC1, PC2 and PC3 are 74.6%, 9.5% and 5.2%, which means the extracted three principal components can represent the whole Raman spectrum information. At this point 200 Raman spectra were extracted into 3 PCs, a significant reduction in workload.
A scatter plot of the classification results was shown in Fig. 7(b). One of the dots represented the Raman spectrum of a particle. Most importantly, the above six clusters of particle samples can be distinguished after the PCA. The first and second clusters are similar because they have relatively similar Raman characteristic peaks. Therefore, the two common unsupervised recognition methods are suitable for contaminate particles information on the data in this study.
The identification and classification of the particles types help to take measures to control and remove particles more effectively in laboratories and industries. For the particle control, we need to reduce the particles from environment, operations and machines. For the removal of the contamination, some particles such as calcium carbonate and ammonium sulphate can be removed by conventional semiconductor cleaning process. For some secondary particles that are caused by photochemical reaction in the UV exposure process, adding inert gases in the exposure process may help to reduce the formation. For other particles, the removal need to according to the chemical composition.
Conclusions
We present Raman spectroscopy and SEM-EDX study of particle contaminants of photomasks. Around 200 particles were analyzed using the Raman spectra technique and SEM-EDX. The particles have shown complex Raman spectra, with most of the Raman bands being ascribed to the vibrational modes of the elements C, H, O and N. EDX analysis of the particles has shown that elemental species of the particles were Si, O, Cr, Fe, Ca, Na, C, S and some other minor elements. SEM-EDX results indicated that the sizes of the contaminated particles were mostly in the range of 0–0.8 μm Subsequently, HCA combined with Raman spectral was used to meticulously classify the complex pollution particles into six broad categories: CaCO3 cluster, Hydrocarbon and hydrocarbon polymers cluster, Mixture of NH4NO3 and few (NH4)2SO4 cluster, Mixtures metal oxides cluster, D and G peaks of carbon and fluorescent cluster and (NH4)2SO4 cluster. The sensitivity of classification results can be to 94.5%. The classification results in 6 were further validated using PCA, which extracted the main contributing components of all the Raman data. The total contribution rates of PC1, PC2 and PC3 can reach 89.2%. The classification of the Raman spectra of particles identified the main types particle contaminations, which helps to understand the formation of the particles and take measure to control and reduce the particle contamination of photomasks. This study shows that Raman spectroscopy is a useful tool for directly measuring the molecular composition of individual photomask particles.Author contributions
Dongxian Li: methodology, investigation, data Curation, writing – draft and editing; Tao Zhang: investigation, visualization, data Curation and editing; Weisheng Yue: conceptualization, editing, investigation and supervision; Ping Gao: resources: Yunfei Luo: administration; Changtao Wang: review and editing; Xiangang Luo: conceptualization, resources, funding acquisition and editing.Conflicts of interest
There are no conflicts to declare.Acknowledgements
This work was supported by National Natural Science Foundation of China (62275248 and 61875202), Youth Innovation Promotion Association of Chinese Academy of Sciences (2021377) and Sichuan Science and Technology Program (2022YFG0001 and 2020ZDZX0018).References
- K. Y. Naohiro Tango, M. Shirakawa, K. Ou, A. Goto, M. Fujita, Y. Shiraishi and T. Fujimori, J. Photopolym. Sci. Technol., 2019, 32, 445–448 CrossRef.
- N. Sun, N. Ansari, R. Srivastava, Y. Kimura and G. Kamarthy, in Extreme Ultraviolet, ed. N. F. Felix and A. Lio, 2021, vol. 11609 Search PubMed.
- Yield Enhancement, International Roadmap for Devices and Systems, 2021 UPDATE, IEEE, YE IRDS, 2021 Search PubMed.
- T. Horiuchi, Y. Kim, J. Lee, Y. Choi and C. Kim, Presented in part at the Photomask and Next-Generation Lithography Mask Technology XV, 2008 Search PubMed.
- S. C. Hervé Fontaine, G. Demenet and F. Piallat, Presented in part at the 26th European Mask and Lithography Conference, 2010 Search PubMed.
- T. Horiuchi, H. Akutsu, S. Yamaguchi, K. Otsubo, M. Tamaoki, A. Shimazaki, R. Yoshimura, F. Aiga and T. Tada, Presented in part at the Photomask and Next-Generation Lithography Mask Technology XV, 2008 Search PubMed.
- B. S. Kasprowicz, P. D. Buck, B. J. Grenon and D. Brinkley, Presented in part at the Photomask Technology 2016, 2016 Search PubMed.
- M. Hoga, J. Choi, S. Lee, Y. Cho, S. Ji, B. C. Cha, S. W. Choi and W. S. Han, Presented in part at the Photomask and Next-Generation Lithography Mask Technology XIII, 2006 Search PubMed.
- R. J. Naber, K. Saga, H. Kawahira and H. Kawahira, Presented in part at the Photomask Technology 2007, 2007 Search PubMed.
- W. Maurer, B. J. Grenon and F. E. Abboud, Presented in part at the Photomask Technology 2011, 2011 Search PubMed.
- N. Yoshioka, J.-J. Kim, J. Choi, S. Koh, M. Kim, J. Lee, H.-S. Lee, B. G. Kim and C.-u. Jeon, Presented in part at the Photomask Japan 2016: XXIII Symposium on Photomask and Next-Generation Lithography Mask Technology, 2016 Search PubMed.
- Y. Hsu, Y. Satou, H.-J. Lee, Z. Huang and A. Ando, Presented in part at the Photomask Japan 2019: XXVI Symposium on Photomask and Next-Generation Lithography Mask Technology, 2019 Search PubMed.
- P. P. Naulleau, J. Choi, O. R. Wood Ii, S. Novak, Y. Kandel, G. Denbeaux, H.-s. Lee, A. Ma and F. Goodwin, Presented in part at the Extreme Ultraviolet (EUV) Lithography III, 2012 Search PubMed.
- W. Yue, X. Li, J. Liu, Y. Li, X. Yu, B. Deng, T. Wan, G. Zhang, Y. Huang, W. He, W. Hua, L. Shao, W. Li and S. Yang, Sci. Total Environ., 2006, 368, 916–925 CrossRef CAS.
- B. Zeb, K. Alam, A. Sorooshian, T. Blaschke, I. Ahmad and I. Shahid, Aerosol Air Qual. Res., 2018, 18, 1431–1447 CrossRef CAS.
- H. K. Al-Shidi, H. Sulaiman and S. M. Alrubkhi, Int. J. Environ. Health Res., 2020, 32, 738–751 CrossRef.
- W. Yue, Y. Li, X. Li, X. Yu, B. Deng, J. Liu, T. Wan, G. Zhang, Y. Huang, W. He and W. Hua, J. Synchrotron Radiat., 2004, 11, 428–431 CrossRef CAS PubMed.
- A. Priebe, J.-P. Barnes, T. E. J. Edwards, E. Huszar, L. Pethoe and J. Michler, Anal. Chem., 2020, 92, 12518–12527 CrossRef CAS.
- Y. Li, L. Peng, J. Fu, X. Dai and G. Wang, Analyst, 2022, 147, 1099–1105 RSC.
- R. Hao, J. Zhao, J. Liu, H. You and J. Fang, Anal. Chem., 2022, 94, 11230–11237 CrossRef CAS PubMed.
- J. Shao, X. Liu, P. Chen, Q. Wu, X. Zheng and K. Pei, J. Phys. Chem. A, 2014, 118, 3168–3174 CrossRef CAS.
- A. Kuizova, M. Prikryl, M. Prochazka and E. Kocisova, Spectrochim. Acta, Part A, 2021, 262, 120109 CrossRef CAS PubMed.
- T. Gong, Y. Luo, H. Zhang, C. Zhao, W. Yue, M. Pu, W. Kong, C. Wang and X. Luo, J. Mater. Chem. C, 2020, 8, 1135–1142 RSC.
- M. S. S. Bharati and V. R. Soma, Opto-Electron. Adv., 2021, 4, 210048 CAS.
- N. Feng, J. Shen, C. Li, Q. Zhao, E. K. Fodjo, L. Zhang, S. Chen, Q. Fan and L. Wang, Analyst, 2022, 147, 1866–1872 RSC.
- E. M. Malykhin, V. A. Krivchenko, D. V. Lopaev, T. V. Rakhimova and S. M. Zyryanov, Moscow Univ. Phys. Bull., 2011, 66, 54–58 CrossRef.
- J. Sun, Y. Lu, L. He, J. Pang, F. Yang and Y. Liu, TrAC, Trends Anal. Chem., 2020, 122, 115754 CrossRef CAS.
- R. Bro and A. K. Smilde, Anal. Methods, 2014, 6, 2812–2831 RSC.
- M. Tahir, M. I. Majeed, H. Nawaz, S. Ali, N. Rashid, M. Kashif, I. Ashfaq, W. Ahmad, K. Ghauri, F. Sattar, I. Jawad, M. A. Ghauri and M. A. Anwar, Spectrochim. Acta, Part A, 2020, 237, 118408 CrossRef CAS.
- B. J. Grenon, K. Bhattacharyya and B. Eynon, Presented in part at the 22nd European Mask and Lithography Conference, 2006 Search PubMed.
- B. J. Grenon, K. Bhattacharyya, K. R. Kimmel, W. W. Volk, B. J. Grenon, D. Brown and J. Ayala, Presented in part at the 22nd Annual BACUS Symposium on Photomask Technology, 2002 Search PubMed.
- R. M. Silver, B. J. Grenon, K. Bhattacharyya, W. W. Volk, K. A. Phan and A. Poock, Presented in part at the Metrology, Inspection, and Process Control for Microlithography XVIII, 2004 Search PubMed.
- X. Yuan, C. Gao and J. Gao, Mineral. Mag., 2018, 83, 191–197 CrossRef.
- P. Waleska and C. Hess, Catal. Lett., 2018, 148, 2537–2547 CrossRef CAS.
- M. Wang, N. Zheng, D. Zhao, J. Shang and T. Zhu, Environ. Sci. Technol., 2021, 55, 10243–10254 CrossRef CAS PubMed.
- K. A. Prokhorov, G. Y. Nikolaeva, E. A. Sagitova, P. P. Pashinin, M. A. Guseva, B. F. Shklyaruk and V. A. Gerasin, Laser Phys., 2018, 28, 045702 CrossRef.
- P. G. Satsangi and S. Yadav, Int. J. Environ. Sci. Technol., 2013, 11, 217–232 CrossRef.
- W. Staud, F. Eschbach, J. T. Weed, D. Selassie, P. Sanchez, D. Tanzil, V. Tolani, M. Toofan, H. Liu, B. Greenebaum, M. Murray and R. Villacorta, Presented in part at the 24th Annual BACUS Symposium on Photomask Technology, 2004 Search PubMed.
- R. P. Venkatesh, M.-S. Kim and J.-G. Park, in Developments in Surface Contamination and Cleaning, 2017, vol. 9, pp. 135–173, DOI:10.1016/b978-0-323-43157-6.00005-7.
- L. Chuangjiang and Z. Haifei, Spectrosc. Spectral Anal., 2012, 32, 378–382 Search PubMed.
- L. Zhang, Z. Huang, H. Shao, Y. Li and H. Zheng, Mater. Des., 2016, 105, 234–239 CrossRef CAS.
- S. Ramya, D. N. G. Krishna and U. K. Mudali, Appl. Surf. Sci., 2018, 428, 1106–1118 CrossRef CAS.
- Y. Park, K. P. S. S. Hembram, R. Yoo, B. Jang, W. Lee, S.-G. Lee, J.-G. Kim, Y.-I. Kim, D. J. Moon, J.-K. Lee and J.-K. Lee, J. Phys. Chem. C, 2019, 123, 14003–14009 CrossRef CAS.
Footnote |
| † Dongxian Li and Tao Zhang contributed equally to this paper. |
| This journal is © The Royal Society of Chemistry 2022 |

