 Open Access Article
A crystal defect led zero thermal quenching β-NaYF4![[thin space (1/6-em)]](https://www.rsc.org/images/entities/h2_char_2009.gif) :
:![[thin space (1/6-em)]](https://www.rsc.org/images/entities/h2_char_2009.gif) Eu3+,Dy3+ red emitting phosphor†
Eu3+,Dy3+ red emitting phosphor†
Shaokun Lingb,
Chang Chenb,
Kai Mengb,
Yifeng Yanb,
Junyun Mingb,
Sen Liao *ab and
Yingheng Huang*b
aSchool of Chemistry and Chemical Engineering, Guangxi University, Nanning, Guangxi 530004, China. E-mail: liaosen@gxu.edu.cn; liaosen380@sina.com; Fax: +86 771 3233718; Tel: +86 771 3233718
bSchool of Resources, Environment and Materials, Guangxi University, Nanning, Guangxi 530004, China. E-mail: huangyingheng@163.com; lsk0708@163.com; 249443176@qq.com; 1006779688@qq.com; 1024487385@qq.com; 2945539376@qq.com
First published on 27th October 2022
Abstract
Red-light phosphors with extraordinary and stable thermal luminous properties must urgently be explored under the circumstances that commercial phosphors are suffering from serious thermal quenching effects and a lack of red-light components. Synthesized by a one-step hydrothermal method, a new type of NaYF4![[thin space (1/6-em)]](https://www.rsc.org/images/entities/char_2009.gif) :
:![[thin space (1/6-em)]](https://www.rsc.org/images/entities/char_2009.gif) 0.065Eu3+,0.003Dy3+ phosphor with notable thermal luminous stability is reported in this study. As well as energy transfer between Dy3+ and Eu3+, this novel red-light phosphor manifests zero thermal quenching (ZTQ) performance under an increasing temperature of measurement. The ZTQ property stems from the interior defects of the crystal produced by the non-equivalence replacement between distinct ions. Density Functional Theory (DFT) calculations were utilized to verify the formation energy of two kinds of defects that make a vital contribution to the ZTQ performance of the NaYF4
0.065Eu3+,0.003Dy3+ phosphor with notable thermal luminous stability is reported in this study. As well as energy transfer between Dy3+ and Eu3+, this novel red-light phosphor manifests zero thermal quenching (ZTQ) performance under an increasing temperature of measurement. The ZTQ property stems from the interior defects of the crystal produced by the non-equivalence replacement between distinct ions. Density Functional Theory (DFT) calculations were utilized to verify the formation energy of two kinds of defects that make a vital contribution to the ZTQ performance of the NaYF4![[thin space (1/6-em)]](https://www.rsc.org/images/entities/char_2009.gif) :
:![[thin space (1/6-em)]](https://www.rsc.org/images/entities/char_2009.gif) 0.065Eu3+,0.003Dy3+ phosphor. This finding could make some contributions towards research into improving thermal luminous properties and stability.
0.065Eu3+,0.003Dy3+ phosphor. This finding could make some contributions towards research into improving thermal luminous properties and stability.
1. Introduction
Since the birth of the commercial light emitting diode (LED) in 1968, LEDs have been applied in various fields due to its merits of being energy saving and environmentally friendly1–3 such as basic illumination,4 cultivation of plants,5,6 indoor illumination in hospitals for physical health care,7 and as a backlight source for large scale LCDs.8,9 The WLED is the most important and famous application of LEDs and is used in various application fields. Up to now, it is the most successful method that combines a YAG![[thin space (1/6-em)]](https://www.rsc.org/images/entities/char_2009.gif) :
:![[thin space (1/6-em)]](https://www.rsc.org/images/entities/char_2009.gif) Ce3+ yellow emitting phosphor with a blue-light emitting semiconductor InGaN chip to obtain white light.10,11 However, current commercial WLEDs illumination systems suffer from a shortage of high correlated color temperatures (CCTs) and low color rendering indexes (CRIs) due to the deficiency of red-light components.12,13 YAG
Ce3+ yellow emitting phosphor with a blue-light emitting semiconductor InGaN chip to obtain white light.10,11 However, current commercial WLEDs illumination systems suffer from a shortage of high correlated color temperatures (CCTs) and low color rendering indexes (CRIs) due to the deficiency of red-light components.12,13 YAG![[thin space (1/6-em)]](https://www.rsc.org/images/entities/char_2009.gif) :
:![[thin space (1/6-em)]](https://www.rsc.org/images/entities/char_2009.gif) Ce3+ phosphors present serious quenching of luminous intensity at high operating temperatures,14–16 which diminishes the luminous properties of WLEDs. To overcome these shortcomings, research into stable and reliable red-light performance is prompted by the shortage of current commercial WLEDs.
Ce3+ phosphors present serious quenching of luminous intensity at high operating temperatures,14–16 which diminishes the luminous properties of WLEDs. To overcome these shortcomings, research into stable and reliable red-light performance is prompted by the shortage of current commercial WLEDs.
Eu2+ doped nitride-based red phosphors provide a new approach to resolve the problem of a lack of a red-light source with high chemical and luminous stability for WLEDs. Sr[LiAl3N4]![[thin space (1/6-em)]](https://www.rsc.org/images/entities/char_2009.gif) :
:![[thin space (1/6-em)]](https://www.rsc.org/images/entities/char_2009.gif) Eu2+ was reported as a novel type of red phosphor with zero thermal quenching red light emitting property in a temperature range from 300 K to 600 K.17 Other researchers have reported that Li2CaSi2N4 based phosphors present zero thermal quenching and color tunable properties.18 These reports indicate that nitride-based phosphors have an enormous potential to be an ideal matrix for red-light emission phosphors. Unfortunately, the major obstacle limiting further application of nitride-based red-light phosphors is high synthesis costs induced by the rigorous synthesis condition that require high synthetic temperature and purity of atmosphere. To successfully synthesize nitride-based phosphors, it is necessary to keep the raw materials in a highly pure N2 atmosphere. For example, Sr[LiAl3N4]
Eu2+ was reported as a novel type of red phosphor with zero thermal quenching red light emitting property in a temperature range from 300 K to 600 K.17 Other researchers have reported that Li2CaSi2N4 based phosphors present zero thermal quenching and color tunable properties.18 These reports indicate that nitride-based phosphors have an enormous potential to be an ideal matrix for red-light emission phosphors. Unfortunately, the major obstacle limiting further application of nitride-based red-light phosphors is high synthesis costs induced by the rigorous synthesis condition that require high synthetic temperature and purity of atmosphere. To successfully synthesize nitride-based phosphors, it is necessary to keep the raw materials in a highly pure N2 atmosphere. For example, Sr[LiAl3N4]![[thin space (1/6-em)]](https://www.rsc.org/images/entities/char_2009.gif) :
:![[thin space (1/6-em)]](https://www.rsc.org/images/entities/char_2009.gif) Eu2+ was synthesized in a mixed atmosphere (N2
Eu2+ was synthesized in a mixed atmosphere (N2![[thin space (1/6-em)]](https://www.rsc.org/images/entities/char_2009.gif) :
:![[thin space (1/6-em)]](https://www.rsc.org/images/entities/char_2009.gif) H2 = 95
H2 = 95![[thin space (1/6-em)]](https://www.rsc.org/images/entities/char_2009.gif) :
:![[thin space (1/6-em)]](https://www.rsc.org/images/entities/char_2009.gif) 5) at 1000 °C and lasted for 2 hours.17 Li2CaSi2N4 was prepared in a 0.4 MPa N2 atmosphere heated to 1000 °C and lasted for 4 hours.18
5) at 1000 °C and lasted for 2 hours.17 Li2CaSi2N4 was prepared in a 0.4 MPa N2 atmosphere heated to 1000 °C and lasted for 4 hours.18
The trivalent europium ion, Eu3+, is considered as an ideal red-light source, due to its extraordinary red photoluminescence performance in inorganic substrates.19 Furthermore, Eu3+ red-light luminous materials, such as Y2O2S![[thin space (1/6-em)]](https://www.rsc.org/images/entities/char_2009.gif) :
:![[thin space (1/6-em)]](https://www.rsc.org/images/entities/char_2009.gif) Eu3+ and Y2O3
Eu3+ and Y2O3![[thin space (1/6-em)]](https://www.rsc.org/images/entities/char_2009.gif) :
:![[thin space (1/6-em)]](https://www.rsc.org/images/entities/char_2009.gif) Eu3+, have been commercialized in LEDs and are the most well-known and successful red-light sources. Unfortunately, Y2O3
Eu3+, have been commercialized in LEDs and are the most well-known and successful red-light sources. Unfortunately, Y2O3![[thin space (1/6-em)]](https://www.rsc.org/images/entities/char_2009.gif) :
:![[thin space (1/6-em)]](https://www.rsc.org/images/entities/char_2009.gif) Eu3+ phosphors suffer from serious thermal quenching that diminishes the luminous performance with increasing temperature.20 Furthermore, Y2O2S
Eu3+ phosphors suffer from serious thermal quenching that diminishes the luminous performance with increasing temperature.20 Furthermore, Y2O2S![[thin space (1/6-em)]](https://www.rsc.org/images/entities/char_2009.gif) :
:![[thin space (1/6-em)]](https://www.rsc.org/images/entities/char_2009.gif) Eu3+ phosphors may decompose and release sulfides.21 This sulfide will not only lead to degeneration of luminous properties, but may also have a harmful effect on human health. These fatal defects constrain the utilization of Y2O2S
Eu3+ phosphors may decompose and release sulfides.21 This sulfide will not only lead to degeneration of luminous properties, but may also have a harmful effect on human health. These fatal defects constrain the utilization of Y2O2S![[thin space (1/6-em)]](https://www.rsc.org/images/entities/char_2009.gif) :
:![[thin space (1/6-em)]](https://www.rsc.org/images/entities/char_2009.gif) Eu3+ and Y2O3
Eu3+ and Y2O3![[thin space (1/6-em)]](https://www.rsc.org/images/entities/char_2009.gif) :
:![[thin space (1/6-em)]](https://www.rsc.org/images/entities/char_2009.gif) Eu3+ red-light phosphors. It is urgent to synthesize a novel type of host material for red-light Eu3+ phosphors which possesses outstanding thermal luminous and chemical stability.
Eu3+ red-light phosphors. It is urgent to synthesize a novel type of host material for red-light Eu3+ phosphors which possesses outstanding thermal luminous and chemical stability.
Fluorides, due to their superior chemical stability, low possibility of non-radiative transitions, and low phono energy, have a high potential as a matrix for luminescence ions. Mn4+-doped fluoride phosphors, such as K2TiF6![[thin space (1/6-em)]](https://www.rsc.org/images/entities/char_2009.gif) :
:![[thin space (1/6-em)]](https://www.rsc.org/images/entities/char_2009.gif) Mn4+ and K2SiF6
Mn4+ and K2SiF6![[thin space (1/6-em)]](https://www.rsc.org/images/entities/char_2009.gif) :
:![[thin space (1/6-em)]](https://www.rsc.org/images/entities/char_2009.gif) Mn4+, were reported.22,23 These phosphors also exhibit outstanding red-light properties. However, unfortunately, the synthesis of Mn4+-doped fluoride phosphors utilize HF frequently, which inevitably could cause physical harm to the human body and is not suitable for commercial production. Most importantly, fluorides have superb compatibility for luminous lanthanide ions.24–26 Possessing the various merits of fluorides, NaYF4 is considered as one of the most suitable host materials for lanthanide luminous ions. As reported previously, Yb3+ and Er3+ co-doped NaYF4 nanoparticles were employed to improve the accuracy of miRNA detection,27 indicating selected chemical stability and safety of NaYF4 for the human body. Unlike nitride-based phosphors, there are distinct synthesis strategies to obtain NaYF4 phosphors with high chemical stability and luminous properties, such as electrospinning,28 thermal decomposition,29 co-precipitation,30 and the hydrothermal method.31,32 In these mentioned synthesis methods, the hydrothermal method is the most cost-effective synthesis compared with thermal decomposition and electrospinning. Moreover, the hydrothermal method has better safety and operational processes.33 Compared with the co-precipitation method that synthesizes cubic NaYF4 (α-NaYF4), the hydrothermal method can obtain hexagonal NaYF4 (β-NaYF4) which possesses outstanding optical property compared to α-NaYF4.
Mn4+, were reported.22,23 These phosphors also exhibit outstanding red-light properties. However, unfortunately, the synthesis of Mn4+-doped fluoride phosphors utilize HF frequently, which inevitably could cause physical harm to the human body and is not suitable for commercial production. Most importantly, fluorides have superb compatibility for luminous lanthanide ions.24–26 Possessing the various merits of fluorides, NaYF4 is considered as one of the most suitable host materials for lanthanide luminous ions. As reported previously, Yb3+ and Er3+ co-doped NaYF4 nanoparticles were employed to improve the accuracy of miRNA detection,27 indicating selected chemical stability and safety of NaYF4 for the human body. Unlike nitride-based phosphors, there are distinct synthesis strategies to obtain NaYF4 phosphors with high chemical stability and luminous properties, such as electrospinning,28 thermal decomposition,29 co-precipitation,30 and the hydrothermal method.31,32 In these mentioned synthesis methods, the hydrothermal method is the most cost-effective synthesis compared with thermal decomposition and electrospinning. Moreover, the hydrothermal method has better safety and operational processes.33 Compared with the co-precipitation method that synthesizes cubic NaYF4 (α-NaYF4), the hydrothermal method can obtain hexagonal NaYF4 (β-NaYF4) which possesses outstanding optical property compared to α-NaYF4.
In this study, Eu3+ and Dy3+ were chosen as the activator and sensitizer, respectively. The energy transfer between Dy3+ and Eu3+ could occur due to the higher energy level of the 4F9/2 of the Dy3+ ion compared to the 5D0 and 5D1 of the Eu3+ ion.34–36 The existence of Dy3+ leads to an improvement of the red-light emitting properties for Eu3+. A one-step hydrothermal method was utilized to synthesize a Eu3+ and Dy3+ co-doped hexagonal NaYF4 phosphor with outstanding chemical stability and thermal luminous performance. DFT calculations were used to determine the factor responsible for the extraordinary thermal luminous properties, which is distinct from other Eu3+-doped NaYF4 phosphors37,38 without intriguing thermal luminous properties. This study could make a contribution to tackling the problem of the lack of stable red-light components in high temperature working conditions.
2. Experimental
2.1 Experiment process
A series of NaYF4![[thin space (1/6-em)]](https://www.rsc.org/images/entities/char_2009.gif) :
:![[thin space (1/6-em)]](https://www.rsc.org/images/entities/char_2009.gif) 0.065Eu3+,xDy3+ (x = 0, 0.001, 0.002, 0.003, 0.004, and 0.005) were synthesized by a one-step hydrothermal method. The details of the synthesis are as follows: (i) NaNO3 (2 mol L−1), Y(NO3)3 (1 mol L−1), Eu(NO3)3 (1 mol L−1), Dy(NO3)3 (1 mol L−1), and NH4F (6 mol L−1) solutions were prepared. (ii) NaNO3, Y(NO3)3, Eu(NO3)3, and Dy(NO3)3 solutions were mixed with a stoichiometric ratio of 1
0.065Eu3+,xDy3+ (x = 0, 0.001, 0.002, 0.003, 0.004, and 0.005) were synthesized by a one-step hydrothermal method. The details of the synthesis are as follows: (i) NaNO3 (2 mol L−1), Y(NO3)3 (1 mol L−1), Eu(NO3)3 (1 mol L−1), Dy(NO3)3 (1 mol L−1), and NH4F (6 mol L−1) solutions were prepared. (ii) NaNO3, Y(NO3)3, Eu(NO3)3, and Dy(NO3)3 solutions were mixed with a stoichiometric ratio of 1![[thin space (1/6-em)]](https://www.rsc.org/images/entities/char_2009.gif) :
:![[thin space (1/6-em)]](https://www.rsc.org/images/entities/char_2009.gif) (1–0.065−x)
(1–0.065−x)![[thin space (1/6-em)]](https://www.rsc.org/images/entities/char_2009.gif) :
:![[thin space (1/6-em)]](https://www.rsc.org/images/entities/char_2009.gif) 0.065
0.065![[thin space (1/6-em)]](https://www.rsc.org/images/entities/char_2009.gif) :
:![[thin space (1/6-em)]](https://www.rsc.org/images/entities/char_2009.gif) x, corresponding to the ion ratio of Na+
x, corresponding to the ion ratio of Na+![[thin space (1/6-em)]](https://www.rsc.org/images/entities/char_2009.gif) :
:![[thin space (1/6-em)]](https://www.rsc.org/images/entities/char_2009.gif) Y3+: Eu3+
Y3+: Eu3+![[thin space (1/6-em)]](https://www.rsc.org/images/entities/char_2009.gif) :
:![[thin space (1/6-em)]](https://www.rsc.org/images/entities/char_2009.gif) Dy3+ and named solution A. Solution A was stirred for 20 minutes inside Teflon containers. (iii) 10 ml NH4F solution was added into solution A, which produced a white colloidal precursor. The mixture solution containing the precursor was continually stirred for 30 minutes. (iv) After even stirring, the Teflon containers with the mixed solution and precursors produced in step (iii) were inserted into the hydrothermal autoclave and heated to 230 °C. They lasted at this temperature for 72 hours. (v) The final products were washed several times and dried at 120 °C for 2 hours.
Dy3+ and named solution A. Solution A was stirred for 20 minutes inside Teflon containers. (iii) 10 ml NH4F solution was added into solution A, which produced a white colloidal precursor. The mixture solution containing the precursor was continually stirred for 30 minutes. (iv) After even stirring, the Teflon containers with the mixed solution and precursors produced in step (iii) were inserted into the hydrothermal autoclave and heated to 230 °C. They lasted at this temperature for 72 hours. (v) The final products were washed several times and dried at 120 °C for 2 hours.
2.2 Characterization
The crystal structure of all samples was characterized by X-ray powder diffraction (Bruker D8). Refinement of the X-ray data was processed by the GSAS program. The morphology and energy disperse spectrometer of the sample were observed and detected by a scanning electron microscope from Hitachi (SU4800). High resolution transmission electron microscopy (HRTEM) and selected area electron diffraction were implemented by JEM-2100. To characterize the fluorescent performance, measurement of PL and PLE spectra, as well as the decay of the sample were implemented by a Horiba FluoroMax4 spectrophotometer. High temperature PL spectra and decay were measured on the same optical platform. ESCALAB-250+ X-ray photoelectron spectra were employed to analyze the elements and chemical bonds qualitatively. Crystal defects were characterized by electron paramagnetic resonance (EPR, Bruker EMXplus-6/1).2.3 Calculations
The band structure, density of states, and formation energy of the crystal defects were calculated by the VASP program. The PAW-PBE and DFT+U methods were utilized for calculation of the band structure and density of states (DOS). The files VASP needed were prepared by VASPKIT.39 The process for determining the formation energy of defects can be described as the following: (i) geometry optimization of a single cell was implemented. (ii) On the basis of the optimization of a single cell, a supercell with 2 × 2 × 2 was built. (iii) Na and Y ions in a supercell were replaced by Y and Na ions, respectively. (iv) Geometry optimization for the whole system was implemented to find out the minimum energy.3. Results and discussion
3.1 X-ray powder diffraction results
As illustrated in Fig. 1a, compared with the standard PDF card, the X-ray powder diffraction patterns of NaYF4![[thin space (1/6-em)]](https://www.rsc.org/images/entities/char_2009.gif) :
:![[thin space (1/6-em)]](https://www.rsc.org/images/entities/char_2009.gif) 0.065Eu3+,xDy3+ (x = 0, 0.001, 0.002, 0.003, 0.004, and 0.005) are in good agreement with the diffraction peaks of PDF#28-1192 which represent the phase of Na0.57Y0.39Yb0.06ErF4. From the XRD patterns, impurity phases were not detected, which proved the successful synthesis of a high purity single phase of a series of NaYF4
0.065Eu3+,xDy3+ (x = 0, 0.001, 0.002, 0.003, 0.004, and 0.005) are in good agreement with the diffraction peaks of PDF#28-1192 which represent the phase of Na0.57Y0.39Yb0.06ErF4. From the XRD patterns, impurity phases were not detected, which proved the successful synthesis of a high purity single phase of a series of NaYF4![[thin space (1/6-em)]](https://www.rsc.org/images/entities/char_2009.gif) :
:![[thin space (1/6-em)]](https://www.rsc.org/images/entities/char_2009.gif) 0.065Eu3+,xDy3+ samples. As shown in Fig. 1b, compared with the standard PDF card, between a 2 theta value from 92° to 120°, diffraction peaks of all samples present a slight skewing to lower angles due to the larger ion radius of Eu3+ and Dy3+ compared to Yb3+ and Er3+.
0.065Eu3+,xDy3+ samples. As shown in Fig. 1b, compared with the standard PDF card, between a 2 theta value from 92° to 120°, diffraction peaks of all samples present a slight skewing to lower angles due to the larger ion radius of Eu3+ and Dy3+ compared to Yb3+ and Er3+.
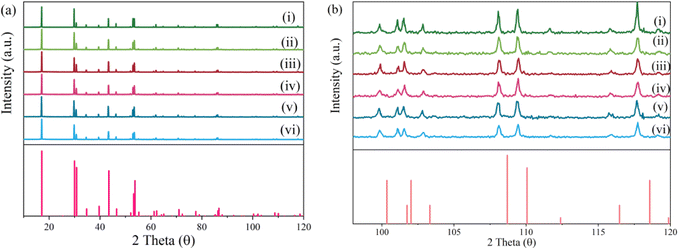 | ||
Fig. 1 X-ray patterns of the samples (i–vi) NaYF4![[thin space (1/6-em)]](https://www.rsc.org/images/entities/char_2009.gif) : :![[thin space (1/6-em)]](https://www.rsc.org/images/entities/char_2009.gif) 0.065Eu3+,xDy3+((i–vi), x = 0.00, 0.001, 0.002, 0.003, 0.004, and 0.005). (a) Full patterns. (b) Local expanded patterns. 0.065Eu3+,xDy3+((i–vi), x = 0.00, 0.001, 0.002, 0.003, 0.004, and 0.005). (a) Full patterns. (b) Local expanded patterns. | ||
3.2 Analysis of crystal morphology and elements
As illustrated in Fig. 2a–d, the morphology of NaYF4![[thin space (1/6-em)]](https://www.rsc.org/images/entities/char_2009.gif) :
:![[thin space (1/6-em)]](https://www.rsc.org/images/entities/char_2009.gif) 0.065Eu3+,0.003Dy3+ was observed by SEM at magnifications of 2.0 K, 3.0 K, 4.0 K, and 5.0 K, respectively. The sample was ground up with an agate mortar before observation. Crystal grains with an even prism shape and a smooth crystal grain surface were obtained. The size of the grains was detected to be 4 × 10 μm. From Fig. 2e–i, EDS mapping graphs of the sample indicate that all the elements Na, Y, F, Eu, Dy were uniformly dispersed in the crystal grains. Elements Eu and Dy were successfully incorporated into the β-NaYF4 substrate.
0.065Eu3+,0.003Dy3+ was observed by SEM at magnifications of 2.0 K, 3.0 K, 4.0 K, and 5.0 K, respectively. The sample was ground up with an agate mortar before observation. Crystal grains with an even prism shape and a smooth crystal grain surface were obtained. The size of the grains was detected to be 4 × 10 μm. From Fig. 2e–i, EDS mapping graphs of the sample indicate that all the elements Na, Y, F, Eu, Dy were uniformly dispersed in the crystal grains. Elements Eu and Dy were successfully incorporated into the β-NaYF4 substrate.
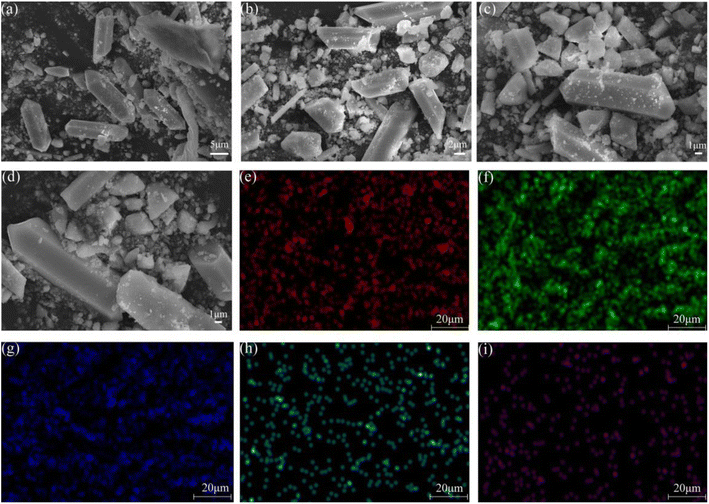 | ||
| Fig. 2 SEM images observed at magnifications of (a) 2.0 K, (b) 3.0 K, (c) 4.0 K, and (d) 5.0 K. EDS mapping of (e) Na, (f) Y, (g) F, (h) Eu, and (i) Dy. | ||
The X-ray photoelectron spectrum of NaYF4![[thin space (1/6-em)]](https://www.rsc.org/images/entities/char_2009.gif) :
:![[thin space (1/6-em)]](https://www.rsc.org/images/entities/char_2009.gif) 0.065Eu3+,0.003Dy3+ is shown in Fig. 3a. Fig. 3b and c illustrate the high-resolution XPS spectra of Na+ and Y3+. Fig. 3e, the high-resolution XPS spectra of Eu3+, presents two different peaks owing to the 5d5/2 energy level. The peak located at a binding energy of 1134.83 eV and 1138.03 eV demonstrated by the fitted result may be ascribed to the splitting of the 5d5/2 energy level. Satellites peaks were present at 1152.56 eV to 1159.60 eV. Finally, the binding energy located at 1164.30 eV and 1164.83 eV can be ascribed to the 3d3/2 energy level. Fig. 3f shows the high-resolution XPS spectra of Dy3+ and its fitted result, the fitted peaks at a binding energy of 1296.62 eV could be attributed to the 3d5/2 energy level, respectively. The XPS results further indicate that the Dy3+ ion was successfully incorporated into the NaYF4 matrix.
0.065Eu3+,0.003Dy3+ is shown in Fig. 3a. Fig. 3b and c illustrate the high-resolution XPS spectra of Na+ and Y3+. Fig. 3e, the high-resolution XPS spectra of Eu3+, presents two different peaks owing to the 5d5/2 energy level. The peak located at a binding energy of 1134.83 eV and 1138.03 eV demonstrated by the fitted result may be ascribed to the splitting of the 5d5/2 energy level. Satellites peaks were present at 1152.56 eV to 1159.60 eV. Finally, the binding energy located at 1164.30 eV and 1164.83 eV can be ascribed to the 3d3/2 energy level. Fig. 3f shows the high-resolution XPS spectra of Dy3+ and its fitted result, the fitted peaks at a binding energy of 1296.62 eV could be attributed to the 3d5/2 energy level, respectively. The XPS results further indicate that the Dy3+ ion was successfully incorporated into the NaYF4 matrix.
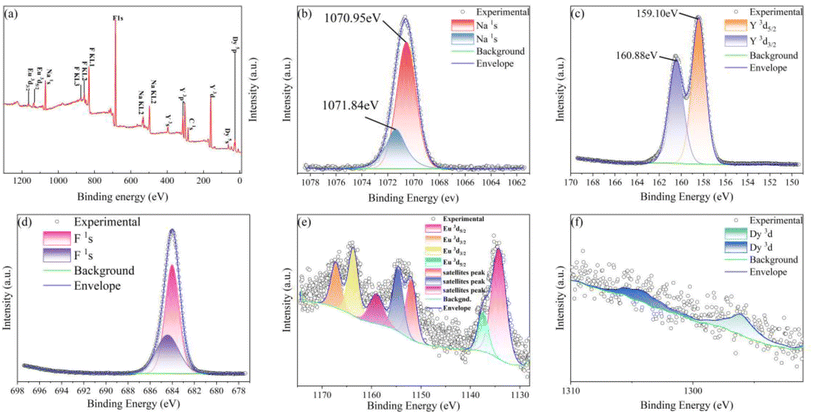 | ||
Fig. 3 (a) XPS survey spectrum of NaYF4![[thin space (1/6-em)]](https://www.rsc.org/images/entities/char_2009.gif) : :![[thin space (1/6-em)]](https://www.rsc.org/images/entities/char_2009.gif) 0.065Eu3+,0.003Dy3+. High resolution spectra of (b) Na, (c) Y, (d) F, (e) Eu, and (f) Dy. 0.065Eu3+,0.003Dy3+. High resolution spectra of (b) Na, (c) Y, (d) F, (e) Eu, and (f) Dy. | ||
3.3 TEM, X-ray refinement, and crystal structure
As demonstrated in Fig. 4a, the TEM graph of the crystal grain is shown. Graphs of HRTEM and SAED were obtained based on Fig. 4a. As illustrated in Fig. 4b, the graph of the HRTEM shows the distance of the crystal face of (100) and (110), corresponding to the crystal face distance of 0.506 Å and 0.279 Å. As illustrated in Fig. 4c, redundant light spots are not observed, indicating the pure phase of β-NaYF4. Results of HRTEM and SAED were in good agreement with the XRD patterns which indicate the purity of phase. The diffraction spots of (100) and (110) were detected and shown in the SAED graph. The results of the HRTEM and SAED also provide reliable information on the X-ray refinement. The χ2, Rwp, Rp, and Rbragg values of the X-ray diffraction refinement are equal to 1.892, 8.50%, 6.27%, and 6.29, respectively, which indicates an extraordinary fitness result and reliable information of the crystal structure. The refinement pattern of XRD is shown in Fig. 4d, which is consistent with the experimental data.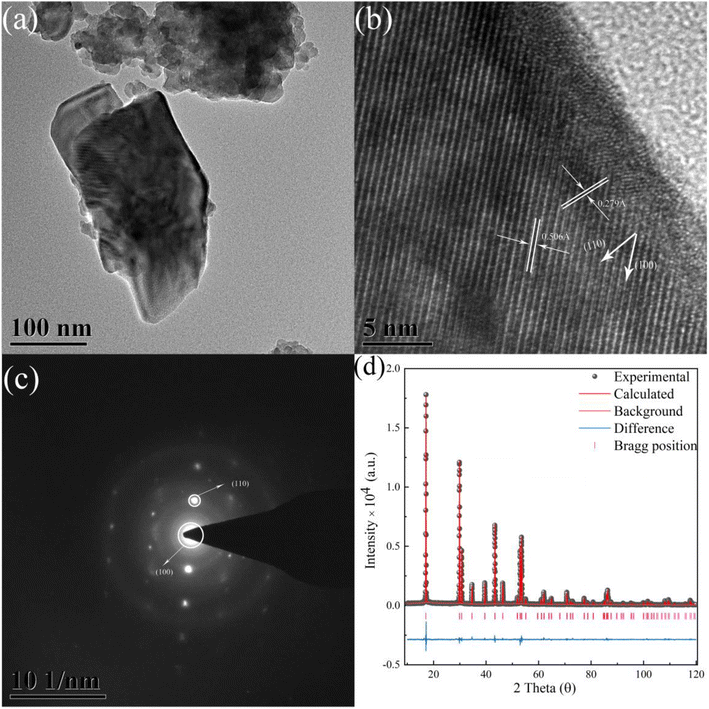 | ||
Fig. 4 (a) The TEM graph of NaYF4![[thin space (1/6-em)]](https://www.rsc.org/images/entities/char_2009.gif) : :![[thin space (1/6-em)]](https://www.rsc.org/images/entities/char_2009.gif) 0.065Eu3+,0.003Dy3+. (b) The HRTEM graph of the sample. (c) The SAED graph of the sample. (d) The X-ray refinement pattern of NaYF4 0.065Eu3+,0.003Dy3+. (b) The HRTEM graph of the sample. (c) The SAED graph of the sample. (d) The X-ray refinement pattern of NaYF4![[thin space (1/6-em)]](https://www.rsc.org/images/entities/char_2009.gif) : :![[thin space (1/6-em)]](https://www.rsc.org/images/entities/char_2009.gif) 0.065Eu3+,0.003Dy3+. 0.065Eu3+,0.003Dy3+. | ||
Combining the X-ray diffraction data and GSAS program, the crystal information of the NaYF4![[thin space (1/6-em)]](https://www.rsc.org/images/entities/char_2009.gif) :
:![[thin space (1/6-em)]](https://www.rsc.org/images/entities/char_2009.gif) 0.065Eu3+,0.003Dy3+ sample was obtained and is listed in Table 1. The result of the refinement indicates that the crystal system and space group of the sample are hexagonal and P63/m (176), respectively. Due to the relatively low Dy3+ concentration, the Dy3+ ion was not taken into consideration due to the few contributions to the XRD pattern. Na and Y atoms exist at two distinct positions in the β-NaYF4
0.065Eu3+,0.003Dy3+ sample was obtained and is listed in Table 1. The result of the refinement indicates that the crystal system and space group of the sample are hexagonal and P63/m (176), respectively. Due to the relatively low Dy3+ concentration, the Dy3+ ion was not taken into consideration due to the few contributions to the XRD pattern. Na and Y atoms exist at two distinct positions in the β-NaYF4![[thin space (1/6-em)]](https://www.rsc.org/images/entities/char_2009.gif) :
:![[thin space (1/6-em)]](https://www.rsc.org/images/entities/char_2009.gif) 0.065Eu3+ structure. In the coordinate value (0.0, 0.0, 0.11413), Na and Y occupy an equivalent position, named Na1 and Y2, respectively. Similarly, at a position for which the coordinate value is (0.6667, 0.3333, 0.25), the Y and Na atoms occupy an equivalent atom position, labelled Y1 and Na2, respectively.
0.065Eu3+ structure. In the coordinate value (0.0, 0.0, 0.11413), Na and Y occupy an equivalent position, named Na1 and Y2, respectively. Similarly, at a position for which the coordinate value is (0.6667, 0.3333, 0.25), the Y and Na atoms occupy an equivalent atom position, labelled Y1 and Na2, respectively.
![[thin space (1/6-em)]](https://www.rsc.org/images/entities/char_2009.gif) :
:![[thin space (1/6-em)]](https://www.rsc.org/images/entities/char_2009.gif) 0.065Eu3+
0.065Eu3+
| Formula sum | β-Na(0.935Y)F4![[thin space (1/6-em)]](https://www.rsc.org/images/entities/char_2009.gif) : :![[thin space (1/6-em)]](https://www.rsc.org/images/entities/char_2009.gif) 0.065Eu3+ 0.065Eu3+ |
||
| Formula weight | 191.9889 | ||
| Crystal system | Hexagonal | ||
| Space group | P63/m (176) | ||
| Cell parameters | a = 5.985309(27) Å | b = 5.984911 Å | c = 3.52072(5) Å |
| Cell volume | 109.212(20) | ||
| Z | 6 | ||
| Atom | x/a | y/b | z/c |
| Na1 | 0.0 | 0.0 | 0.11413(10) |
| Na2 | 0.6667 | 0.3333 | 0.25 |
| Y1 | 0.6667 | 0.3333 | 0.25 |
| Y2 | 0.0 | 0.0 | 0.11413(10) |
| Eu1 | 0.6667 | 0.3333 | 0.25 |
| F1 | 0.3090(4) | 0.2795(4) | 0.25 |
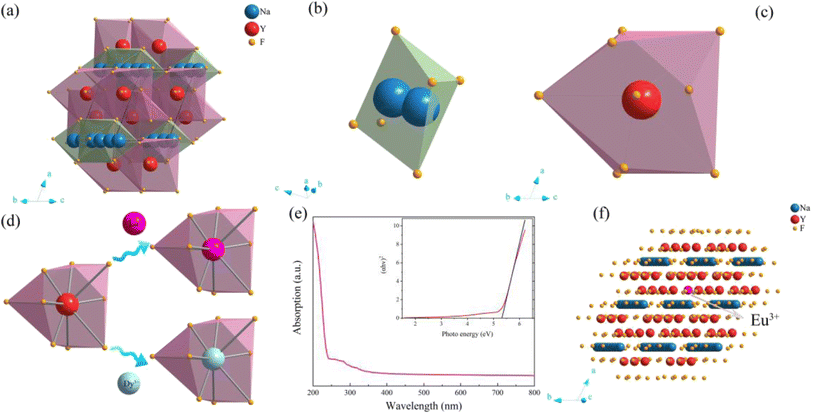
As shown in Fig. 5a–e, the crystal structure of β-NaYF4![[thin space (1/6-em)]](https://www.rsc.org/images/entities/char_2009.gif) :
:![[thin space (1/6-em)]](https://www.rsc.org/images/entities/char_2009.gif) 0.065Eu3+,0.003Dy3+ was portrayed by the Diamon-3 program. Watching the structure from the perspective parallel to the connection line of the vertex of the a and c axis, the integrated crystal structure is constituted of Na–F octahedron and Y–F decahedron. Named [YF8], the Y–F decahedron is composed of a Y atom and nine F atoms, as depicted in Fig. 5b. Consisting of two central Na atoms and six F atoms, the Na–F octahedron is named as [Na2F6], as illustrated in Fig. 5c. Noticeably, the [YF8] decahedrons and [Na2F6] octahedron occupy the centre of the crystal cell and the edge line parallel to the direction of the connected line between a and c axis. Fig. 5d illustrates the process by which Eu3+ and Dy3+ ions replace the Y3+ inside the [YF8] decahedron.
0.065Eu3+,0.003Dy3+ was portrayed by the Diamon-3 program. Watching the structure from the perspective parallel to the connection line of the vertex of the a and c axis, the integrated crystal structure is constituted of Na–F octahedron and Y–F decahedron. Named [YF8], the Y–F decahedron is composed of a Y atom and nine F atoms, as depicted in Fig. 5b. Consisting of two central Na atoms and six F atoms, the Na–F octahedron is named as [Na2F6], as illustrated in Fig. 5c. Noticeably, the [YF8] decahedrons and [Na2F6] octahedron occupy the centre of the crystal cell and the edge line parallel to the direction of the connected line between a and c axis. Fig. 5d illustrates the process by which Eu3+ and Dy3+ ions replace the Y3+ inside the [YF8] decahedron.
To obtain the energy gap of β-NaYF4, ultraviolet absorption spectroscopy was employed. The ultraviolet absorption spectra and photo energy spectra of β-NaYF4 are shown in Fig. 5d. The energy gap is calculated by eqn (1):
| (αhν)n = A(hν − Eg) | (1) |
![[thin space (1/6-em)]](https://www.rsc.org/images/entities/char_2009.gif) :
:![[thin space (1/6-em)]](https://www.rsc.org/images/entities/char_2009.gif) 0.065Eu3+ clearly. The crystal structure of β-NaYF4
0.065Eu3+ clearly. The crystal structure of β-NaYF4![[thin space (1/6-em)]](https://www.rsc.org/images/entities/char_2009.gif) :
:![[thin space (1/6-em)]](https://www.rsc.org/images/entities/char_2009.gif) 0.065Eu3+ is shown in Fig. 5f, which demonstrates the crystal structure after incorporation of Eu3+.
0.065Eu3+ is shown in Fig. 5f, which demonstrates the crystal structure after incorporation of Eu3+.
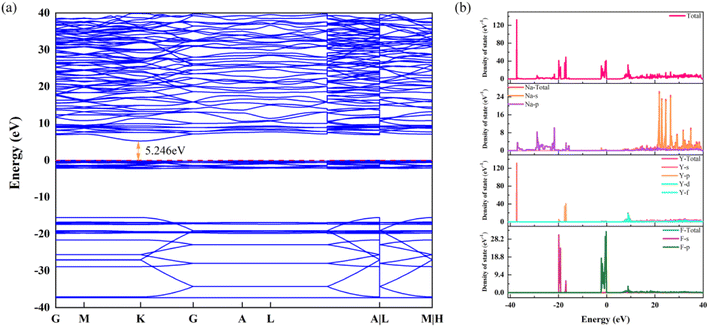
The band structure and density of states are portrayed in Fig. 6a and b, respectively. The band structure shows that the energy gap calculated by the DFT + U algorithm is 5.246 eV, which is slightly lower than the experimental result. According to Fig. 6b, the p-orbital of the Y element makes an enormous contribution for the deep energy level. For the conduction band, the s-orbital of Na is the predominant contributor. Otherwise, the p-orbital of the element Na forms a continued DOS in the range of −15 eV to −37 eV. Finally, the density of states located in the top of the valence band is supplied by the d-orbital of the element Y and the p-orbital of element F. Evidently, the large energy gap provides extraordinary circumstances for incorporation and transition of Eu3+ and Dy3+, according to the results of the band structure and density of states.
3.4 Luminescence properties of β-NaYF4![[thin space (1/6-em)]](https://www.rsc.org/images/entities/h3_char_2009.gif) :
:![[thin space (1/6-em)]](https://www.rsc.org/images/entities/h3_char_2009.gif) 0.065Eu3+,xDy3+
0.065Eu3+,xDy3+
As exhibited in Fig. 7a, the emission spectra of β-NaYF4![[thin space (1/6-em)]](https://www.rsc.org/images/entities/char_2009.gif) :
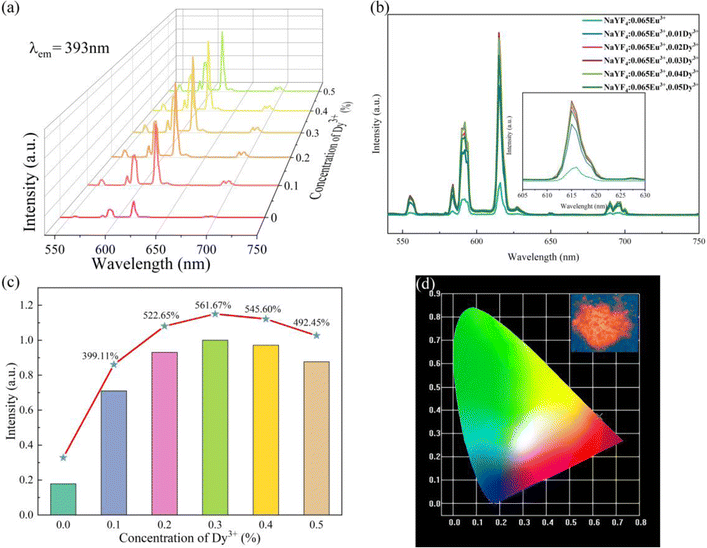
:![[thin space (1/6-em)]](https://www.rsc.org/images/entities/char_2009.gif) 0.065Eu3+,xDy3+ (x = 0.001, 0.002, 0.003, 0.004, and 0.005), all samples present strong red-light emission. Otherwise, a main emission peak emerges at 615 nm, which could be ascribed to the 5D0 → 7F2 transition. At a wavelength of 592 nm, orange-red light emission was detected, which contributed to the 5D0 → 7F2 transition. According to the Judd–Ofelt theory,41,42 the luminous intensity ratio of 5D0 → 7F2 and 5D0 → 7F1 (R = I2/I1) is a vital criterion to confirm the emission mode determined by the magnetic dipole (MD) transition (5D0 → 7F2) or electric dipole (ED) transition (5D0→7F1). When the R value is larger than 1, the emission mode would be determined by the ED transition. On the contrary, if the R value is smaller than 1, the emission mode would be determined by the MD transition. As the Dy3+concentration increases, the R values of a series of β-NaYF4
0.065Eu3+,xDy3+ (x = 0.001, 0.002, 0.003, 0.004, and 0.005), all samples present strong red-light emission. Otherwise, a main emission peak emerges at 615 nm, which could be ascribed to the 5D0 → 7F2 transition. At a wavelength of 592 nm, orange-red light emission was detected, which contributed to the 5D0 → 7F2 transition. According to the Judd–Ofelt theory,41,42 the luminous intensity ratio of 5D0 → 7F2 and 5D0 → 7F1 (R = I2/I1) is a vital criterion to confirm the emission mode determined by the magnetic dipole (MD) transition (5D0 → 7F2) or electric dipole (ED) transition (5D0→7F1). When the R value is larger than 1, the emission mode would be determined by the ED transition. On the contrary, if the R value is smaller than 1, the emission mode would be determined by the MD transition. As the Dy3+concentration increases, the R values of a series of β-NaYF4![[thin space (1/6-em)]](https://www.rsc.org/images/entities/char_2009.gif) :
:![[thin space (1/6-em)]](https://www.rsc.org/images/entities/char_2009.gif) 0.065Eu3+,xDy3+ are 1.997, 1.983, 2.050, 2.049, 1.904, and 2.032, which suggests that the emission mode of all the samples are decided by the electric dipole (ED) transition.
0.065Eu3+,xDy3+ are 1.997, 1.983, 2.050, 2.049, 1.904, and 2.032, which suggests that the emission mode of all the samples are decided by the electric dipole (ED) transition.
As illustrated in Fig. 7a–c, the luminous intensities of a series of NaYF4![[thin space (1/6-em)]](https://www.rsc.org/images/entities/char_2009.gif) :
:![[thin space (1/6-em)]](https://www.rsc.org/images/entities/char_2009.gif) 0.065Eu3+,xDy3+ increase in a range of concentration of Dy3+ from 0 to 0.03, a declining trend of emission intensity emerges when the concentration of Dy3+ exceeds 0.003. The luminous intensities of NaYF4
0.065Eu3+,xDy3+ increase in a range of concentration of Dy3+ from 0 to 0.03, a declining trend of emission intensity emerges when the concentration of Dy3+ exceeds 0.003. The luminous intensities of NaYF4![[thin space (1/6-em)]](https://www.rsc.org/images/entities/char_2009.gif) :
:![[thin space (1/6-em)]](https://www.rsc.org/images/entities/char_2009.gif) 0,065Eu3+,xDy3+ (x = 0.001, 0.002, 0.003, 0.004, and 0.05) are 399.11%, 522.65%, 561.67%, 545.60%, and 492.45% of NaYF4
0,065Eu3+,xDy3+ (x = 0.001, 0.002, 0.003, 0.004, and 0.05) are 399.11%, 522.65%, 561.67%, 545.60%, and 492.45% of NaYF4![[thin space (1/6-em)]](https://www.rsc.org/images/entities/char_2009.gif) :
:![[thin space (1/6-em)]](https://www.rsc.org/images/entities/char_2009.gif) 0,065Eu3+, respectively. The results of the emission spectra indicate that concentration quenching occurs when the concentration of Dy3+ reaches 0.003. The optimal incorporating concentration of Dy3+ is 0.003. To elucidate the mechanism of quenching, eqn (2)43 is utilized:
0,065Eu3+, respectively. The results of the emission spectra indicate that concentration quenching occurs when the concentration of Dy3+ reaches 0.003. The optimal incorporating concentration of Dy3+ is 0.003. To elucidate the mechanism of quenching, eqn (2)43 is utilized:
 | (2) |
![[thin space (1/6-em)]](https://www.rsc.org/images/entities/char_2009.gif) :
:![[thin space (1/6-em)]](https://www.rsc.org/images/entities/char_2009.gif) 0.065Eu3+,0.003Dy3+ shows a brilliant orange-red emitting color under the excitation of a UV-lamp.
0.065Eu3+,0.003Dy3+ shows a brilliant orange-red emitting color under the excitation of a UV-lamp.
The quantum yield (QY) and CIE coordinates of NaYF4![[thin space (1/6-em)]](https://www.rsc.org/images/entities/char_2009.gif) :
:![[thin space (1/6-em)]](https://www.rsc.org/images/entities/char_2009.gif) 0.065Eu3+,xDy3+ are listed in Table 2. The QY increases from 64.65% to 77.49% as the concentration of Dy3+ increases from 0.001 to 0.003. When the concentration of Dy3+ is 0.004 and 0.005, the QYs of those two samples are 73.02% and 71.19%, respectively. As the concentration of the Dy3+ ion increases, the CIE coordinates of x slightly decrease from 0.6272 to 0.6251, while the y value of the CIE coordinates increases from 0.3724 to 0.3744.
0.065Eu3+,xDy3+ are listed in Table 2. The QY increases from 64.65% to 77.49% as the concentration of Dy3+ increases from 0.001 to 0.003. When the concentration of Dy3+ is 0.004 and 0.005, the QYs of those two samples are 73.02% and 71.19%, respectively. As the concentration of the Dy3+ ion increases, the CIE coordinates of x slightly decrease from 0.6272 to 0.6251, while the y value of the CIE coordinates increases from 0.3724 to 0.3744.
![[thin space (1/6-em)]](https://www.rsc.org/images/entities/char_2009.gif) :
:![[thin space (1/6-em)]](https://www.rsc.org/images/entities/char_2009.gif) 0.065Eu3+,xDy3+
0.065Eu3+,xDy3+
| Sample | Quantum yield (%) | CIE coordinate x | CIE coordinate y |
|---|---|---|---|
NaY4![[thin space (1/6-em)]](https://www.rsc.org/images/entities/char_2009.gif) : :![[thin space (1/6-em)]](https://www.rsc.org/images/entities/char_2009.gif) 0.065Eu3+,0.001Dy3+ 0.065Eu3+,0.001Dy3+ |
64.65 | 0.6272 | 0.3724 |
NaY4![[thin space (1/6-em)]](https://www.rsc.org/images/entities/char_2009.gif) : :![[thin space (1/6-em)]](https://www.rsc.org/images/entities/char_2009.gif) 0.065Eu3+,0.002Dy3+ 0.065Eu3+,0.002Dy3+ |
69.53 | 0.6263 | 0.3733 |
NaY4![[thin space (1/6-em)]](https://www.rsc.org/images/entities/char_2009.gif) : :![[thin space (1/6-em)]](https://www.rsc.org/images/entities/char_2009.gif) 0.065Eu3+,0.003Dy3+ 0.065Eu3+,0.003Dy3+ |
77.49 | 0.626 | 0.3736 |
NaY4![[thin space (1/6-em)]](https://www.rsc.org/images/entities/char_2009.gif) : :![[thin space (1/6-em)]](https://www.rsc.org/images/entities/char_2009.gif) 0.065Eu3+,0.004Dy3+ 0.065Eu3+,0.004Dy3+ |
73.02 | 0.6259 | 0.3737 |
NaY4![[thin space (1/6-em)]](https://www.rsc.org/images/entities/char_2009.gif) : :![[thin space (1/6-em)]](https://www.rsc.org/images/entities/char_2009.gif) 0.065Eu3+,0.005Dy3+ 0.065Eu3+,0.005Dy3+ |
71.19 | 0.6251 | 0.3744 |
As demonstrated in Fig. 8a, the decay of all samples was measured at room temperature and fitted by the following equation:44
 | (3) |
| τ = (A1τ12 + A2τ22) / (A1τ1 + A2τ2) | (4) |
![[thin space (1/6-em)]](https://www.rsc.org/images/entities/char_2009.gif) :
:![[thin space (1/6-em)]](https://www.rsc.org/images/entities/char_2009.gif) 0.065Eu3+ were detected and are depicted. The lifetimes of Dy3+incorporated into NaYF4
0.065Eu3+ were detected and are depicted. The lifetimes of Dy3+incorporated into NaYF4![[thin space (1/6-em)]](https://www.rsc.org/images/entities/char_2009.gif) :
:![[thin space (1/6-em)]](https://www.rsc.org/images/entities/char_2009.gif) 0.065Eu3+ are fitted to be 0.89 ms, 0.87 ms, 0.78 ms, 0.77 ms, and 0.72 ms, corresponding to concentrations of Dy3+ of 0.01, 0.02, 0.03, 0.04, and 0.05, respectively. The fitted results of decay demonstrate a linear decrease with the increase in the concentration of Dy3+, suggesting the existence of energy transfer from Dy3+ to the Eu3+ ion. To calculate the efficiency of energy transfer, eqn (5)45 is employed:
0.065Eu3+ are fitted to be 0.89 ms, 0.87 ms, 0.78 ms, 0.77 ms, and 0.72 ms, corresponding to concentrations of Dy3+ of 0.01, 0.02, 0.03, 0.04, and 0.05, respectively. The fitted results of decay demonstrate a linear decrease with the increase in the concentration of Dy3+, suggesting the existence of energy transfer from Dy3+ to the Eu3+ ion. To calculate the efficiency of energy transfer, eqn (5)45 is employed:
 | (5) |
![[thin space (1/6-em)]](https://www.rsc.org/images/entities/char_2009.gif) :
:![[thin space (1/6-em)]](https://www.rsc.org/images/entities/char_2009.gif) 0.065Eu3+,0.005Dy3+ than NaYF4
0.065Eu3+,0.005Dy3+ than NaYF4![[thin space (1/6-em)]](https://www.rsc.org/images/entities/char_2009.gif) :
:![[thin space (1/6-em)]](https://www.rsc.org/images/entities/char_2009.gif) 0.065Eu3+,0.003Dy3+, the luminous intensity of the former is still lower than the latter due to the stronger concentration quenching effect.
0.065Eu3+,0.003Dy3+, the luminous intensity of the former is still lower than the latter due to the stronger concentration quenching effect.
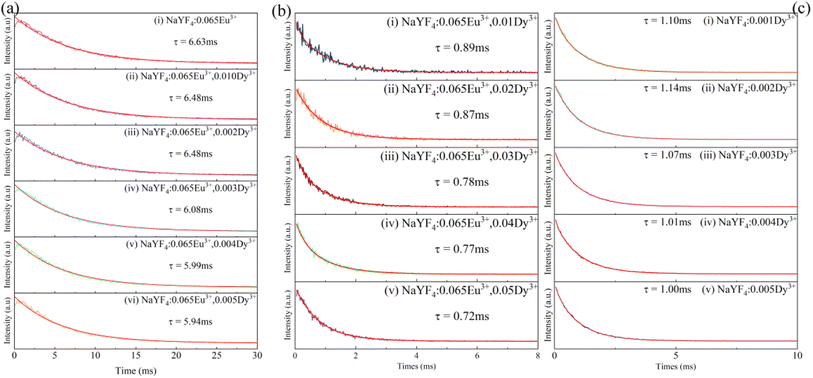 | ||
Fig. 8 (a) Decay of Eu3+ in NaYF4![[thin space (1/6-em)]](https://www.rsc.org/images/entities/char_2009.gif) : :![[thin space (1/6-em)]](https://www.rsc.org/images/entities/char_2009.gif) 0.065Eu3+,xDy3+. (b) Decay of Dy3+ in NaYF4 0.065Eu3+,xDy3+. (b) Decay of Dy3+ in NaYF4![[thin space (1/6-em)]](https://www.rsc.org/images/entities/char_2009.gif) : :![[thin space (1/6-em)]](https://www.rsc.org/images/entities/char_2009.gif) 0.065Eu3+. (c) Decay of Dy3+ in NaYF4. 0.065Eu3+. (c) Decay of Dy3+ in NaYF4. | ||
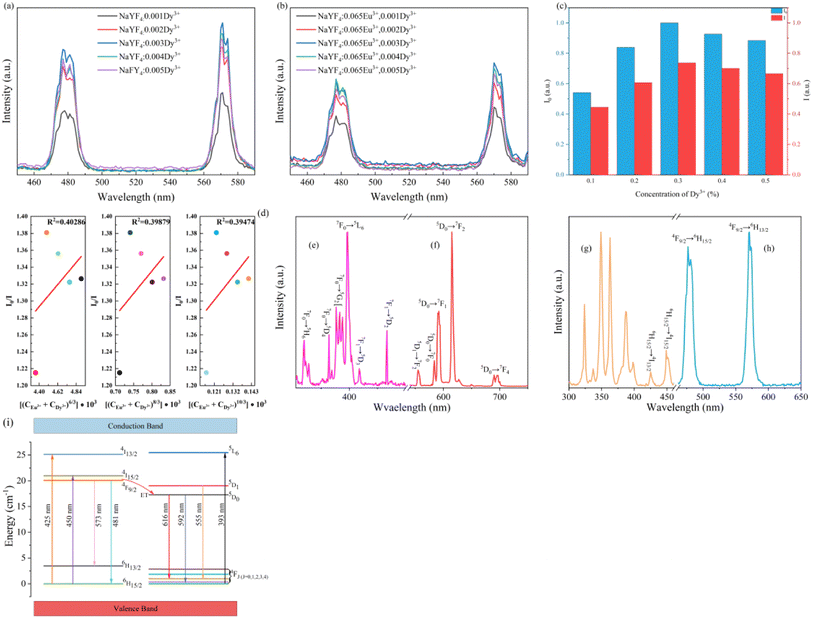
To elucidate the energy transfer mechanism, it is necessary to express the relationship between the luminous intensity and concentration of ions by a suitable method. The following equation45 is utilized:
| I0/I ∝ Cn/3 | (6) |
![[thin space (1/6-em)]](https://www.rsc.org/images/entities/char_2009.gif) :
:![[thin space (1/6-em)]](https://www.rsc.org/images/entities/char_2009.gif) 0.065Eu3+ samples, and the total concentration of Dy3+ and Eu3+, respectively. Otherwise, n can be equal to 6, 8, and 10 which represent the dipole–dipole, the dipole–quadrupole, and the quadrupole–quadrupole interactions.
0.065Eu3+ samples, and the total concentration of Dy3+ and Eu3+, respectively. Otherwise, n can be equal to 6, 8, and 10 which represent the dipole–dipole, the dipole–quadrupole, and the quadrupole–quadrupole interactions.
The luminous intensity of Dy3+ in the absence and presence of Eu3+ was measured by emission spectra presented in Fig. 9a and b to acquire I0 and I. The normalized intensities of I0 and I are compared in Fig. 9c. It is remarkable that the changing trend for luminous intensity of Dy3+ is identical to the intensity of NaYF4![[thin space (1/6-em)]](https://www.rsc.org/images/entities/char_2009.gif) :
:![[thin space (1/6-em)]](https://www.rsc.org/images/entities/char_2009.gif) 0.065Eu3+,xDy3+ excited by 393 nm. According to Fig. 9d that shows the fitted results of I0/I and Cn/3, when the n value is equal to 8, the R2 is the maximum value that equals 0.40286. The fitted result indicates that the energy transfer between Dy3+ and Eu3+ is ascribed to dipole–dipole interactions. Based on Fig. 9e–h, which show the excitation and emission spectra of Eu3+ and Dy3+, the schematic diagram of energy transfer is portrayed in Fig. 9i. Under the excitation of 393 nm, electrons in the ground state of Eu3+ are excited to the excited state (5L6) and transition to 4F1 and 4F2 from 5D0. Otherwise, the electrons in the ground state of Dy3+ are excited to the 4I13/2 and 4I15/2 energy level and transition to 6H13/2 and 6H15/2 from 5F9/2. Due to the higher energy of 5F9/2 compared to 5D0, the electrons will transition from 5F9/2 to the 5D0 energy level, which will lead to energy transfer of Dy3+ to Eu3+.
0.065Eu3+,xDy3+ excited by 393 nm. According to Fig. 9d that shows the fitted results of I0/I and Cn/3, when the n value is equal to 8, the R2 is the maximum value that equals 0.40286. The fitted result indicates that the energy transfer between Dy3+ and Eu3+ is ascribed to dipole–dipole interactions. Based on Fig. 9e–h, which show the excitation and emission spectra of Eu3+ and Dy3+, the schematic diagram of energy transfer is portrayed in Fig. 9i. Under the excitation of 393 nm, electrons in the ground state of Eu3+ are excited to the excited state (5L6) and transition to 4F1 and 4F2 from 5D0. Otherwise, the electrons in the ground state of Dy3+ are excited to the 4I13/2 and 4I15/2 energy level and transition to 6H13/2 and 6H15/2 from 5F9/2. Due to the higher energy of 5F9/2 compared to 5D0, the electrons will transition from 5F9/2 to the 5D0 energy level, which will lead to energy transfer of Dy3+ to Eu3+.
3.5 Thermal luminous properties of NaYF4![[thin space (1/6-em)]](https://www.rsc.org/images/entities/h3_char_2009.gif) :
:![[thin space (1/6-em)]](https://www.rsc.org/images/entities/h3_char_2009.gif) 0.065Eu3+,0.003Dy3+
0.065Eu3+,0.003Dy3+
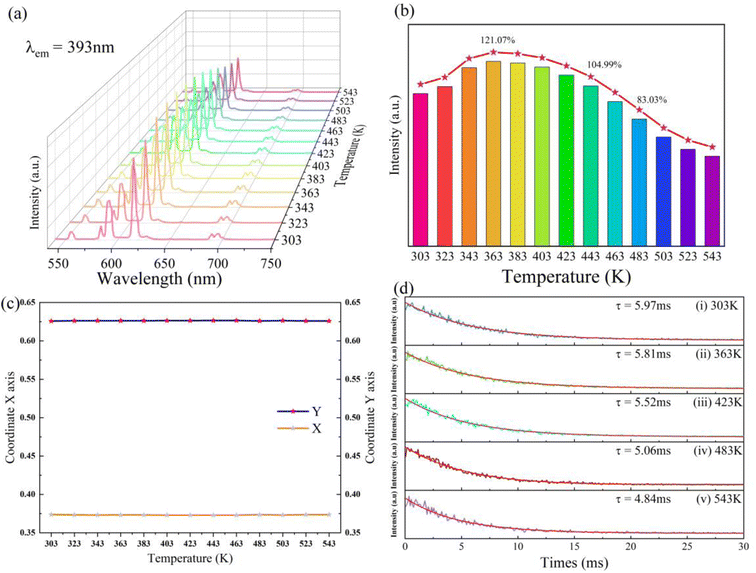
As depicted in Fig. 10a and b, under the excitement wavelength of 393 nm, the emission intensity of the sample demonstrates a linear increase in the temperature range from 303 K to 363 K. The luminous intensity of the sample was determined at 363 K and the optimal temperature for luminous intensity is 121.07% of intensity at 303 K. When the measurement temperature was higher than 363 K, the luminous intensity shows a linear decreasing trend. The luminous intensity measured at 443 K and 483 K remains 104.99% and 83.03% of luminous intensity at 303 K, respectively. There are not any additional emission peaks as measurement temperature increases. The shape of the emission spectra measured at high temperatures is identical to the spectra at room temperature. This result suggests that the sample of NaYF4![[thin space (1/6-em)]](https://www.rsc.org/images/entities/char_2009.gif) :
:![[thin space (1/6-em)]](https://www.rsc.org/images/entities/char_2009.gif) 0.065Eu3+,0.03Dy3+ presents outstanding thermal luminous performance. Based on the emission spectra measured at distinct temperatures, as illustrated in Fig. 10c, the change of CIE coordinate at different measurement temperatures shows a negligible change after 443 K. Before being heated to 443 K, the CIE coordinate in the temperature range from 323 K to 423 K can be considered as invariable, indicating the extraordinary red-light stability presented by the sample.
0.065Eu3+,0.03Dy3+ presents outstanding thermal luminous performance. Based on the emission spectra measured at distinct temperatures, as illustrated in Fig. 10c, the change of CIE coordinate at different measurement temperatures shows a negligible change after 443 K. Before being heated to 443 K, the CIE coordinate in the temperature range from 323 K to 423 K can be considered as invariable, indicating the extraordinary red-light stability presented by the sample.
As portrayed in Fig. 10d, the decay measured at 303 K and 363 K indicates a slight decline from 5.97 ms to 5.81 ms which corresponds to increasing luminous intensity from 303 K to 363 K. A sharp decrease of decay from 5.52 ms to 4.84 ms represents the dwindling process of thermal luminous intensity led by the thermal quenching effect at a temperature range from 423 K to 543 K.
3.6 The zero thermal quenching mechanism of NaYF4![[thin space (1/6-em)]](https://www.rsc.org/images/entities/h3_char_2009.gif) :
:![[thin space (1/6-em)]](https://www.rsc.org/images/entities/h3_char_2009.gif) 0.065Eu3+,0.003Dy3+
0.065Eu3+,0.003Dy3+
The ZTQ performance presented by the sample can be ascribed to the crystal defect, as reported previously.46,47 The source of the crystal defect should be taken into consideration. As illustrated in Fig. 3b and c, the high resolution XPS of Na and Y present two distinct chemical bonds of Na–F and Y–F, respectively. As Fig. 3b presents, two peaks are portrayed at 1070.95 eV and 1071.84 eV, which are close to 1071.4 eV![[thin space (1/6-em)]](https://www.rsc.org/images/entities/char_2009.gif) 48 and 1072.5 eV,49 corresponding to the standard binding energy of Na–F, respectively. As portrayed in Fig. 3c, the Y–F bond presents two kinds of binding energy, corresponding to 158.82 eV and 160.88 eV. Both those values are close to 159.10 eV
48 and 1072.5 eV,49 corresponding to the standard binding energy of Na–F, respectively. As portrayed in Fig. 3c, the Y–F bond presents two kinds of binding energy, corresponding to 158.82 eV and 160.88 eV. Both those values are close to 159.10 eV![[thin space (1/6-em)]](https://www.rsc.org/images/entities/char_2009.gif) 50 and 161.20 eV,51 representing the standard binding energy of YF3. The existence of the distinct chemical bonds of Na–F and Y–F is also confirmed by the crystal information listed in Table 1. The table presents two different occupancies for Na+ and Y3+ ions. Combined with the result of X-ray refinement, nonequivalent replacement between Na+ and Y3+ ions can be confirmed.
50 and 161.20 eV,51 representing the standard binding energy of YF3. The existence of the distinct chemical bonds of Na–F and Y–F is also confirmed by the crystal information listed in Table 1. The table presents two different occupancies for Na+ and Y3+ ions. Combined with the result of X-ray refinement, nonequivalent replacement between Na+ and Y3+ ions can be confirmed.
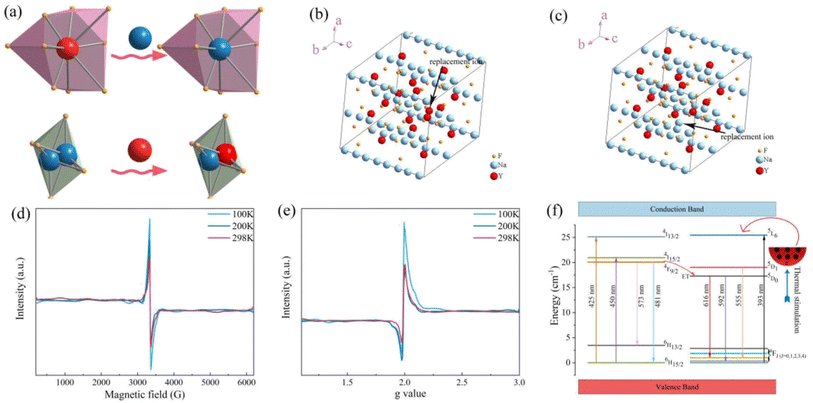
As shown in Fig. 11a, the Y3+ ion replaces the Na+ ion inside the [Na2F6] octahedron, which will produce a negative vacancy named  and a cation vacancy
  . Similarly, the Na+ ion will replace the interior Y3+ ion of the [YF8] decahedrons, as illustrated in Fig. 11a, which would introduce the negative vacancy
  and the cation vacancy
  . Two pairs of vacancies would be produced due to the requirement of electric neutrality for a whole crystal. A nonequivalent replacement process can be inferred and expressed by the following expression:
 | (7) |
 | (8) |
EPR, a well acknowledged method to characterize defects, was utilized for the purpose of characterizing crystal defects. The EPR signal was measured at 100 K, 200 K, and 298 K, as shown in Fig. 11b, manifesting a single kind of signal. The intensity of the signal decreases from 100 K to 298 K. Comparing the signal at 298 K with 200 K, the intensity of the signal shows a slight decline. The EPR signal was converted to a g value, which is a critical parameter for crystal defects, according to the following equation:52
 | (9) |
In this equation, the ν refers to the measurement frequency. B0 represents the intensity of the magnetic field. As illustrated in Fig. 11c, the g value was calculated to be 1.9882, 1.9883, and 1.9878 at 100 K, 200 K, and 298 K, respectively. The calculated results clearly show the stable existence of crystal defects at room temperature. Furthermore, the sample keeps a stable g value at a distinct measurement temperature. Typical g values for the element Eu are 0.6134 and 1.3887, corresponding to 153Eu and 151Eu.53 Similarly, representative g values for element Dy are 0.5122 and 0.7177, corresponding to 161Dy and 163Dy,53 respectively. Those four values are far away from the calculated g values according to EPR, which suggests that the EPR signal does not stem from the unpaired electrons of elements Eu and Dy. It is confirmed that the crystal defect leads to the signal detected by EPR.
To further confirm the type of crystal defect, VASP was employed to calculated the formation energy of a defect. Eqn (10)54 is necessary for the calculation:
 | (10) |
Table 3, listing all the values of formation energy, suggests that the formation energy of  (−1310.7589 eV) and
  (−1267.5217 eV) is much higher than
  (−43.2101 eV) and
  (18.2062 eV). The DFT calculation results demonstrate that the formation of
  and
and  vacancies will occur due to the requirement for electrons to balance, rather and
  and
and  . Furthermore,
  and
and  will be hard to produce due to the high formation energy, despite the nonequivalent replacement between Na+ and Y3+ located in the [YF8] decahedron.
On the other hand, the crystal defect plays the vital role of the electron trap.55,56 Based on this property, unpaired electrons induced by nonequivalent replacement are captured by the electron trap to maintain the electric neutrality of the whole system. Combining the EPR spectra,  and
and  vacancies show a single signal in Fig. 11a and b, due to the identical chemistry environment of the two types of vacancies. The expression expressing the formation of crystal defect should be modified as the following:
 | (11) |
Based on the analysis of EPR and DFT calculations,  and
and  vacancies, treated as electronic traps, make a predominant contribution to the zero thermal quenching performance of NaYF4
![[thin space (1/6-em)]](https://www.rsc.org/images/entities/char_2009.gif) :
:![[thin space (1/6-em)]](https://www.rsc.org/images/entities/char_2009.gif) 0.065Eu3+,0.003Dy3+. As illustrated in Fig. 11f, with an increase of temperature, under thermal stimulation, electrons caught in electronic traps will be excited to the 5L6 energy level and transition to 4FJ (J = 0, 1, 2, 3, 4) level, to compensate for the loss of luminous intensity induced by thermal quenching. In the temperature range of 303 K to 363 K, the luminous intensity increases linearly due to the increasing number of excited electrons stored in electronic traps, corresponding to the stage of increasing luminous intensity. This process is presented by the lifetimes measured at 303 K and 363 K. Comparing the decay times of 363 K with 303 K, the lifetimes decrease by 2.68%, while the decay at 423 K, 483 K, and 543 K declines by 7.82%, 14.572%, and 18.972%, respectively. The change of decay time shows the evident compensation effect induced by electrons in defects at 303 K to 363 K. After heating to 386 K, the luminous intensity begins to decline due to the decreasing number of excited electrons in electronic traps. Noticeably, the thermal luminous intensities remain 104.99% and 83.03% at 443 K and 483 K, respectively. The NaYF4
0.065Eu3+,0.003Dy3+. As illustrated in Fig. 11f, with an increase of temperature, under thermal stimulation, electrons caught in electronic traps will be excited to the 5L6 energy level and transition to 4FJ (J = 0, 1, 2, 3, 4) level, to compensate for the loss of luminous intensity induced by thermal quenching. In the temperature range of 303 K to 363 K, the luminous intensity increases linearly due to the increasing number of excited electrons stored in electronic traps, corresponding to the stage of increasing luminous intensity. This process is presented by the lifetimes measured at 303 K and 363 K. Comparing the decay times of 363 K with 303 K, the lifetimes decrease by 2.68%, while the decay at 423 K, 483 K, and 543 K declines by 7.82%, 14.572%, and 18.972%, respectively. The change of decay time shows the evident compensation effect induced by electrons in defects at 303 K to 363 K. After heating to 386 K, the luminous intensity begins to decline due to the decreasing number of excited electrons in electronic traps. Noticeably, the thermal luminous intensities remain 104.99% and 83.03% at 443 K and 483 K, respectively. The NaYF4![[thin space (1/6-em)]](https://www.rsc.org/images/entities/char_2009.gif) :
:![[thin space (1/6-em)]](https://www.rsc.org/images/entities/char_2009.gif) 0.065Eu3+,0.003Dy3+ red-light phosphor demonstrates extraordinary thermal luminous properties.
0.065Eu3+,0.003Dy3+ red-light phosphor demonstrates extraordinary thermal luminous properties.
3.7 Fabrication of the prototype red light LED
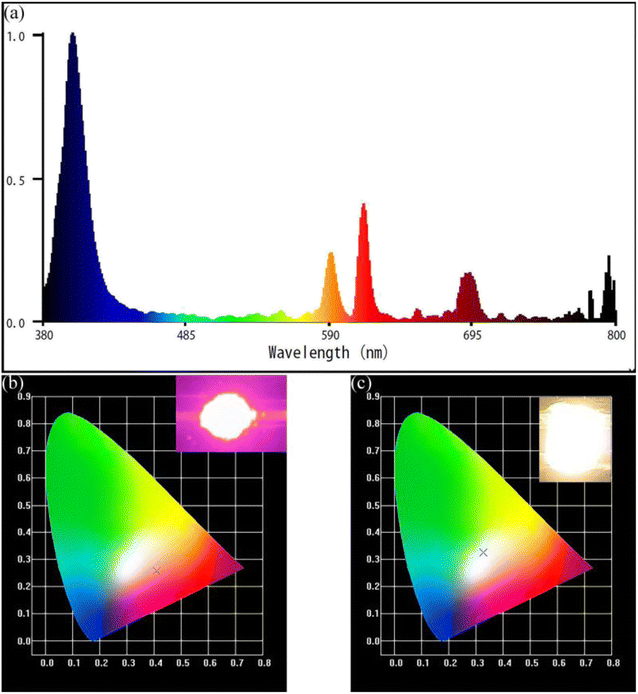
As shown in Fig. 12a, the prototype red LED was fabricated by coating the NaYF4![[thin space (1/6-em)]](https://www.rsc.org/images/entities/char_2009.gif) :
:![[thin space (1/6-em)]](https://www.rsc.org/images/entities/char_2009.gif) 0.065Eu3+,0.003Dy3+ phosphor onto the surface of the 395 nm UV-chip. The red light ratio reached 35.4% under the 9 mA driving current, indicating the extraordinary red-light performance of the NaYF4
0.065Eu3+,0.003Dy3+ phosphor onto the surface of the 395 nm UV-chip. The red light ratio reached 35.4% under the 9 mA driving current, indicating the extraordinary red-light performance of the NaYF4![[thin space (1/6-em)]](https://www.rsc.org/images/entities/char_2009.gif) :
:![[thin space (1/6-em)]](https://www.rsc.org/images/entities/char_2009.gif) 0.065Eu3+,0.003Dy3+ red-light phosphor. A white light emitting diode was fabricated by combining the YAG
0.065Eu3+,0.003Dy3+ red-light phosphor. A white light emitting diode was fabricated by combining the YAG![[thin space (1/6-em)]](https://www.rsc.org/images/entities/char_2009.gif) :
:![[thin space (1/6-em)]](https://www.rsc.org/images/entities/char_2009.gif) Ce3+ yellow phosphor with the NaYF4
Ce3+ yellow phosphor with the NaYF4![[thin space (1/6-em)]](https://www.rsc.org/images/entities/char_2009.gif) :
:![[thin space (1/6-em)]](https://www.rsc.org/images/entities/char_2009.gif) 0.065Eu3+,0.003Dy3+ phosphor and 395 nm UV chip. Under a current of 9 mA, the correlated color temperature and color-rendering index of this fabricated WLED are 5698 K and 82.2, respectively. The CIE coordinate of the fabricated WLED is (x, y) = (0.3284, 0.3243), which is the white light area. The result shows that NaYF4
0.065Eu3+,0.003Dy3+ phosphor and 395 nm UV chip. Under a current of 9 mA, the correlated color temperature and color-rendering index of this fabricated WLED are 5698 K and 82.2, respectively. The CIE coordinate of the fabricated WLED is (x, y) = (0.3284, 0.3243), which is the white light area. The result shows that NaYF4![[thin space (1/6-em)]](https://www.rsc.org/images/entities/char_2009.gif) :
:![[thin space (1/6-em)]](https://www.rsc.org/images/entities/char_2009.gif) 0.065Eu3+,0.003Dy3+ has outstanding thermal stability and the red-light source is an extraordinary candidate for WLEDs. Fig. 12b shows the color region of the prototype LED in the CIE chromaticity diagram, unveiling a close color area to white light. This result provides powerful proof that the NaYF4
0.065Eu3+,0.003Dy3+ has outstanding thermal stability and the red-light source is an extraordinary candidate for WLEDs. Fig. 12b shows the color region of the prototype LED in the CIE chromaticity diagram, unveiling a close color area to white light. This result provides powerful proof that the NaYF4![[thin space (1/6-em)]](https://www.rsc.org/images/entities/char_2009.gif) :
:![[thin space (1/6-em)]](https://www.rsc.org/images/entities/char_2009.gif) 0.065Eu3+,0.003Dy3+ phosphor is an ideal red-light component for WLEDs.
0.065Eu3+,0.003Dy3+ phosphor is an ideal red-light component for WLEDs.
4. Conclusions
A series of NaYF4![[thin space (1/6-em)]](https://www.rsc.org/images/entities/char_2009.gif) :
:![[thin space (1/6-em)]](https://www.rsc.org/images/entities/char_2009.gif) 0.065Eu3+,xDy3+ (x = 0.001, 0.002, 0.003, 0.004, 0.005) red-light phosphors were synthesized by a one-step hydrothermal method. The energy transfer effect was determined to be due to dipole–quadrupole interactions. With the increasing concentration of Dy3+, the luminous intensity of β-NaYF4
0.065Eu3+,xDy3+ (x = 0.001, 0.002, 0.003, 0.004, 0.005) red-light phosphors were synthesized by a one-step hydrothermal method. The energy transfer effect was determined to be due to dipole–quadrupole interactions. With the increasing concentration of Dy3+, the luminous intensity of β-NaYF4![[thin space (1/6-em)]](https://www.rsc.org/images/entities/char_2009.gif) :
:![[thin space (1/6-em)]](https://www.rsc.org/images/entities/char_2009.gif) 0.065Eu3+,xDy3+ is 399.11%, 522.65%, 561.67%, 545.60%, and 492.45% of NaYF4
0.065Eu3+,xDy3+ is 399.11%, 522.65%, 561.67%, 545.60%, and 492.45% of NaYF4![[thin space (1/6-em)]](https://www.rsc.org/images/entities/char_2009.gif) :
:![[thin space (1/6-em)]](https://www.rsc.org/images/entities/char_2009.gif) 0,065Eu3+, respectively. The zero thermal quenching property of the NaYF4
0,065Eu3+, respectively. The zero thermal quenching property of the NaYF4![[thin space (1/6-em)]](https://www.rsc.org/images/entities/char_2009.gif) :
:![[thin space (1/6-em)]](https://www.rsc.org/images/entities/char_2009.gif) 0.065Eu3+,0.003Dy3+ phosphor can be ascribed to the thermal stimulation of electrons stored in the crystal defect which is treated as an electronic trap. DFT calculations were employed to elucidate that
0.065Eu3+,0.003Dy3+ phosphor can be ascribed to the thermal stimulation of electrons stored in the crystal defect which is treated as an electronic trap. DFT calculations were employed to elucidate that  and
and  vacancies are predominant in the crystal and lead to the zero thermal quenching property. The formation energy of the
  and
and  vacancies was calculated to be −43.2101 eV and 18.2062 eV, respectively.
Conflicts of interest
The authors declare that they have no known competing financial interests or personal relationships that could have appeared to influence the work reported in this paper.Acknowledgements
This research is supported by the National Natural Science Foundation of China (Grant No. 21661006 and No. 21965004), the Natural Science Foundation of Guangxi Zhuang Autonomous Region, China (Grant No. 2019GXNSFDA245022, No. 2020GXNSFAA159036), the Scientific Research Foundation of Guangxi University (Grant No. XDZ140116), the innovation Project of Guangxi Graduate Education (Grant No. YCSW2020015), and the Students Experimental Skills and Innovation Ability Training Fund Project of Guangxi University (No. S202210593143). The calculation part was supported by the high performance calculation center of Guangxi University.References
- S. Liang, P. Dang, G. Li, M. S. Molokeev, Y. Wei, Y. Wei, H. Lian, M. Shang, A. A. Al Kheraif and J. Lin, J. Mater. Chem. C, 2018, 6, 6714–6725 RSC.
- S. Pimputkar, J. S. Speck, S. P. DenBaars and S. Nakamura, Nat. Photonics, 2009, 3, 180–182 CrossRef CAS.
- E. F. Schubert and J. K. Kim, Science, 2005, 308, 1274–1278 CrossRef CAS PubMed.
- P. M. Pattison, J. Y. Tsao, G. C. Brainard and B. Bugbee, Nature, 2018, 563, 493–500 CrossRef CAS PubMed.
- R. J. Bula, R. C. Morrow, T. W. Tibbitts, D. J. Barta, R. W. Ignatius and T. S. Martin, HortScience, 1991, 26, 203–205 CAS.
- C. Kubota, T. Eguchi and M. Kroggel, Sci. Hortic., 2017, 226, 366–371 CrossRef CAS.
- S. A. Rahman, M. A. St Hilaire and S. W. Lockley, Physiol. Behav., 2017, 177, 221–229 CrossRef CAS PubMed.
- J. Chang, D.-s. Yang, Z.-h. Sun, Z.-c. Weng, H.-l. Jiang and T. Ren, Chin. J. Lumin., 2008, 29, 195–199 Search PubMed.
- J. W. Liu, G. Wang, L. Ma, K. L. Zhang, L. L. Zhang, Q. J. Wang and L. F. Wan, East China Normal University, Shanghai, Peoples R China, 2007.
- Z. Xia and Q. Liu, Prog. Mater. Sci., 2016, 84, 59–117 CrossRef CAS.
- Z. Zhang, C. Ma, R. Gautier, M. S. Molokeev, Q. Liu and Z. Xia, Adv. Funct. Mater., 2018, 28, 1804150 CrossRef.
- H. Liu, Y. Luo, Z. Mao, L. Liao and Z. Xia, J. Mater. Chem. C, 2014, 2, 1619–1627 RSC.
- W. Lu, M. Jiao, B. Shao, L. Zhao and H. You, Inorg. Chem., 2015, 54, 9060–9065 CrossRef CAS PubMed.
- L. Chen, C.-C. Lin, C.-W. Yeh and R.-S. Liu, Materials, 2010, 3, 2172–2195 CrossRef CAS.
- C. C. Lin and R. S. Liu, J. Phys. Chem. Lett., 2011, 2, 1268–1277 CrossRef CAS PubMed.
- J. Ueda, P. Dorenbos, A. J. J. Bos, A. Meijerink and S. Tanabe, J. Phys. Chem. C, 2015, 119, 25003–25008 CrossRef CAS.
- P. Pust, V. Weiler, C. Hecht, A. Tucks, A. S. Wochnik, A. K. Henss, D. Wiechert, C. Scheu, P. J. Schmidt and W. Schnick, Nat. Mater., 2014, 13, 891–896 CrossRef CAS PubMed.
- Q. Wei, J. Ding and Y. Wang, Chem. Eng. J., 2020, 386, 124004 CrossRef CAS.
- K. Binnemans, Coord. Chem. Rev., 2015, 295, 1–45 CrossRef CAS.
- H. Peng, H. Song, B. Chen, J. Wang, S. Lu, X. Kong and J. Zhang, J. Chem. Phys., 2003, 118, 3277–3282 CrossRef CAS.
- Y. Zhou, Z. Song, Y. Li, Q. Liu, Z. Xu, R. Hu, X. Zhang, J. Qiu and Z. Yang, J. Rare Earths, 2016, 34, 1188–1192 CrossRef CAS.
- H. Zhu, C. C. Lin, W. Luo, S. Shu, Z. Liu, Y. Liu, J. Kong, E. Ma, Y. Cao, R. S. Liu and X. Chen, Nat. Commun., 2014, 5, 4312 CrossRef CAS PubMed.
- F. Tang, Z. Su, H. Ye, W. Gao, X. Pan and S. Xu, ACS Omega, 2018, 3, 13704–13710 CrossRef CAS PubMed.
- H.-X. Mai, Y.-W. Zhang, R. Si, Z.-G. Yan, L.-D. Sun, L.-P. You and C.-H. Yan, J. Am. Chem. Soc., 2006, 128, 6426–6436 CrossRef CAS PubMed.
- J. W. Stouwdam and F. van Veggel, Nano Lett., 2002, 2, 733–737 CrossRef CAS.
- F. Vetrone, V. Mahalingam and J. A. Capobianco, Chem. Mater., 2009, 21, 1847–1851 CrossRef CAS.
- L. Mao, Z. Lu, N. He, L. Zhang, Y. Deng and D. Duan, Sci. China: Chem., 2016, 60, 157–162 CrossRef.
- B. Dong, H. W. Song, H. Q. Yu, H. Zhang, R. F. Qin, X. Bai, G. H. Pan, S. Z. Lu, F. Wang, L. B. Fan and Q. L. Dai, J. Phys. Chem. C, 2008, 112, 1435–1440 CrossRef CAS.
- H. X. Mai, Y. W. Zhang, R. Si, Z. G. Yan, L. D. Sun, L. P. You and C. H. Yan, J. Am. Chem. Soc., 2006, 128, 6426–6436 CrossRef CAS PubMed.
- G. S. Yi, H. C. Lu, S. Y. Zhao, G. Yue, W. J. Yang, D. P. Chen and L. H. Guo, Nano Lett., 2004, 4, 2191–2196 CrossRef CAS.
- M. Calil Júnior, Á. Melo, E. Rodrigues, F. Sigoli and M. Rodrigues, J. Braz. Chem. Soc., 2017, 28, 1816–1821 Search PubMed.
- X. P. Chen, Q. Y. Zhang, C. H. Yang, D. D. Chen and C. Zhao, Spectrochim. Acta, Part A, 2009, 74, 441–445 CrossRef CAS PubMed.
- Y. Luo, R. Yang, X. Zhang, B. Hu, S. Hu, L. Zhou and J. Yang, CrystEngComm, 2015, 17, 7762–7771 RSC.
- X. Zhang, H. Zou, C. Xu, Z. An, R. Dong, K. Zheng, Y. Sheng and Y. Song, Opt. Mater., 2019, 89, 512–520 CrossRef CAS.
- A. R. Kadam and S. J. Dhoble, J. Alloys Compd., 2021, 884, 161138 CrossRef CAS.
- Z. Wang, L. Cheng, H. Tang, X. Yu, J. Xie, X. Mi, Q. Liu and X. Zhang, J. Solid State Chem., 2021, 301, 122295 CrossRef CAS.
- Q. Han, A. Hao, W. Gao, J. Qi, Y. Wang and J. Dong, Ceram. Int., 2020, 46, 11132–11136 CrossRef CAS.
- X. Wang, S. Zhao, Y. Zhang and G. Sheng, J. Rare Earths, 2010, 28, 222–224 CrossRef.
- V. Wang, N. Xu, J.-C. Liu, G. Tang and W.-T. Geng, Comput. Phys. Commun., 2021, 267, 108033 CrossRef CAS.
- M. G. Brik, A. M. Srivastava and A. I. Popov, Opt. Mater., 2022, 127, 112276 CrossRef CAS.
- B. R. Judd, Phys. Rev., 1962, 127, 750–761 CrossRef CAS.
- G. S. Ofelt, J. Chem. Phys., 1962, 37, 511–520 CrossRef CAS.
- Y. Sato, H. Kato, M. Kobayashi, T. Masaki, D. H. Yoon and M. Kakihana, Angew. Chem., Int. Ed. Engl., 2014, 53, 7756–7759 CrossRef CAS PubMed.
- K. Li, J. Fan, M. Shang, H. Lian and J. Lin, J. Mater. Chem. C, 2015, 3, 9989–9998 RSC.
- C. Cao, H. K. Yang, J. W. Chung, B. K. Moon, B. C. Choi, J. H. Jeong and K. H. Kim, J. Mater. Chem., 2011, 21, 10342–10347 RSC.
- J. Tian and W. Zhuang, Inorg. Chem. Front., 2021, 8, 4933–4954 RSC.
- X. Wang, Z. Zhao, Q. Wu, C. Wang, Q. Wang, L. Yanyan and Y. Wang, J. Mater. Chem. C, 2016, 4, 8795–8801 RSC.
- V. I. Nefedov, Y. V. Salyn, G. Leonhardt and R. Scheibe, J. Electron Spectrosc. Relat. Phenom., 1977, 10, 121–124 CrossRef CAS.
- H. Seyama, J. Chem. Soc., Faraday Trans. 1, 1985, 81, 485–495 RSC.
- R. P. Vasquez, M. C. Foote and B. D. Hunt, J. Appl. Phys., 1989, 66, 4866–4877 CrossRef CAS.
- U. Yoshinori, T. Akira, I. Toshio and Y. Hideo, Bull. Chem. Soc. Jpn., 1986, 59, 2263–2267 CrossRef.
- K. Ye, K. Li, Y. Lu, Z. Guo, N. Ni, H. Liu, Y. Huang, H. Ji and P. Wang, TrAC, Trends Anal. Chem., 2019, 116, 102–108 CrossRef CAS.
- J. R. B. J. A. Weil, Electron Paramagnetic Resonance: Elementary Theory Electron and Practical applications, John Wiley & Sons, Hoboken, 2nd edn, 2007 Search PubMed.
- L. Jia, M. Gu, G. Song and J. Zhu, Opt. Mater., 2019, 93, 15–18 CrossRef CAS.
- S. Fang, T. Lang, T. Han, J. Wang, J. Yang, S. Cao, L. Peng, B. Liu, A. N. Yakovlev and V. I. Korepanov, Chem. Eng. J., 2020, 389, 124297 CrossRef CAS.
- G. Zhu, Z. Li, C. Wang, X. Wang, F. Zhou, M. Gao, S. Xin and Y. Wang, Dalton Trans., 2019, 48, 1624–1632 RSC.
Footnote |
| † Electronic supplementary information (ESI) available. See DOI: https://doi.org/10.1039/d2ra05674g |
| This journal is © The Royal Society of Chemistry 2022 |

