 Open Access Article
New amino acid propyl ester ibuprofenates from synthesis to use in drug delivery systems†
Paula Ossowicz-Rupniewska *a,
Kaja Szczepkowskaa,
Paulina Bednarczyka,
Małgorzata Nowaka,
Anna Nowakb,
Wiktoria Duchnikb,
Łukasz Kucharskib,
Łukasz Strukc,
Adam Klimowicz
 b and
Zbigniew Czech
 a
a
aDepartment of Chemical Organic Technology and Polymeric Materials, Faculty of Chemical Technology and Engineering, West Pomeranian University of Technology, Piastów Ave. 42, Szczecin 71-065, Poland. E-mail: possowicz@zut.edu.pl
bDepartment of Cosmetic and Pharmaceutical Chemistry, Pomeranian Medical University in Szczecin, Powstańców Wielkopolskich Ave. 72, Szczecin 70-111, Poland
cDepartment of Organic and Physical Chemistry, Faculty of Chemical Technology and Engineering, West Pomeranian University of Technology, Piastów Ave. 42, Szczecin 71-065, Poland
First published on 14th December 2022
Abstract
This study aimed to evaluate the effect of introducing structural modification of ibuprofen in the form of an ion pair on the permeability of ibuprofen through the skin and the properties of the adhesive layer of the medical patch produced. The active substances tested were the salts of ibuprofen obtained by pairing the anion of ibuprofen with organic cations such as propyl esters of amino acids such as tyrosine, tryptophan, histidine, or phenylalanine. For comparison, the penetration of unmodified ibuprofen and commercially available patches was also tested. Acrylate copolymers based on isobornyl methacrylate as a biocomponent and a monomer increasing the Tg (“hard”) were used to produce the adhesive layer of transdermal patches. The obtained patches were characterized in terms of adhesive properties and tested for the permeability of the active ingredient and the permeability of the active ingredient through the skin. This study demonstrates the possibility of developing acrylic-based photoreactive transdermal patches that contain biocomponents that can deliver a therapeutically appropriate dose of ibuprofen.
Introduction
According to the International Association for the Study of Pain (IASP), pain is a subjectively unpleasant and negative sensory and emotional impression arising from (so-called nociceptive) stimuli that damage or threaten the tissue. Pain is a subjective feeling, so whatever the patient calls it, regardless of its objective symptoms.1–4 Pain is a serious health problem, even a disease. Therefore, pain management is extremely important from the point of view of the patient's comfort of life and health. Pain treatment is carried out according to the analgesic ladder, i.e., using painkillers and other pharmaceuticals to reduce the patient's pain sensations. This scheme distinguishes three levels of interactivity of treatment, depending on the level of pain perception.5 Non-steroidal anti-inflammatory drugs are at the root of the analgetic ladder and are used alongside paracetamol as the first choice for pain management. They are mainly used for mild pain relief (1–4 on the numerical scale-NRS).5,6Various routes of drug administration are used to treat pain, including drug delivery through the skin. Topical and transdermal application of drugs is one of the most important methods of delivering them to the body.7 It is known that the transdermal administration of a drug to induce a systemic effect has several significant advantages and, in many situations, is an advantage over the administration of oral or intravenous drugs. Among the many advantages of transdermal administration of the drug, the possibility of avoiding the first-pass effect (hepatic metabolism) and the elimination of side effects of the drug on the gastrointestinal tract deserves special attention. In addition, attention should be paid to the elimination of the possible decomposition of the active substance in the gastrointestinal tract as well as the exclusion of the possibility of drug interactions with food and other orally administered drugs. Furthermore, the use of this route of administration allows for obtaining the desired therapeutic effect after the absorption of lower doses. The appropriate modification with increased permeability through biological membranes can significantly reduce these doses. In this case, the drug substance's absorption rate depends on its release rate, a property that can be appropriately controlled depending on the desired effect. In addition, administration through the skin reduces the frequency of drug application with a short biological half-life, which is especially important in treating chronic diseases.7–9
For this route of drug administration, a very important factor in limiting penetration is the skin barrier which reduces the penetration efficiency and limits the absorption of the compounds. This layer is the greatest obstacle to the transport of active substances and is considered the primary barrier to the permeation of molecules. It is mainly composed of lipid substances such as ceramides, cholesterol, fatty acids, cholesterol esters, and small amounts of phospholipids.10 Among the available and topically applied drugs, a significantly small group can passively cross the skin barrier in amounts sufficient to obtain a therapeutic effect.11 This route of administration is used to reduce unwanted side effects, avoid first-pass metabolism in the liver, and minimize gastrointestinal side effects.12 However, due to the poor penetration capacity through the stratum corneum, it is difficult to obtain its effective concentration.13
One of the most popular painkillers is ibuprofen, which is used in various pharmaceutical formulations, including those administered through the skin.14 However, ibuprofen is characterized by relatively low solubility in water, especially in an acidic environment. The consequence of this property is the relatively slow pharmacological action of ibuprofen.15–19 In addition, ibuprofen has a very low skin permeability. Therefore, research is currently being conducted to obtain its derivatives with similar pharmaceutical activity, with increased solubility and permeability through the skin, and thus – substances with a faster therapeutic effect. In order to increase the solubility of ibuprofen and its bioavailability, various types of structural modifications of the compound are used. The first and most basic modification of ibuprofen is to convert the compound into a salt form. The mechanism of this modification is relatively simple – it consists in replacing an acid proton with a salt cation. Ibuprofen salts can be of organic and inorganic origin, for example, sodium, potassium, calcium, diethylamine, tris(hydroxymethyl)aminomethane, and tetraethylammonium.20–26 Many strategies for modifying ibuprofen, such as modifying the particle size, and using solvents or surfactants, failed to achieve the intended results, or the modification costs significantly exceeded the production costs of ibuprofen. The least complicated and most effective option remained ibuprofen salt formation.15,27 An attractive solution to the solubility problem is forming ibuprofen salt with amino acids. Previous studies have shown that using basic amino acids, such as lysine or arginine, not only increases the solubility of ibuprofenate but also does not change the action or effectiveness of the active substance.28 In addition, attention was paid to using amino acids. Compared to their inorganic counterparts, they are characterized by lower basicity in the formulation and self-buffering effect.29 Subsequent studies have shown that using amino acids reduces the risk of the common ion effect in the stomach's acidic environment.30 In addition to the advantages mentioned above, using arginine salts reduces the risk of complications in the cardiovascular system due to the use of NSAIDs.31 Another advantage is the production of pleasant-tasting salts. Additionally, the drug's action can be enriched with the action of amino acids.28 An interesting alternative is using a salt – an amino acid ester as the cation. Compounds of this type are formed due to the combination of ibuprofen, which acts as an anion, and an L-amino acid ester. The researchers' reports on the work on these compounds indicate that this type of modification of ibuprofen allows to “design” of the properties of the resulting salt, thanks to the selection of individual reagents.15,32,33 Furukawa et al. obtained an amino acid ionic liquid based on L-proline ethyl ester. It has been shown that the obtained compound shows increased permeability after 48 h of testing and toxicity comparable to the proline ethyl ester.34 Our previous publications refer to the salts – ibuprofenates of L-valine alkyl esters. As a result of the work, derivatives with different alkyl chain lengths from C2–C6 and with different branching were obtained. The research carried out by our team has shown that these compounds act as promoters of the penetration of the active substance through the skin. It has been shown that the use of the ibuprofen mentioned above salts has a particular application in the local treatment of pain and significantly increases the bioavailability of the active substance in the transdermal administration of the drug. And the use of this modification of ibuprofen brings additional advantages and may be a source of exogenous amino acids. In our publications, we have shown that using the C3 alkyl chain is most advantageous.15,35 As part of subsequent studies, we obtained derivatives of isopropyl alcohol using various types of amino acids.33 Unfortunately, due to the use of a secondary alcohol, it was impossible to perform syntheses using amino acids with an aromatic (tyrosine, tryptophan) or a heterocyclic side chain (histidine).
This publication presents the synthesis of four new compounds – L-amino acid propyl esters (Tyr, Trp, His, Phe). We fully characterize them, compare their properties, and present their use as active compounds in transdermal patches with a biomonomer-based adhesive developed by our team.
Results and discussion
Active compounds – ibuprofen derivatives
As a result, four ibuprofenates of amino acid propyl esters were obtained, such as phenylalanine [PheOiPr][IBU],36 histidine [HisOiPr][IBU], tyrosine [TyrOiPr][IBU] and tryptophan [TrpOiPr][IBU], of which the last three were obtained for the first time. All compounds obtained were identified based on 1H and 13C NMR, ATR-FTIR, and elemental analysis. NMR spectra and elemental analysis results confirmed purity. All 1H and 13C NMR, FTIR spectra, TG and DSC curves, and XRD patterns for [AAOPr][IBU] are available in ESI (S1–S25†).For complete identification – NMR, FT-IR spectra assignments, and elemental analysis, see the Experimental section.
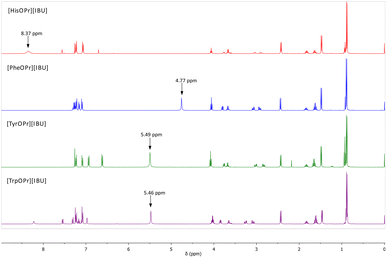
The ionic structure of the compounds obtained was confirmed based on the analysis of 1H, 13C NMR, and FTIR spectra. Fig. 1 presents a summary of the 1H NMR spectra of the obtained ibuprofenates. The figure shows the signal from the protonated amino group of the amino acid. The NH3+ signal shift values range from 8.37 ppm (for the [HisOPr][IBU]) to 4.77 ppm (for the [PheOPr][IBU]). The integration of this signal proves the protonation of the amino group. The greatest revealing effect was observed for [HisOPr][IBU], possibly due to two ibuprofenate anions in the molecule.
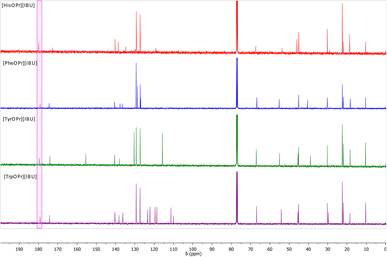
Another evidence of obtaining the ionic structure is changing chemical shifts in the 13C NMR spectrum. Fig. 2 summarizes the 13C NMR spectra of the obtained ibuprofen salts. The signal from the carbonyl group in ibuprofen is 181.16 ppm,15,37–39 while in the case of obtaining the salt of ibuprofen esters, this signal is shifted towards the lower values – from 1.29 ppm (for [HisOPr][IBU]) to 2.02 ppm (for [TrpOPr][IBU]).
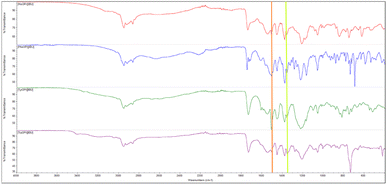
The presence of two characteristic absorption bands – asymmetric v(COO−)as and symmetric stretching vibrations v(COO−)sym was noted in the ATR-FTIR spectra, which once again confirm the ionic structure of the compounds obtained.40 The difference above 200 cm−1 between the frequency values of these two bands confirmed the presence of the carboxylate anion COO− and the ionic structure of ibuprofenates. Fig. 3 shows the ATR-FTIR spectra of the compounds obtained, and the characteristic vibrations are marked.
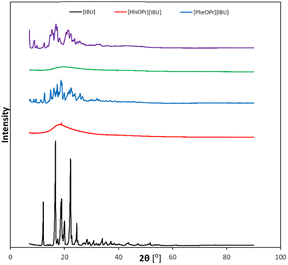
An XRD analysis was performed to confirm the crystallinity of the obtained compounds. Fig. 4 summarizes the XRD patterns of ibuprofen and amino acid propyl ester ibuprofenates. It has been shown that the diffractograms of the obtained salts differ from that of the unmodified ibuprofen, while for ibuprofen, the diffractogram is consistent with the reference diffractogram (PDF 96-230-0213).
The physicochemical properties, such as melting point, crystallization temperature, thermal stability, and specific rotation, were determined for all obtained compounds. Table 1 summarises the results.
| No. | Compound | Colour and state | Tm/°C | Tc/°C | Tonset/°C | Tmax/°C | [α]20λ |
|---|---|---|---|---|---|---|---|
| a Tc – cold crystallization temperature; Tm – melting point; Tonset – the onset of the thermal degradation; Tmax – maximum decomposition temperature; [α]20λ – specific rotation.b Data for these compounds were earlier reported in ref. 33.c Data for these compounds were earlier reported in ref. 36. | |||||||
| 1 | [IBU]b | White solid | 78.6 | — | 189.8 | 218.7 | — |
| 2 | [HisOPr][IBU] | Brownish solid | — | — | 157.5 | 212.5 | −0.7 |
| 3 | [PheOPr][IBU]c | White solid | 81.4 | 54.0 | 157.0 | 210.4 | +14.9 |
| 4 | [TyrOPr][IBU] | Yellowish wax | — | — | 148.1 | 209.4 | +1.8 |
| 5 | [TrpOPr][IBU] | Orange wax | 59.6 | — | 269.3 | 219.3 | +8.9 |
Based on thermogravimetric studies, the stability of the tested L-amino acid ibuprofenates was assessed. All TG, dTG, and c-DTA curves are in the ESI (Fig. S14–17†). A different number of degrees of degradation was observed, depending on the amino acid used in the synthesis. [PheOPr][IBU] decomposed into two stages, while [TrpOPr][IBU] decomposed into four steps. The remaining compounds unfolded in three stages. Among the tested compounds, the least stable was [TyrOPr][IBU], and the largest – [TrpOPr][IBU], which was more stable than unmodified ibuprofen. The melting points of [PheOPr][IBU] and [TrpOPr][IBU] do not exceed 100 °C. This and the confirmed ionic structure (based on the analysis of NMR and FT-IR spectra) allow classifying these compounds into the group of ionic liquids.
Since optically active amino acids were used for the syntheses, the optical rotation of the obtained derivatives was also examined (Table 1). All the derivatives obtained show the ability to rotate the plane of polarized light. All the obtained ibuprofenates, except [HisOPr][IBU], show the direction of rotation of the plane of light polarized consistent with the starting amino acids. In the case of [HisOPr][IBU], there was a change in the direction of turning the plane of left-polarized light.
To properly classify the obtained ibuprofen derivatives, their solubility in water and organic solvents was examined, and the obtained results are presented in Table 2. All L-amino acid propyl ester ibuprofenates were soluble in ethanol, dimethyl sulfoxide, methylene chloride, and chloroform. It can be seen that the use of amino acids such as histidine, tyrosine, or tryptophan affects the solubility in non-polar solvents such as n-hexane.
| No. | Solvent | [IBU]33 | [HisOPr][IBU] | [PheOPr][IBU] | [TyrOPr][IBU] | [TrpOPr][IBU] |
|---|---|---|---|---|---|---|
| a Solvents were ranked with decreasing values of empirical solvent polarity parameters, ET(30)41 (“+”: soluble >100 mg cm−3; “±”: partially soluble 33–100 mg cm−3; “−”: insoluble <33 mg cm−3) at the room temperature by modified Vogel's method.42 | ||||||
| 1 | EtOH (51.9) | + | + | + | + | + |
| 2 | DMSO (45.1) | + | + | + | + | + |
| 3 | CH2Cl2 (40.7) | + | + | + | + | + |
| 4 | CHCl3 (39.1) | + | + | + | + | + |
| 5 | ETA (38.1) | + | + | + | + | + |
| 6 | Et2O (34.5) | + | − | − | − | − |
| 7 | Toluene (33.9) | + | ± | − | − | − |
| 8 | n-Hexane (31.0) | − | + | − | + | + |
The water solubility of drugs is used to assess their bioavailability and efficacy. Therefore this parameter is key in the evaluation of potential new drugs. An equally important parameter is the partition coefficient, which predicts drug hydrophobicity and partitioning in biological systems. The solubility parameter in water and n-octanol–water partition coefficient was determined, and the results were summarised in Table 3. Converting the drug into an amino acid propyl ester salt form is a very good modification of the drug in order to improve its properties. Thanks to this, there was a clear increase in the solubility of the obtained derivatives compared to ibuprofen by about 60 times (based on the concentration of the active substance). The highest solubility in water was obtained for [HisOPr][IBU] (4.775 ± 0.046 g IBU per dm3), while [TyrOPr][IBU] had the lowest (4.188 ± 0.065 g IBU per dm3). The differences in solubilities for the derivatives obtained were insignificant.
![[thin space (1/6-em)]](https://www.rsc.org/images/entities/char_2009.gif) P) of ibuprofen and amino acid propyl ester ibuprofenates
P) of ibuprofen and amino acid propyl ester ibuprofenates
| No. | Compound | Solubility in water | log![[thin space (1/6-em)]](https://www.rsc.org/images/entities/char_2009.gif) P P |
|
|---|---|---|---|---|
| g dm−3 | g IBU per dm3 | |||
| 1 | [IBU]33 | 0.076 ± 0.001 | 0.076 ± 0.001 | +3.208 |
| 2 | [HisOPr][IBU] | 9.801 ± 0.067 | 4.775 ± 0.046 | +0.963 |
| 3 | [PheOiPr][IBU] | 9.481 ± 0.066 | 4.596 ± 0.161 | +1.021 |
| 4 | [TyrOPr][IBU] | 8.569 ± 0.022 | 4.188 ± 0.065 | +1.055 |
| 5 | [TrpOPr][IBU] | 9.396 ± 0.027 | 4.577 ± 0.037 | +1.044 |
The structural change greatly influenced the lipophilicity of the obtained derivatives. All obtained ibuprofen and amino acid isopropyl ester ibuprofenates showed a positive log![[thin space (1/6-em)]](https://www.rsc.org/images/entities/char_2009.gif) P, but they were lower than ibuprofen. All the salts obtained are, therefore, more hydrophilic. The distribution coefficient of the obtained compounds was similar and amounted to about +1. The lipophilicity of the obtained salts was ranked in ascending order: [HisOPr][IBU] < [PheOPr][IBU] < [TrpOPr][IBU] < [TyrOPr][IBU].
P, but they were lower than ibuprofen. All the salts obtained are, therefore, more hydrophilic. The distribution coefficient of the obtained compounds was similar and amounted to about +1. The lipophilicity of the obtained salts was ranked in ascending order: [HisOPr][IBU] < [PheOPr][IBU] < [TrpOPr][IBU] < [TyrOPr][IBU].
Finally, studies in vitro on the permeability of the active substance through pig skin were also carried out. Permeation profiles for ibuprofen and amino acid propyl ester ibuprofenates are plotted in Fig. 5. The cumulative mass of the individual compounds, determined after 24 h of permeation, was as follows: [PheOPr][IBU] > [HisOPr][IBU] > [TrpOPr][IBU] > [TyrOPr][IBU] and [IBU]. The permeation of all ibuprofen derivatives in the acceptor phase during 24 h of the study was significantly higher than free ibuprofen. After 24 h of permeation, the cumulative mass of penetrated compound was about ten times higher for the obtained derivatives than for ibuprofen. [PheOPr][IBU] was characterized by the most statistically significantly increased cumulative mass, and the cumulative amount of substance permeated during the 24 h study was 454.86 μg cm−2 (Table 4, Fig. 5 and S26†). However, no significant differences were found between the penetration of other derivatives, i.e., [HisOPr][IBU], [TyrOPr][IBU], and [TrpOPr][IBU]. The cluster analysis test also confirms these results, in which, i.e., [HisOPr][IBU], [TyrOPr][IBU], and [TrpOPr][IBU] form a separate cluster (Fig. S27†). The similarity between all compounds was also found using the Wilcoxon test, which showed a statistically significant difference between all derivatives and pure ibuprofen (p < 0.05) (Table S1†).
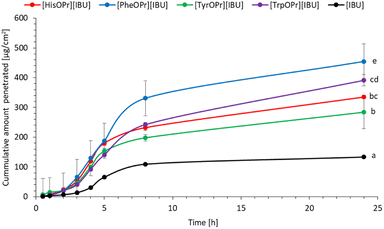 | ||
| Fig. 5 Ibuprofen and amino acid propyl ester ibuprofenates permeation profiles. Values are the means with standard deviation; n = 3. | ||
![[thin space (1/6-em)]](https://www.rsc.org/images/entities/char_2009.gif) P) of ibuprofen and amino acid propyl ester ibuprofenatesa
P) of ibuprofen and amino acid propyl ester ibuprofenatesa
| No. | Compound | CUM | JSS | KP | LT | D | Km | Q |
|---|---|---|---|---|---|---|---|---|
| a CUM – cumulative permeation mass (μg cm−2); JSS – steady-state flux (μg cm−2); KP – permeability coefficient (cm h−1); LT – lag time (min); D – diffusion coefficient (cm2 h−1); Km – skin partition coefficient; Q – the percentage of the applied dose after 24 h. | ||||||||
| 1 | [IBU] | 133.35 | 25.87 | 18.110 | 2.582 | 32.272 | 0.281 | 9.33 |
| 2 | [HisOPr][IBU] | 335.13 | 21.33 | 14.918 | 2.141 | 38.914 | 0.192 | 7.90 |
| 3 | [PheOPr][IBU] | 454.86 | 28.01 | 19.606 | 1.705 | 48.863 | 0.200 | 15.80 |
| 4 | [TyrOPr][IBU] | 284.27 | 25.57 | 17.898 | 2.133 | 39.068 | 0.229 | 9.51 |
| 5 | [TrpOPr][IBU] | 319.22 | 22.72 | 15.907 | 2.179 | 38.247 | 0.208 | 12.42 |
The formation of structural modifications of ibuprofen in the form of charged compounds with lower lipophilicity influences better permeability than the more lipophilic ibuprofen.
Based on the in vitro penetration efficiency studies for ibuprofen and its derivatives, the following permeation parameters were determined: flux (JSS, μg IBU per cm2 h), apparent permeability coefficient (KP × 103, cm h−1), lag time (LT, h), diffusion coefficient in the skin (D × 104, cm2 h−1), skin partition coefficient (Km), and percent drug permeated after 24 h (Q). The permeability parameters of the obtained compounds were similar to those determined for ibuprofen. The steady-state flux of the [AAOPr][IBU] from ethanol solution was from 21.33 μg IBU per cm2 for [HisOPr][IBU], to 28.01 for [PheOPr][IBU], while for ibuprofen – 25.87 μg IBU per cm2 h, respectively. In the case of using ibuprofenates, higher flows of active substances were obtained, which can be useful in formulations administered through the skin, like transdermal patches. The permeability coefficient, a quantitative measure of the rate at which a molecule can cross the skin, was also determined. This parameter comprises factors related to the drug, the barrier and their interaction. Furthermore, it eliminates the effect of concentration. KP values for obtained compounds ranged from 14.918 (for [HisOPr][IBU]) to 19.606 cm h−1 (for [PheOPr][IBU]). The lag time depending on the derivatives was shorter than the unmodified ibuprofen. The diffusion coefficient in the skin was similar for the obtained salts than for IBU. The skin partition coefficient, as the equilibrium solubility of the drug in the stratum corneum concerning its solubility in the vehicle, was also determined. Its values were generally lower than for ibuprofen (0.281). They ranged from 0.192 to 0.229 for [HisOPr][IBU] and [TyrOPr][IBU], respectively. Moreover, it was shown that the percentage of the applied dose after 24 h (in terms of ibuprofen) was higher for [TrpOPr][IBU] and [PheOPr][IBU]. The obtained results suggest that the obtained compounds may promote skin permeability, and the choice of the applied structural modification should be decided based on factors such as molar mass, solubility, or lipophilicity.
Fig. 6 shows the results of the permeation rate of the compounds obtained. It is clearly visible that the rates for the derivatives obtained are higher than for ibuprofen. The highest permeation rate generally was observed between 3–5 h.
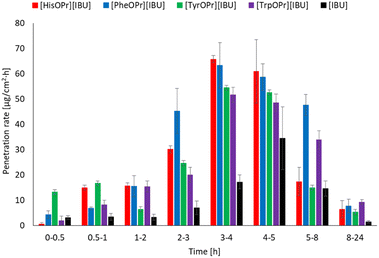 | ||
| Fig. 6 The permeation rate of ibuprofen and amino acid propyl ester ibuprofenates during the 24 h permeation; α = 0.05 (mean ± SD, n = 3). | ||
Interestingly, in the case of the derivatives obtained, much larger doses penetrate at the beginning of the study, which may help to obtain a faster therapeutic effect science fast, and increased permeation causes a quicker decrease in inflammation in the underlying tissues.43
After the permeability study was completed, accumulation in the skin was also determined. Fig. 7 presents the mass of [IBU] and its amino acid propyl salts accumulated in porcine skin after 24 h of penetration. All the compounds used accumulated in the skin to a lesser extent than ibuprofen. The accumulation in the skin of the obtained derivatives was similar and ranged from 461.56 ± 29.77 for [HisOPr][IBU], 595.41 ± 76.32 for [TrpOPr][IBU], 602.86 ± 76.98 for [PheOPr][IBU], to 609.35 ± 106.07 μg IBU per g skin for [TyrOPr][IBU]. While for the [IBU], it was 725.49 ± 164.6184 μg IBU per g skin.
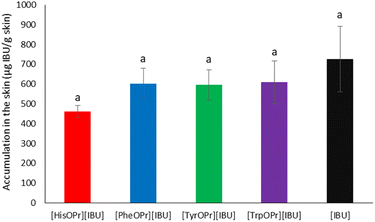 | ||
| Fig. 7 Ibuprofen and amino acid propyl ester ibuprofenates permeation profiles. Values are the means with standard deviation; n = 3. | ||
The use of active ibuprofen derivatives in transdermal patches
Therefore, based on our previous research, the PSA containing 5 wt% of acrylic acid, 70 wt% 2-hydroxyethyl acrylate, and 25 wt% isobornyl methacrylate was selected for the preparation of the transdermal patches due to its optimal parameters (viscosity, solids content).
| No. | Patches | Tg/°C | Tonset/°C | Tmax/°C | Coat weight [g m−2] | Shear strength | Adhesion [N/25 mm] | Tack [N] |
|---|---|---|---|---|---|---|---|---|
| a Tg – glass transitions; Tonset – the onset of the thermal degradation; Tmax – maximum decomposition temperature. | ||||||||
| 1 | TP | −19.80 | 269.3 | 335.3 | 39 | >72 h | 10.03 | 1.07 |
| 2 | TP-[IBU] | −48.36 | 227.6 | 335.7 | 31 | 2 min | 3.65 | 1.88 |
| 3 | TP-[IBU][Na] | −19.47 | 273.3 | 382.6 | 33 | 172 min | 0.03 | 0.05 |
| 4 | TP-[PheOPr][IBU] | −39.75 | 231.7 | 332.7 | 36 | 16 min | 5.74 | 0.11 |
| 5 | TP-[TyrOPr][IBU] | −40.77 | 262.9 | 348.5 | 33 | 7 min | 33.58 | 3.75 |
| 6 | TP-[TrpOPr][IBU] | −14.62 | 264.7 | 345.8 | 49 | 22 min | 13.28 | 6.13 |
It was shown that the addition of the active substance influences the glass transition temperature of the obtained adhesive films. The glass transition temperature of the adhesive film without the addition of active substance is −19.80 °C. For patches with the addition of IBU, [PheOPr][IBU], and [TyrOPr][IBU], the glass transition temperature obtained was lower than the glass transition temperature of the patch without the addition of the active ingredient. The addition of [IBU][Na] and [TrpOPr][IBU] slightly increases the glass transition temperature of the patch. All DSC curves are included in the ESI (Fig. S40–45†).
The thermal stability of the obtained patches was tested using thermogravimetric analysis. The following parameters were determined: onset decomposition temperature and temperature corresponding to the weight loss of 50% (determined from TG curves) and maximum decomposition temperatures (determined from DTG curves). These properties were summarized in Table 5 and Fig. S34–39 (ESI†). Among the tested polyacrylate compositions, the highest stability was characteristic for an adhesive containing sodium ibuprofenate and the lowest – containing [PheOPr][IBU]. However, it should be noted that no significant difference was found between the stability parameters of the compositions tested. Furthermore, all of the tested polyacrylate compositions were decomposed in two stages.
One of the most critical properties of pressure-sensitive adhesives is their cohesion. The medical plaster should adhere well to the skin and be easily removable without adhesive residue. Table 5 shows the time needed to break the material from the steel plate. The above measurements show that good cohesive properties characterized all obtained polyacrylate adhesives. For patches containing active substances in their composition, the time needed to tear the material is shortened, which may be caused by a decrease in the cross-linking density of the adhesive. Moreover, the breaking time of the test patches with the addition of the active substance was compared to the time needed to break the commercial products described in the literature.44 The data indicate that the average break time for commercially available materials was between 3 and 10 minutes, while for the materials obtained, this time was 2 to 22 minutes. The amount and nature of the added compound could influence the increase of cohesion of the obtained materials.
Adhesion determines the strength of the bond between an adhesive and the surface to which it is attached. This is an especially important aspect of the design of medical patches because it determines factors such as the formation of trauma or irritation when the medical patch is removed from the skin. The adhesion of the TP without active substance was 10.03 N, while a greater value was obtained for TP-[TyrOPr] [IBU]. The lowest adhesion value was obtained for the patch with [IBU][Na] – 0.03 N. Such a high decrease in adhesion in the case of the composition with sodium ibuprofenate was caused by the crystallization of ibuprofenate from the adhesive matrix or the difficulty in dissolving this compound during the preparation of the adhesive composition.
The tack test was also investigated, which assesses the effectiveness of transdermal patch adhesion by measuring the debonding force on applying light pressure for a short time. Table 5 shows the tack test results for the cross-linked adhesive film and the cross-linked adhesive films containing the active ingredient. The highest tack has the TP containing [TrpOPr][IBU] (6.13 N). In turn, the lowest values were recorded for [IBU][Na] (0.05 N).
In our in vitro study, the penetration of ibuprofen and amino acid propyl ester ibuprofenates from obtained patches with acrylic PSA was compared with the commercial product. Results of the in vitro efficiency permeation experiments related to ibuprofen are summarized in Table 6. The permeation profiles of ibuprofen from obtained transdermal patches through pigskin are shown in Fig. 9.
| No. | Patches | Cumulative permeation mass, [μg] | JSS [μg cm−2] | KP × 103 [cm h−1] | LT [min] | D [cm2 h−1] | Km | Q%24h |
|---|---|---|---|---|---|---|---|---|
| a JSS – steady-state flux; KP – permeability coefficient; LT – lag time; D – diffusion coefficient; Km – skin partition coefficient; Q – the percentage of the applied dose. | ||||||||
| 1 | Commercial product | 9.61 | 5.23 | 3.7 | 0.35 | 0.143 | 0.0013 | 2.0 |
| 2 | TP-[IBU] | 12.69 | 4.55 | 3.2 | 0.31 | 1.606 | 0.0001 | 2.7 |
| 3 | TP-[IBU][Na] | 40.68 | 3.54 | 2.5 | 0.13 | 3.981 | 0.0000 | 2.6 |
| 4 | TP-[PheOPr][IBU] | 93.83 | 3.32 | 2.3 | 59.97 | 0.008 | 0.0139 | 3.3 |
| 5 | TP-[TyrOPr][IBU] | 81.38 | 3.77 | 2.6 | 18.11 | 0.028 | 0.0048 | 2.7 |
| 6 | TP-[TrpOPr][IBU] | 75.49 | 3.14 | 2.2 | 43.57 | 0.012 | 0.0096 | 2.4 |
It was shown that the patches with the obtained acrylic PSA are an excellent alternative to the commercial ibuprofen patch.
Also, the patch with the unmodified active substance shows a worse permeation profile, similar to the commercial product. The cumulative mass of the tested compounds in acceptor fluid, considering all time points, is presented in Fig. 8. While the content of IBU and its derivatives in the acceptor fluid collected during 24 h permeation is summarized in Table 6. The cumulative mass of the individual compounds, determined after 24 h of permeation, was as follows: TP-[PheOPr][IBU] > TP-[TyrOPr][IBU] > TP-[TrpOPr][IBU] > TP-[IBU][Na] > TP-[IBU] > commercial product. From among the studied patches, TP-[PheOPr][IBU] permeated significantly higher than others; the cumulative amount of substance permeated during the 24 h study was 93.83 μg IBU per cm2. However, the permeation of all derivatives differed significantly from [IBU] and the commercial preparation (Fig. 8 and S46†). These results are also confirmed by the cluster analysis test, in which TP-[PheOPr][IBU], TP-[TyrOPr][IBU], and TP-[TrpOPr][IBU] form a separate cluster (Fig. S47†). In most cases, it was also found the similarity between derivatives and [IBU] or commercial products using the Wilcoxon test (p < 0.05) (Table S2†).
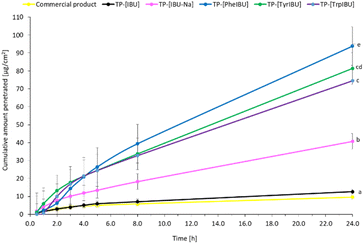 | ||
| Fig. 8 Ibuprofen and amino acid propyl ester ibuprofenates permeation profiles from obtained transdermal patches. Values are the means with standard deviation; n = 3. | ||
The steady-state flow for the investigated transdermal patches ranged from 3.14 μg cm−2 for the patch containing [TrpOPr][IBU] to 4.55 μg cm−2 for the patch containing pure ibuprofen.
The patch containing [TyrOPr][IBU] (0.0026 cm h−1) was characterized by the highest obtained derivatives value of the permeation coefficient. All the obtained results had a similar value of the permeation rate to pure ibuprofen and a commercial product.
The use of ibuprofen modification in transdermal patches generally increased the delay time, where for a commercial product, this time was about 22 seconds, and for [PheOPr][IBU], this time was about 1 h.
In the case of the investigated medical patches, the product containing sodium ibuprofenate (about 3.98 cm2 h−1) was characterized by the highest diffusion coefficient, the lowest – TP-[PheOPr][IBU]. The value of the skin partition coefficient was compared for all the products obtained. The highest value of this parameter was characterized by TP-[PheOPr][IBU].
The highest percentage of the applied dose was achieved for the patch containing TP-[PheOPr][IBU] (about 3.3%) after 24 hours of testing.
Fig. 9 shows the permeation rate of L-amino acid propyl esters ibuprofenates in particular time intervals. The permeation rate of propyl ibuprofenate transdermal patches was the highest in the first hour of the study for ibuprofen and sodium ibuprofenate. In the case of L-tyrosine propyl ester ibuprofenate, the highest permeation rate was between 1 and 2 hours of the study, while for L-tryptophan propyl ester ibuprofenate, between 2 and 3 hours of the study. Propyl ester ibuprofenate L-phenylalanine achieved its highest penetration value between the 4 and 5 hours of the study.
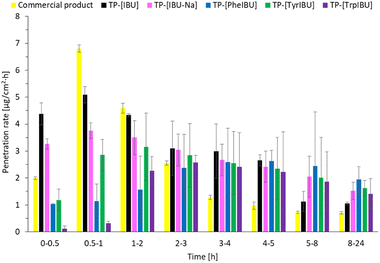 | ||
| Fig. 9 The permeation rate of ibuprofen and amino acid isopropyl ester ibuprofenates during the 24 h permeation from obtained transdermal patches; α = 0.05 (mean ± SD; n = 3). | ||
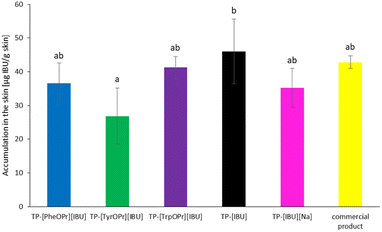
Fig. 10 shows the mass of [IBU] and its derivatives accumulated in porcine skin after 24 h of penetration. All the compounds used accumulated in the skin. The lowest accumulation for derivatives IBU values were obtained for TP = [TyrOPr][IBU] (26.852 ± 8.325 μg IBU per g skin), while the greatest accumulation in the skin is observed for TP-[IBU] (46.043 ± 9.597 μg IBU per g skin).
Experimental
Materials
All used in this research reagents were commercially available materials and were used without further purification. (R,S)-Ibuprofen (>98%) was provided from Am-Beed (Arlington Heights, IL, USA). Thionyl chloride (99.5%) was obtained from Acros Organics (Geel, Belgium). L-Histidine (≥99%) and L-phenylalanine (>98.5%) were purchased from Carl Roth (Karlsruhe, Germany). L-Tyrosine, acetonitrile (≥99.9%) for HPLC gradient grade, deuterated DMSO (99.9%), 2-ethylhexyl acrylate (2-EHA) (98%), isobornyl methacrylate (IBOMA) (>99%), azobis(isobutyronitrile) (AIBN) (99%), and n-octanol (≥99%) were provided by Sigma-Aldrich (Steinheim am Albuch, Germany). L-Tryptophan was provided by Tokyo Chemical Industry Co., Ltd (TCI, Tokyo, Japan). Propanol (PrOH), ammonium hydroxide solution 25% (NH3·H2O), anhydrous sodium sulfate, n-hexane, methylene chloride, and diethyl ether were high-purity obtained from Chempur (Gliwice, Poland). 4-Acryloyloxy benzophenone (ABP) was obtained from POLY-CHEM BmbH (Bitterfeld-Wolfen, Germany). Acrylic acid (AA) (>98%), ethanol (EtOH), chloroform, toluene, and ethyl acetate were of analytical grade purchased from StanLab (Lublin, Poland). Deuterated chloroform (CDCl3) (99.8%) (+0.03% TMSCl) was purchased from Eurisotop (Cheshire, England).Synthesis of the [AAOPr][IBU]
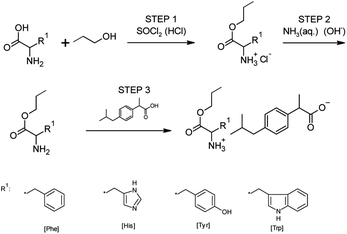
For synthesizing all obtained ibuprofen derivatives, we used the previously described three-step method,15,33,35 which was also successfully used to obtain other salts of ibuprofen amino acid alkyl esters, ketoprofen, naproxen, and salicylic acid.45–48 A reaction scheme for preparing amino acid propyl ester ibuprofenates is shown in Fig. 11.In the first step, the amino acid was esterified with a chlorinating agent, which also served as the reaction catalyst, in the presence of an excess of propanol as the reaction medium. For this, thionyl chloride was used in a molar excess of 1![[thin space (1/6-em)]](https://www.rsc.org/images/entities/char_2009.gif) :
:![[thin space (1/6-em)]](https://www.rsc.org/images/entities/char_2009.gif) 3 (AA/SOCl2). However, thionyl chloride was chosen due to the weak reactivity of histidine, tyrosine, and tryptophan. Therefore, derivatives of these amino acids could not be obtained using the safer trimethylsilane chloride. During the addition of the chlorinating agent, the reaction was carried out at a temperature of about 0 °C. Then the reaction system was heated to a temperature of 60 °C. The reaction was carried out for 24–48 hours. Next, the hydrochloride was isolated from the reaction system by distillation, followed by extraction with chloroform and washing with diethyl ether. Next, hydrochloride was dried at a temperature of 60 °C under a pressure of 20 mbar for 12 h. In the second stage, the obtained hydrochloride was neutralized with a base (25% ammonia solution) to obtain amino acid alkyl esters. Diethyl ether or ethyl acetate extraction isolated the product from the reaction mixture. The solvent was then distilled from the mixture. In the final step, the obtained amino acid alkyl ester reacted with an equimolar amount of ibuprofen. The reaction was carried out in chloroform at room temperature for 30 min. After this time, the solvent was distilled off at 60 °C in a vacuum evaporator. Next, the product was dried in a vacuum oven for 24 hours at 60 °C and 20 mbar pressure.
3 (AA/SOCl2). However, thionyl chloride was chosen due to the weak reactivity of histidine, tyrosine, and tryptophan. Therefore, derivatives of these amino acids could not be obtained using the safer trimethylsilane chloride. During the addition of the chlorinating agent, the reaction was carried out at a temperature of about 0 °C. Then the reaction system was heated to a temperature of 60 °C. The reaction was carried out for 24–48 hours. Next, the hydrochloride was isolated from the reaction system by distillation, followed by extraction with chloroform and washing with diethyl ether. Next, hydrochloride was dried at a temperature of 60 °C under a pressure of 20 mbar for 12 h. In the second stage, the obtained hydrochloride was neutralized with a base (25% ammonia solution) to obtain amino acid alkyl esters. Diethyl ether or ethyl acetate extraction isolated the product from the reaction mixture. The solvent was then distilled from the mixture. In the final step, the obtained amino acid alkyl ester reacted with an equimolar amount of ibuprofen. The reaction was carried out in chloroform at room temperature for 30 min. After this time, the solvent was distilled off at 60 °C in a vacuum evaporator. Next, the product was dried in a vacuum oven for 24 hours at 60 °C and 20 mbar pressure.
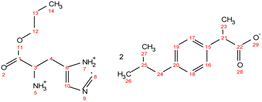 . Yield: 10%. 1H NMR (400 MHz, CDCl3) δ in ppm: 8.35 (s, 5H, H5, H7), 7.56 (s, 1H, H8), 7.23 (d, J = 8.2 Hz, 4H, H16, H17), 7.07 (d, 4H, J = 8.0 Hz, H18, H19), 6.70 (s, 1H, H10), 4.06 (t, J = 6.7 Hz, 2H, H12), 3.76 (dd, J = 7.3, 4.5 Hz, H3), 3.68 (q, J = 7.1 Hz, 2H, H21), 3.05 (dd, J = 15.1, 4.4 Hz, 1H, H4), 2.89 (dd, J = 15.1, 7.3 Hz, 1H, H4), 2.43 (d, J = 7.1 Hz, 4H, H24), 1.86–1.79 (m, 2H, H2, H25), 1.62 (h, 2H, H13), 1.48 (d, J = 7.1 Hz, 6H, H23), 0.93 (t, J = 7.4 Hz, 3H, H14), 0.88 (d, J = 6.6 Hz, 12H, H26, H27); 13C NMR (100 MHz, CDCl3) δ in ppm: 179.87 (C22), 172.83 (C1), 140.30 (C15), 138.60 (C20), 134.68 (C8), 129.86 (C6), 129.26 (C16, C17), 127.29 (C18, C19), 119.15 (C10), 67.31 (C12), 53.67 (C3), 45.97 (C21), 45.05 (C24), 30.20 (C25), 28.98 (C4), 22.42 (C13), 21.89 (C18), 18.61 (C23), 10.34 (C14); ATR-FTIR: 2953, 2925, 2868, 1743, 1549, 1511, 1459, 1420, 1383, 1364, 1216, 1185, 1088, 1062, 1021, 998, 931, 881, 847, 785, 754, 727, 661, 628, 545 cm−1; elemental analysis: calc. (%) for C35H51N3O6 (609.796): C (68.94), H (8.43), N (6.89), O (15.74), found: C (68.93), H (8.44), N (6.90), O (15.75).
 . Yield: 97%. 1H NMR (400 MHz, CDCl3) δ in ppm: 7.29–7.20 (d, t, 5H, H9, H10, H11, H17, H18), 7.16 (d, 2H, J = 8.4 Hz, H17, H18), 7.07 (d, 2H, J = 8.1 Hz, H19, H20), 4.76 (s, 3H, H5), 4.06 (t, J = 6.7 Hz, 2H, H13), 3.80 (dd, J = 7.3, 5.5 Hz, 1H, H2), 3.67 (q, J = 7.2 Hz, 1H, H26), 3.08 (dd, J = 13.6, 5.5 Hz, 1H, H4), 2.93 (dd, J = 13.6, 7.3 Hz, 1H, H4), 2.44 (d, J = 7.2 Hz, 2H, H22), 1.79–1.89 (m, 1H, H26), 1.63 (h, 2H, H14), 1.48 (d, J = 7.1 Hz, 3H, H28), 0.90 (d, t, 9H, H15, H24, H25); 13C NMR (100 MHz, CDCl3) δ in ppm: 179.17 (C27), 174.47 (C1), 140.58 (C16), 137.71 (C21), 136.62 (C6), 129.33 (C7, C8, C17, C18), 128.64 (C9, C10), 127.26 (C19, C20), 126.97 (C11), 66.77 (C13), 55.17 (C2), 45.16 (C26), 45.06 (C22), 40.42 (C4), 30.20 (C23), 22.42 (C24, C25), 21.90 (C14), 18.33 (C28), 10.38 (C15); ATR-FTIR: 2953, 2922, 2867, 2638, 1750, 1732, 1620, 1510, 1457, 1382, 1363, 1328, 1310, 1289, 1263, 1228, 1170, 1062, 1022, 1010, 934, 912, 883, 853, 786, 756, 741, 728, 698, 669, 636, 595, 540, 491, 431 cm−1; elemental analysis: calc. (%) for C25H35NO4 (413.550): C (72.61), H (8.53), N (3.39), O (15.48), found: C (72.62), H (8.54), N (3.40), O (15.47).
 . Yield: 96%. 1H NMR (400 MHz, CDCl3) δ in ppm: 7.23 (d, J = 8.1 Hz, 2H, H18, H19), 7.08 (d, J = 8.1 Hz, 2H, H20, H21), 6.94 (d, J = 8.4 Hz, 2H, H7, H8), 6.62 (d, J = 8.5 Hz, 2H, H9, H11), 5.50 (s, 4H, H5, H12), 4.08 (t, J = 6.7 Hz, 2H, H14), 3.76 (dd, J = 7.4, 5.1 Hz, 1H, H3), 3.68 (q, J = 7.2 Hz, 1H, H23), 3.02 (dd, J = 13.9, 5.1 Hz, 1H, H4), 2.83 (dd, J = 13.9, 7.4 Hz, 1H, H4), 2.43 (d, J = 7.1 Hz, 2H, H26), 1.88–1.77 (m, 1H, H27), 1.65 (h, J = 7.1 Hz, 2H, H15), 1.48 (d, J = 7.2 Hz, 3H, H25), 0.93 (t, J = 7.4 Hz, 3H, H16), 0.88 (d, J = 6.6 Hz, 6H, H28, H29); 13C NMR (100 MHz, CDCl3) δ in ppm: 179.60 (C24), 174.08 (C1), 155.44 (C10), 140.50 (C17), 137.94 (C22), 130.37 (C6), 129.31 (C7, C8), 127.27 (C18, C19), 127.19 (C20, C21), 115.77 (C9, C11), 67.03 (C14), 54.96 (C3), 45.46 (C23), 45.06 (C26), 38.95 (C4), 30.20 (C27), 22.42 (C28, C29), 21.90 (C15), 18.39 (C25), 10.38 (C16); ATR-FTIR: 2955, 2928, 2868, 1738, 1614, 1594, 1552, 1513, 1457, 1383, 1309, 1225, 1172, 1105, 1060, 1021, 1000, 928, 884, 843, 823, 800, 784, 753, 728, 679, 635, 553, 521, 434 cm−1; elemental analysis: calc. (%) for C25H35NO5 (429.549): C (69.90), H (8.21), N (3.26), O (18.62), found: C (69.91), H (8.22), N (3.26), O (18.63).
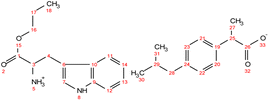 . Yield: 96%. 1H NMR (400 MHz, CDCl3) δ in ppm: 8.22 (s, 1H, H5), 7.55 (d, J = 7.8 Hz, 1H, H12), 7.31 (d, J = 8.1, 0.9 Hz, 1H, H11), 7.23 (d, J = 7.8 Hz, 2H, H20, H21), 7.17 (td, J = 8.1, 1.2 Hz, 1H, H13), 7.09 (t, d, 3H, H14, H22, H23), 6.97 (d, J = 2.2 Hz, 1H, H20, H7), 5.48 (s, 3H, H22, H5), 4.03 (td, J = 6.7, 3.3 Hz, 2H, H16), 3.84 (dd, J = 7.3, 4.8 Hz, 1H, H3), 3.64 (q, 1H, H25), 3.26 (dd, J = 14.2, 5.3 Hz, 1H, H4), 3.08 (dd, J = 14.6, 7.3 Hz, 1H, H4), 2.43 (d, J = 7.2 Hz, 2H, H28), 1.87–1.78 (m, 1H, H29), 1.60 (h, J = 7.1 Hz, 2H, H17), 1.46 (dd, J = 7.2, 1.6 Hz, 3H, H27), 0.92–0.83 (d, t, 9H, H18, H30, H31); 13C NMR (100 MHz, CDCl3) δ in ppm: 179.14 (C26), 174.25 (C1), 140.42 (C19), 138.27 (C24), 136.26 (C9), 129.30 (C20, C21), 127.36 (C10), 127.31 (C22, C23), 123.40 (C7), 122.17 (C13), 119.54 (C14), 118.62 (C11), 111.29 (C12), 110.07 (C6), 66.91 (C16), 54.11 (C3), 45.52 (C25), 45.07 (C28), 30.22 (C29), 29.61 (C4), 22.43 (C31, C30), 21.88 (C17), 18.46 (C27), 10.35 (C18); ATR-FTIR: 2955, 2926, 2868, 1737, 1549, 1511, 1457, 1420, 1383, 1357, 1282, 1215, 1092, 1061, 1009, 929, 882, 850, 796, 739, 667, 548, 461, 426 cm−1; elemental analysis: calc. (%) for C27H36N2O4 (452.586): C (71.65), H (8.02), N (6.19), O (14.14), found: C (71.66), H (8.02), N (6.18), O (14.14).
Synthesis of the acrylic PSA
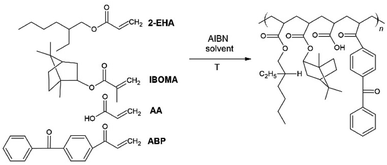
The acrylic PSA was synthesized in ethyl acetate (50 wt% polymer content) from 70–80 wt% 2-ethylhexyl acrylates – 2-EHA, 25 wt% of monomer increasing Tg (hard) – IBOMA, 5 wt% of monomers containing functional groups – acrylic acid – AA, and 0.5 wt% of unsaturated copolymerizable acryloyloxyphotoinitiator – ABP (Fig. 12). The polymerization process was carried out under the following conditions: 2 h dosage time of monomers mixture and 5 h post-reaction time in the presence of 0.1 wt% radical starter azobisisobutyronitrile (AIBN) at the temperature of 78 °C (boiling point of ethyl acetate). The reaction was carried out until the bands characteristic for acrylate groups disappeared – sharp peaks at 1636, 1409, and 809 cm−1 (ATR-FTIR control). This confirms that the copolymerization reaction has taken place and obtaining copolymers with complete conversion of acrylate groups. Moreover, a new peak at 1160 cm−1 is observed in the spectrum after the synthesis, probably responsible for forming ester bonds. The obtained acrylate copolymer was characterized in terms of solid weight content determined via gravimetry, which was approximately 80%, as well as viscosity and glass transition temperature, which were respectively η = 0.72 Pa s and Tg = −19.8 °C.Preparation of transdermal patches
Obtained acrylate copolymers constituted the adhesive matrix of the transdermal patches. Adhesive films with and without active substances were obtained. Ibuprofen, sodium ibuprofenate and ibuprofenates of L-phenylalanine, L-tyrosine and L-tryptophan propyl esters were used as active substances. For this purpose, adhesives with or without API were coated (250 μm) on a polyester film. The weight ratio of the adhesive matrix to active substance was calculated based on the adhesive characteristics, i.e., solids content, the basis weight depends on the applied thickness of the adhesive film, the characteristics of the active substance, the molar mass, and the initial assumption regarding the content of active substances in commercial products – 200 mg of active substance for the surface of the adhesive film equal to 140 cm2. The adhesive compositions were prepared by dissolving the active substance in ethyl acetate and then adding the mixture to the adhesive matrix. This step was omitted in the case of the patch without the addition of an active substance. In the next stage, the obtained adhesives were cross-linked after 10 min at 110 °C with a transfer UV lamp (Aktiprint drying-mini-18-2; UV dose: 12 × 650 mJ cm−2). The resulting adhesive film layer was covered with siliconized release paper.General analytical methods
 | (1) |
 | (2) |
![[thin space (1/6-em)]](https://www.rsc.org/images/entities/char_2009.gif) :
:![[thin space (1/6-em)]](https://www.rsc.org/images/entities/char_2009.gif) 50 mixture of water and acetonitrile with a flow – 1 ml min−1. The samples were placed in an autosampler thermostated to a temperature of 25 °C. Injections were repeated at least three times for each sample, and the results were averaged. Chromatograms recorded at a wavelength of 210 nm were used for the analysis. The calibration curve method calculated the ibuprofenate concentration from peak area measurements.
50 mixture of water and acetonitrile with a flow – 1 ml min−1. The samples were placed in an autosampler thermostated to a temperature of 25 °C. Injections were repeated at least three times for each sample, and the results were averaged. Chromatograms recorded at a wavelength of 210 nm were used for the analysis. The calibration curve method calculated the ibuprofenate concentration from peak area measurements.Based on the difference in concentrations, the concentration of substances in the n-octanol layer was determined according to eqn (3):
| Cout = C0 − Cw mg dm−3 | (3) |
Lipophilicity (log![[thin space (1/6-em)]](https://www.rsc.org/images/entities/char_2009.gif) P) is quantified using the partition coefficient P or log
P) is quantified using the partition coefficient P or log![[thin space (1/6-em)]](https://www.rsc.org/images/entities/char_2009.gif) P calculated according to eqn (4):
P calculated according to eqn (4):
log![[thin space (1/6-em)]](https://www.rsc.org/images/entities/char_2009.gif) P = log P = log![[thin space (1/6-em)]](https://www.rsc.org/images/entities/char_2009.gif) C0 − log C0 − log![[thin space (1/6-em)]](https://www.rsc.org/images/entities/char_2009.gif) Cw Cw
| (4) |
In the donor chamber, 1 cm3 of about 5% of a solution of the test compounds in 70% ethanol was placed (concentration of about 0.05 g cm−3). The donor chamber was covered with a stopper to prevent possible evaporation of the test solution. Pig skin (abdominal flap) was used for the study as it has a similar permeability to human skin.42 The analysis was carried out for 24 hours.
Samples were taken after 0.5 h, 1 h, 2 h, 3 h, 4 h, 5 h, 8 h and 24 h of mixing, respectively. After the appointed time, portions of the tested acceptor fluid were withdrawn in the amount of 0.3 cm3, and the acceptor chamber was refilled with the buffer (with the same pH). The concentrations of compounds in the acceptor fluid were determined using high-performance liquid chromatography (HPLC).
An analogous experiment was also carried out using the tested active substances' manufactured patches. For this purpose, the patches were cut to 1 cm2 and then glued to the pig skin to cover its entire surface. The experiment, as in the case of the analysis of solutions, was performed for 24 hours. Samples of the acceptor fluid were collected after 0.5 h, 1 h, 2 h, 3 h, 4 h, 5 h, 8 h and 24 h of mixing. After the appointed time, 0.3 cm3 portions of the tested acceptor fluid were taken, and the acceptor chamber was refilled with buffer (same pH). The concentrations of the obtained ibuprofenates in the acceptor fluid were measured using high-performance liquid chromatography (HPLC).
The permeability parameters were calculated according to the methodology presented in the literature.
From the curves of the dependence of the cumulative mass of compounds on time, the steady-state flow (Jss) estimated from the slope of the linear curve of the plot of the cumulative mass in the acceptor phase over time was determined and the time needed to reach the steady state permeation (LT), selected from the point of intersection of the plot of the function with the x-axis. Eqn (5) was used for the calculations:
| A = Jss × (t − LT) | (5) |
The permeability coefficient (Kp) was calculated according to eqn (6):
 | (6) |
The diffusion coefficient (D) was also determined based on eqn (7):
 | (7) |
The skin partition coefficient was calculated using eqn (8):
 | (8) |
Conclusions
As part of the presented research, amino acid propyl ester ibuprofenates were synthesized, identified, and characterized. It was shown that the obtained structural modifications of ibuprofen show higher water solubility and lower lipophilicity than ibuprofen. The obtained derivatives have also been successfully used as active substances in transdermal patches based on biocomponents. Work is a comprehensive approach to increasing the permeability of active substances through the skin.Author contributions
Conceptualization, P. O.-R.; methodology, P. O.-R., P. B. and A. N.; formal analysis, P. O.-R., K. S., M. N., A. N., W. D., Ł. K., Ł. S. and Z. C.; investigation, P. O.-R.; writing – original draft preparation, P. O.-R.; writing – review and editing, P. O.-R.; visualization, P. O.-R.; supervision, P. O.-R.; A. K. and Z. C.; project administration, P. O.-R.; funding acquisition, P. O.-R. All authors have read and agreed to the published version of the manuscript.Conflicts of interest
There are no conflicts to declare.Acknowledgements
This study was supported by the National Centre for Research and Development (grant number LIDER/53/0225/L-11/19/NCBR/2020).References
- M. Merskey, D. Albe Fessard, J. J. Bonica, A. Carmon, R. Dubner, F. W. L. Kerr, U. Lindblom, J. M. Mumford, P. W. Nathan, W. Noordenbos, C. A. Pagni, M. J. Renaer, R. A. Sternbach and S. Sunderland, Pain, 1979, 6, 249 CrossRef.
- S. N. Raja, D. B. Carr, M. Cohen, N. B. Finnerup, H. Flor, S. Gibson, F. J. Keefe, J. S. Mogil, M. Ringkamp, K. A. Sluka, X.-J. Song, B. Stevens, M. D. Sullivan, P. R. Tutelman, T. Ushida and K. Vader, Pain, 2020, 161, 1976–1982 CrossRef PubMed.
- M. Cohen, J. Quintner and S. van Rysewyk, Pain Rep., 2018, 3, e634 CrossRef PubMed.
- I. Jordan, R. Martens and K. A. Birnie, Pediatr. Neonatol. Pain, 2021, 3, 119–122 CrossRef PubMed.
- A. A. Anekar and M. Cascella, StatPearls, StatPearls Publishing, Treasure Island (FL), 2022 Search PubMed.
- B. J. Walker, D. M. Polaner and C. B. Berde, A Practice of Anesthesia for Infants and Children, Elsevier, 2019, pp. 1023–1062 Search PubMed.
- P. Ossowicz-Rupniewska, R. Rakoczy, A. Nowak, M. Konopacki, J. Klebeko, E. Świątek, E. Janus, W. Duchnik, K. Wenelska, Ł. Kucharski and A. Klimowicz, Int. J. Mol. Sci., 2021, 22, 6252 CrossRef CAS PubMed.
- F. Cilurzo, P. Minghetti, A. Casiraghi, L. Tosi, S. Pagani and L. Montanari, Eur. J. Pharm. Biopharm., 2005, 60, 61–66 CrossRef CAS PubMed.
- P. K. Bolla, B. A. Clark, A. Juluri, H. S. Cheruvu and J. Renukuntla, Pharmaceutics, 2020, 12, 1–19 Search PubMed.
- P. L. Lam and R. Gambari, J. Controlled Release, 2014, 178, 25–45 CrossRef CAS PubMed.
- A. Haq and B. Michniak-Kohn, Drug Delivery, 2018, 25, 1943–1949 CrossRef CAS PubMed.
- B. Balázs, G. Vizserálek, S. Berkó, M. Budai-Szűcs, A. Kelemen, B. Sinkó, K. Takács-Novák, P. Szabó-Révész and E. Csányi, J. Pharm. Sci., 2016, 105, 1134–1140 CrossRef PubMed.
- H. Chen, X. Chang, D. Du, J. Li, H. Xu and X. Yang, Int. J. Pharm., 2006, 315, 52–58 CrossRef CAS PubMed.
- P. Ossowicz-Rupniewska, A. Nowak, J. Klebeko, E. Janus, W. Duchnik, U. Adamiak-Giera, Ł. Kucharski, P. Prowans, J. Petriczko, N. Czapla, P. Bargiel, M. Markowska and A. Klimowicz, Materials, 2021, 14, 6808 CrossRef CAS PubMed.
- P. Ossowicz, J. Klebeko, E. Janus, A. Nowak, W. Duchnik, Ł. Kucharski and A. Klimowicz, RSC Adv., 2020, 10, 41727–41740 RSC.
- K. A. Levis, M. E. Lane and O. I. Corrigan, Int. J. Pharm., 2003, 253, 49–59 CrossRef CAS PubMed.
- H. Potthast, J. B. Dressman, H. E. Junginger, K. K. Midha, H. Oeser, V. P. Shah, H. Vogelpoel and D. M. Barends, J. Pharm. Sci., 2005, 94, 2121–2131 CrossRef CAS PubMed.
- L. R. Shaw, W. J. Irwin, T. J. Grattan and B. R. Conway, Drug Dev. Ind. Pharm., 2005, 31, 515–525 CrossRef CAS PubMed.
- R. M. Watkinson, C. Herkenne, R. H. Guy, J. Hadgraft, G. Oliveira and M. E. Lane, Skin Pharmacol. Physiol., 2009, 22, 15–21 CrossRef CAS PubMed.
- P. Bustamante, M. A. Peña and J. Barra, Int. J. Pharm., 2000, 194, 117–124 CrossRef CAS PubMed.
- P. Schleier, A. Prochnau, A. M. Schmidt-Westhausen, H. Peters, J. Becker, T. Latz, J. Jackowski, E. U. Peters, G. E. Romanos, B. Zahn, J. Lüdemann, J. Maares and B. Petersen, Int. J. Clin. Pharmacol. Ther., 2007, 45, 89–97 CrossRef CAS PubMed.
- P. M. Dewland, S. Reader and P. Berry, BMC Clin. Pharmacol., 2009, 9, 19 CrossRef PubMed.
- S. E. Nørholt, F. Hallmer, J. Hartlev, L. Pallesen, J. Blomlöf, E. J. Hansen, N. Fernandes, L. Eriksson and E. M. Pinholt, Int. J. Clin. Pharmacol. Ther., 2011, 49, 722–729 CrossRef PubMed.
- P. Brain, R. Leyva, G. Doyle and D. Kellstein, Clin. J. Pain, 2015, 31, 444–450 CrossRef PubMed.
- M. M. Santos, L. R. Raposo, G. V. S. M. Carrera, A. Costa, M. Dionísio, P. V. Baptista, A. R. Fernandes and L. C. Branco, ChemMedChem, 2019, 14, 907–911 CrossRef CAS PubMed.
- T. Lee and Y. W. Wang, Drug Dev. Ind. Pharm., 2009, 35, 555–567 CrossRef CAS PubMed.
- H. Alghurabi, Kerbala J. Pharm. Sci., 2017, 337–347 Search PubMed.
- R. Cristofoletti and J. B. Dressman, J. Pharm. Sci., 2017, 106, 92–99 CrossRef CAS PubMed.
- R. Forbes, Int. J. Pharm., 1995, 126, 199–208 CrossRef CAS.
- S. Li, P. Doyle, S. Metz, A. E. Royce and A. T. M. Serajuddin, J. Pharm. Sci., 2005, 94, 2224–2231 CrossRef CAS PubMed.
- B. Ahmetaj-Shala, A. Tesfai, C. Constantinou, R. Leszczynski, M. V. Chan, H. Gashaw, G. Galaris, S. Mazi, T. D. Warner, N. S. Kirkby and J. A. Mitchell, Biochem. Biophys. Res. Commun., 2017, 484, 762–766 CrossRef CAS PubMed.
- J. Klebeko, P. Ossowicz-Rupniewska, A. Nowak, E. Janus, W. Duchnik, U. Adamiak-Giera, Ł. Kucharski, P. Prowans, J. Petriczko, N. Czapla, P. Bargiel, M. Markowska and A. Klimowicz, Materials, 2021, 14, 6678 CrossRef CAS PubMed.
- P. Ossowicz-Rupniewska, J. Klebeko, E. Świątek, K. Bilska, A. Nowak, W. Duchnik, Ł. Kucharski, Ł. Struk, K. Wenelska, A. Klimowicz and E. Janus, Int. J. Mol. Sci., 2022, 23, 4158 CrossRef CAS PubMed.
- S. Furukawa, G. Hattori, S. Sakai and N. Kamiya, RSC Adv., 2016, 6, 87753–87755 RSC.
- E. Janus, P. Ossowicz, J. Klebeko, A. Nowak, W. Duchnik, Ł. Kucharski and A. Klimowicz, RSC Adv., 2020, 10, 7570–7584 RSC.
- P. Ossowicz-Rupniewska, J. Klebeko, E. Świątek, J. Szachnowska, E. Janus, M. Rangelov, N. Todorova, S. G. Taneva, E. Krachmarova and M. Guncheva, J. Mol. Liq., 2022, 360, 119367 CrossRef CAS.
- P. Ossowicz, E. Janus, G. Schroeder and Z. Rozwadowski, Molecules, 2013, 18, 4986–5004 CrossRef CAS PubMed.
- R. Radeglia, J. Prakt. Chem., 1981, 323, 1015–1016 CrossRef.
- Z. Rozwadowski, J. Mol. Struct., 2005, 753, 127–131 CrossRef CAS.
- S. Vairam, T. Premkumar and S. Govindarajan, J. Therm. Anal. Calorim., 2010, 100, 955–960 CrossRef CAS.
- C. Reichardt, Solvents and solvent effects in organic chemistry, Wiley-VCH, Weinheim, 3rd edn, 2003 Search PubMed.
- B. S. Furniss and A. I. Vogel, Vogel's textbook of practical organic chemistry, Pearson/Prentice Hall, Harlow, 5th edn, 2009 Search PubMed.
- S. K. Singh and A. W. Savoy, J. Mol. Liq., 2020, 297, 112038 CrossRef CAS.
- P. Ossowicz-Rupniewska, P. Bednarczyk, M. Nowak, A. Nowak, W. Duchnik, Ł. Kucharski, J. Rokicka, A. Klimowicz and Z. Czech, Int. J. Mol. Sci., 2021, 22, 11840 CrossRef CAS PubMed.
- P. Ossowicz, P. Kardaleva, M. Guncheva, J. Klebeko, E. Świątek, E. Janus, D. Yancheva and I. Angelov, Molecules, 2020, 25, 90 CrossRef CAS PubMed.
- P. Ossowicz, E. Janus, J. Klebeko, E. Światek, P. Kardaleva, S. Taneva, E. Krachmarova, M. Rangelov, N. Todorova and M. Guncheva, J. Mol. Liq., 2020, 319, 114283 CrossRef CAS.
- J. Klebeko, P. Ossowicz-Rupniewska, E. Świątek, J. Szachnowska, E. Janus, S. G. Taneva, E. Krachmarova and M. Guncheva, Molecules, 2021, 27, 216 CrossRef PubMed.
- P. Kardaleva, M. Guncheva, S. Todinova, I. Angelov, P. Ossowicz and E. Janus, J. Therm. Anal. Calorim., 2020, 142, 1911–1917 CrossRef CAS.
- A. Haq, B. Goodyear, D. Ameen, V. Joshi and B. Michniak-Kohn, Int. J. Pharm., 2018, 547, 432–437 CrossRef CAS PubMed.
- P. Bednarczyk, K. Mozelewska and Z. Czech, Int. J. Adhes. Adhes., 2020, 102, 102652 CrossRef CAS.
- A. Antosik, Chem. Rev., 2016, 1, 73–75 CrossRef.
Footnote |
| † Electronic supplementary information (ESI) available. See DOI: https://doi.org/10.1039/d2ra05804a |
| This journal is © The Royal Society of Chemistry 2022 |

