 Open Access Article
Creative Commons Attribution 3.0 Unported Licence
MOF-derived biochar composites for enhanced high performance photocatalytic degradation of tetracycline hydrochloride†
Zhiwei Liua,
Yi Lia,
Chen Lia,
Kunyapat Thummavichaibc,
Chen Fenga,
Zhen Lia,
Song Liua,
Shenghua Zhang*a,
Nannan Wang *a and
Yanqiu Zhu
 ab
ab
aGuangxi Institute Fullerene Technology (GIFT), Key Laboratory of New Processing Technology for Nonferrous Metals and Materials, Ministry of Education, School of Resources, Environment and Materials. Guangxi University, Nanning 530004, China. E-mail: shzhang@gxu.edu.cn; wangnannan@gxu.edu.cn
bCollege of Engineering, Department of Mathematics and Physical Sciences, University of Exeter, Exeter, EX4 4QF, UK
cFaculty of Engineering and Environment, Northumbria University, Newcastle Upon Tyne NE1 8ST, UK
First published on 8th November 2022
Abstract
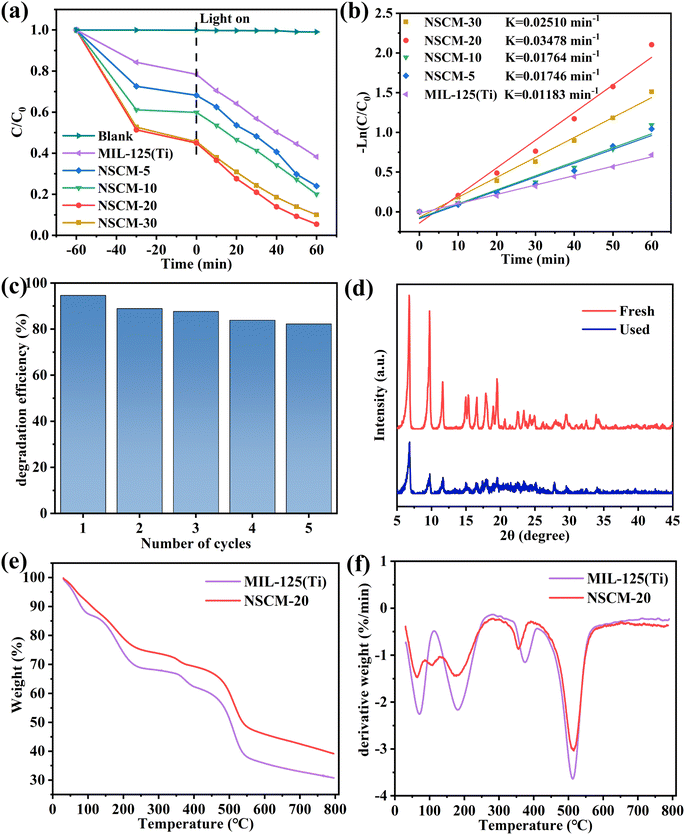
Biochar reinforced advanced nanocomposites are of interest to a wide circle of researchers. Herein, we describe a novel MOF-derived reinforced cow dung biochar composite, which was prepared by a one-step hydrothermal method to form the MOF MIL-125(Ti) onto a nitrogen and sulfur co-doped bio-carbon (NSCDBC). The UV-vis diffuse reflectance spectrum of NSCDBC/MIL-125(Ti) exhibits an extension of light absorption in the visible region (360–800 nm), indicating its higher visible light capture capacity relative to pure MIL-125(Ti). The photocatalytic activity results show that all the NSCDBC/MIL-125(Ti) composite samples, namely NSCM-5, NSCM-10, NSCM-20 and NSCM-30 display good performance in the removal of tetracycline hydrochloride compared to pure MIL-125(Ti). Among them, NSCM-20 exhibits the highest catalytic activity with a removal rate of 94.62%, which is attributed to the excellent adsorption ability of NSCDBC and the ability to inhibit the complexation of photogenerated electron–hole pairs. Photoluminescence verifies that the loading of biochar successfully enhances the separation of photogenerated electron–hole pairs. Subsequently, the active species in the photocatalytic process are identified by using electron spin resonance spin-trap techniques and free radical trapping experiments. Finally, the possible reaction mechanism for the photocatalytic process is revealed. These results confirm that NSCDBC/MIL-125(Ti) is a potentially low-cost, green photocatalyst for water quality improvement.
1 Introduction
The rapid development of modern medicine and graziery generally comes at the expense of the environment. The discharge of wastewater has been a serious threat to the ecosystem, with the most serious impact being pollution with antibiotic wastewater.1,2 Among the many antibiotics, tetracycline hydrochloride (TC) is the most widely used in animal husbandry and medical treatments.3,4 TC tends to have a stable structure and a long half-life, and thus cannot be fully absorbed by organisms, resulting in its widespread presence in surface water, coastal environments, soil, groundwater and even drinking water.5 TC will induce antibiotic-resistant pathogens when exposed to drinking water for a long time,6 which can make the existing drug treatments less effective. Due to its chemical stability, TC is difficult to degrade by conventional treatments.7 Therefore, it is essential to find effective methods to degrade tetracycline contaminants. Various techniques have been reported for the elimination of TC from water, such as adsorption,8 biodegradation,9 electrolysis,10 advanced oxidation11 and photocatalysis.12,13 Among them, photocatalysis is considered as the most promising approach because of its high efficiency, low cost, non-toxicity and environmental friendliness.14There exist a number of disadvantages, like large forbidden bandwidth, inability to make full use of sunlight, and high photo-generated electron–hole complexation rate, for the Conventional semiconductor materials, such as TiO2,15 g-C3N4 ref. 16 and ZnO,17 which limit their further development and sequence applications. As a rapidly developing coordination polymer in recent years, metal–organic frameworks (MOFs) possess the advantages of tunable chemical properties, regular crystal structure, large specific surface area and high porosity.18–20 Therefore, they have gained wide attention in the fields of catalysis,21,22 adsorption23,24 and light capture.25,26 Among many MOFs, MIL-125(Ti) is widely considered as a common photocatalyst due to its easy preparation, high porosity and crystal stability.27 However, its higher band-gap of 3.6 eV makes it active only in the UV region.28 It is expected to improve its absorption in the visible part by compounding carbon-based materials.
Carbon-based materials have been used to enhance photocatalytic performance because of their excellent charge carrier mobility, good electrical and thermal conductivity,29 such as reduced graphene oxide30 and carbon nanotubes.31 However, carbon nanotubes and graphene have limited application in practical wastewater treatment due to their high cost and complex process.32 Compared with other carbon-based materials, BC has the advantages of a wide range of raw materials, simple treatment conditions, and has a good prospect in wastewater treatment.33
Biochar (BC) is obtained from the pyrolysis of biological waste such as agricultural residues, food scraps and woody waste under anaerobic conditions.34 BC equips the advantages of good strong adsorption ability, various surface functional groups and electrical conductivity, and has become an excellent substrate for enhanced photocatalytic performance.35,36 For example, pyrolytic char (PC) is used as the carrier and TiO2 is loaded in situ to form PC/TiO2. Compared with pure TiO2, the maximum adsorption capacity of the nano-composite catalyst PC/TiO2 for phenol range from 24.7 mg g−1 to 41.2 mg g−1. PC acts as the receiver for photoelectrons allowing PC/TiO2 to exhibit enhanced phenol removal capabilities.37 Chen et al.38 in situ synthesized a new composite material PbMoO4@BC, and the study show that the catalyst with 1![[thin space (1/6-em)]](https://www.rsc.org/images/entities/char_2009.gif) :
:![[thin space (1/6-em)]](https://www.rsc.org/images/entities/char_2009.gif) 4 ratio of PbMoO4 to BC showed the best photocatalytic performance, with a substrate concentration of 150 mg L−1, the removal rate of TC reach 61.0% more than twice PbMoO4 (26%).
4 ratio of PbMoO4 to BC showed the best photocatalytic performance, with a substrate concentration of 150 mg L−1, the removal rate of TC reach 61.0% more than twice PbMoO4 (26%).
Cow manure has a large amount of undigested cellulose and lignin, which is a natural source of carbon. Cow dung based BC can be used as an efficient adsorbent for removing toxic inorganic anions, heavy metals, dyes and other environmental pollutants.39–41 Cow-down is un-want waste and has limitation on development or applying into various technologies, only can use as a fertilizer etc. No one focus on using it. As a major source of solid waste from the cattle industry,42 cattle manure has a high risk of pathogen transmission and infection, and its disposal is considered as a huge challenge for the livestock and farming industry.43 Currently, the BC from cattle down is considered to be an effective pollutant treatment strategy.44
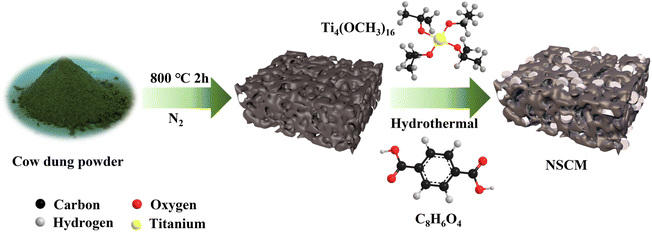
In this work, for the first time, a porous NSCDBC with low cost, environmentally friendly and excellent adsorption properties was prepared by co-doping of N and S with L-cysteine hydrochloride using cow dung as a carbon source. The NSCDBC/MIL-125(Ti) photocatalytic composite was synthesized in situ by a one-step hydrothermal method. After various characterizations of the catalyst, their photocatalytic property was determined by photodegradation of TC. Finally, ESR and free radical trapping experiments are conducted to identify the active species and to explore the pivotal role of NSCDBC in the photocatalytic process.
2 Experimental
2.1 Chemical reagents
Titanium isopropoxide (Ti4(OCH3)16, Shanghai Macklin Biochemical Co., Ltd), 1,4-benzenedicarboxylic acid (H2BDC; C8H6O4, Shanghai Macklin Biochemical Co., Ltd), methanol (CH3OH, Shanghai Aladdin Biochemical Technology Co., Ltd), N,N-dimethylformamide (DMF; (CH3)2NCHO, Guandong Guanghua Sci-Tech Co., Ltd), sodium bicarbonate (NaHCO3, Guandong Guanghua Sci-Tech Co., Ltd), L-semicarbazone hydrochloride (C3H7NO2S–HCl–H2O, Sinopharm Chemical Reagent Co., Ltd), anhydrous ethanol (CH3CH2OH, Guandong Guanghua Sci-Tech Co., Ltd), L-ascorbic acid (L-AA; C6H8O6, Damao Chemical Reagent Factory), 2-methyl-2-propanol (IPA; (CH3)3COH, Guandong Guanghua Sci-Tech Co., Ltd), disodium ethylenediaminetetraacetate (EDTA-2Na; C10H14N2Na2O8, Shanghai Macklin Biochemical Co., Ltd) and tetracycline hydrochloride (TC; C22H24N2O8, Shanghai Aladdin Biochemical Technology Co., Ltd). All reagents and solvents were analytically pure and not further purified before use.2.2 Preparation of photocatalysts
2.3 Analytical methods
The crystal pattern of MIL-125(Ti), NSCDBC and NSCDBC/MIL-125(Ti) composites were analyzed by X-ray diffractometer (XRD, Rigaku D/MAX 2500 V, Rigaku Corporation), working under 40 kV accelerating voltage with Cu Kα1 radiation (λ = 1.54056 Å) characterized by recording 2θ in the range of 5° to 80°. Scanning electron microscopy (SEM, Sigma 300, Carl Zeiss) and transmission electron microscopy (TEM, Tecnai F20, FEI) were used to study the microstructure and morphology of the as-prepared photocatalysts. A surface area analyzer (TriStar II 3020, Micromeritics) was used to analyze the specific surface area and pore volume of the synthesized photocatalysts. UV-vis diffuse reflectance spectra (DRS) was acquired on a Lambda 365 spectrophotometer (PerkinElmer). Fourier transform infrared (FT-IR) spectra of photocatalysts were collected by Fourier transform infrared spectrometer (Nicolet iS50, Thermo Fisher Scientific). X-ray photoelectron spectroscopy (XPS) of composites was performed on ESCALAB 250XI (Thermo Fisher) using Al Kα source. The UV spectrometer (Lambda 365, PerkinElmer) was used to measure the concentration of TC in this study. Total organic carbon (TOC) was obtained by the Shimadzu TOC-L CPH analyzer. The photoluminescence (PL) spectra of the composites were acquired by the FL3C-111 TCSPC spectrometer. Thermogravimetry Analysis (TGA) spectra of the composites were acquired by PerkinElmer TGA4000.2.4 Photocatalytic experiment
The photocatalytic performance of the as-prepared NSCDBC/MIL-125(Ti) samples was evaluated by degrading TC under light conditions at an initial concentration of 40 mg L−1. The light source was a 300 W xenon lamp. In this procedure, 20 mg of as-prepared sample was added into 100 mL contaminant solution and stirred in the darkness condition for 60 min ensure an adsorption–desorption equilibrium between the catalyst and the contaminant. Then, the suspension is illuminated and a 4 mL sample is taken every 10 minutes and centrifuged to remove the catalyst particles. After completion of irradiation, the NSCM-20 pellets were recovered by centrifugation, washed several times with ultrapure water, and then dried. After that, the stability of TC was evaluated by direct photocatalytic degradation of TC using NSCM-20. The catalytic efficiency is reflected by the variation of the TC concentration determined by the UV spectrophotometer studied at the maximum absorption wavelength of 360 nm.3 Results and discussion
3.1 Morphology characterizations
The surface morphologies of NSCDBC, pure MIL-125(Ti) and NSCM-20 were analyzed by SEM and TEM. This can be seen in Fig. 2a and b, NSCDBC microspores are formed during the pyrolysis of cow dung. The MIL-125(Ti) material performs a pie-shaped structure with a radius of 0.3–0.5 μm, a thickness of about 0.25 μm, and a relatively smooth surface. For NSCM-20 composite sample, it can be clearly seen that MIL-125(Ti) is attached to the surface of NSCDBC (Fig. 2c). Further results from TEM of the NSCDBC/MIL-125(Ti) composite are given. NSCDBC shows that MIL-125(Ti) is grown in situ on NSCDBC with a tight bond between them (Fig. 2d). In addition, SEM-EDS mapping results also confirms that the C, O, Ti, N and S elements are uniformly distributed in one NSCDBC, indicating that MIL-125(Ti) particles are uniformly attached to the NSCDBC surface (Fig. 2e–j).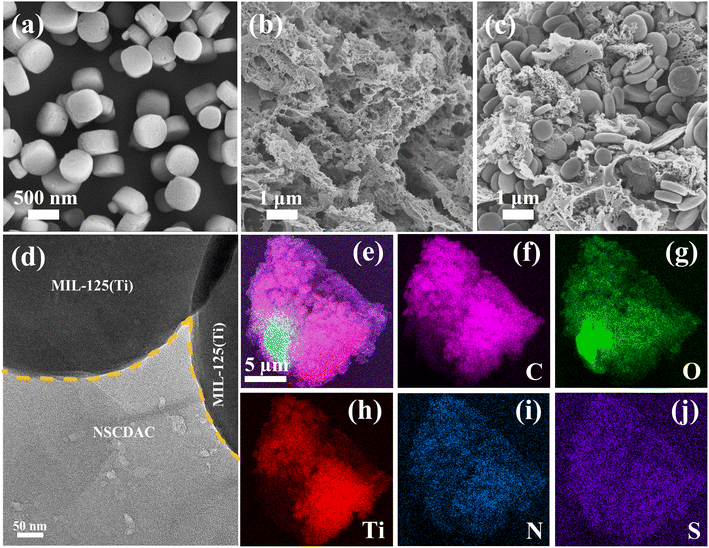 | ||
| Fig. 2 SEM images of as-prepared samples: (a) pure MIL-125(Ti); (b) NSCDCA; (c) NSCM-20, TEM images of (d) NSCM-20, (e–j) SEM-EDS mapping images of NSCM-20. | ||
3.2 Composition and structure characterizations
The phase structures of MIL-125(Ti) and composites by X-ray diffractometry (XRD) are shown in Fig. 3a. For NSCDBC, the broad peaks at 2θ = 23° and 43° are designated as characteristic peaks of graphitic carbon. For pure MIL-125(Ti), the XRD diffraction peaks at 6.9°, 9.8° and 11.7° correspond to the (101), (200) and (221) planes of the MIL-125(Ti) crystal, respectively, which are in full agreement with those reports previously.45,46 It indicates that pure MIL-125(Ti) is successfully prepared. No typical diffraction peaks change can be found in the NSCDBC/MIL-125(Ti) composite sample, but a change in intensity. This result indicates that MIL-125(Ti) crystals can be formed perfectly in the presence of biomass carbon. It is noteworthy that no graphitic carbon peak is observed in the XRD pattern of NSCDBC/MIL-125(Ti) sample, which is due to NSCDBC is amorphous and the content is low. This clearly demonstrates the successful preparation of NSCDBC/MIL-125(Ti) composites.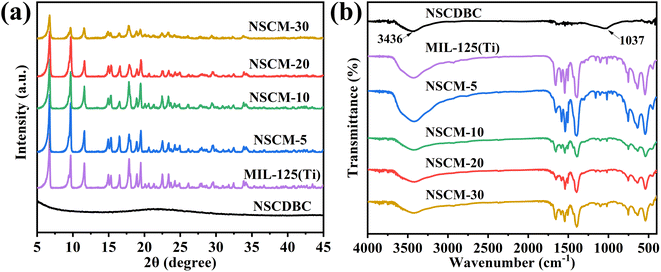 | ||
| Fig. 3 (a) XRD patterns of MIL-125(Ti), NSCDBC and NSCDBC/MIL-125(Ti); (b) FT-IR spectra of NSCDBC, MIL-125(Ti) and NSCDBC/MIL-125(Ti). | ||
FT-IR is used to study the functional groups of composite materials. As shown in Fig. 3b, for NSCDBC samples, the broad peak at 3380–3700 cm−1 is caused by the adsorption of water molecules.47 The absorption peak at 1037 cm−1 corresponds to the symmetric stretching vibration of C–O–C. For MIL-125(Ti), the broad peak at 3424 cm−1 is caused by solvent molecules adsorbed in MIL-125(Ti). The broad peaks at 1655 and 1400 cm−1 are attributed to the vibrational stretching of O–C–O in the framework, which also confirms the presence of terephthalate linker in MIL-125(Ti). There is Characteristic absorption peak located at 1013 and 740 cm−1, which belong to benzene rings. The bands between 400 and 800 cm−1 origin from O–Ti–O vibrations.48 NSCDBC/MIL-125(Ti) composites show characteristic peaks similar to those of MIL-125(Ti), and when the ratio of NSCDBC/MIL-125(Ti) is changed, a change in the intensity of the above-infrared absorption bonds can be observed, indicating the existence of interaction forces between MIL-125(Ti) and NSCDBC. Therefore, NSCDBC/MIL-125(Ti) composites are successfully prepared.
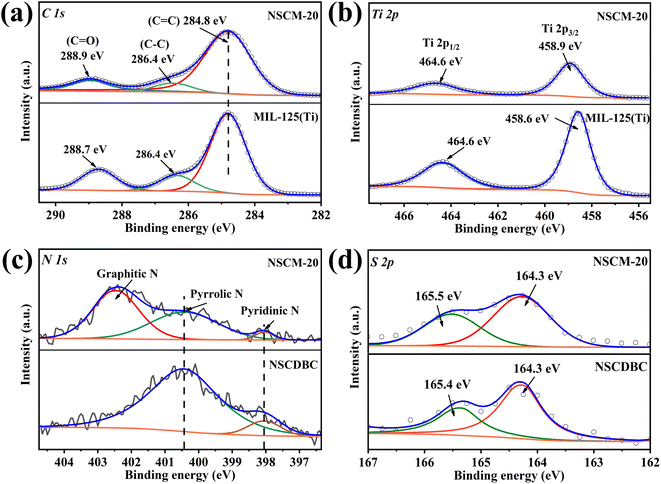
The elemental valence surface chemistry and surface chemistry of the composites are further analyzed by XPS, the results of the high-resolution XPS spectra of C 1s, N 1s, S 2p and Ti 2p in the NSCDBC, MIL-125(Ti) and NSCM-20 are shown in Fig. 4. Three peaks are found at 284.8, 286.38 and 288.7 eV in the C 1s spectra of pure MIL-125(Ti) (Fig. 4a), which comes from the sp2 hybridization of carbon (C![[double bond, length as m-dash]](https://www.rsc.org/images/entities/char_e001.gif) C),49 C–C and carboxylate group on H2BDC (O–C
C),49 C–C and carboxylate group on H2BDC (O–C![[double bond, length as m-dash]](https://www.rsc.org/images/entities/char_e001.gif) O). The C 1s spectrum of NSCM-20 shows a shift of the carbon-oxygen double bond toward the high binding energy of about 0.26 eV. The high-resolution S 2p peaks of both NSCDBC and NSCM-20 are fitted to two components located around 164 and 165 eV in Fig. 4d, For NSCDBC, the two peaks correspond to the 2p3/2 and 2p1/2 orbitals of S, respectively, indicating the incorporation of S into the carbon framework.50 Note that the S 2p3/2 charge is shifted in the sample of NSCM-20. Fig. 4c shows the N 1s spectrum of NSCDBC and NSCM-20. The N 1s spectrum of NACDBC can be decomposed into two peaks, which attribute to pyrrolic-like nitrogen (400.43 eV) and pyridine-like nitrogen (398.04 eV),32,51 while the N and S contents are 1.9% and 0.56%, respectively. The above results indicate the successful binding of N and S substances into the carbon framework and creates a synergistic effect.
O). The C 1s spectrum of NSCM-20 shows a shift of the carbon-oxygen double bond toward the high binding energy of about 0.26 eV. The high-resolution S 2p peaks of both NSCDBC and NSCM-20 are fitted to two components located around 164 and 165 eV in Fig. 4d, For NSCDBC, the two peaks correspond to the 2p3/2 and 2p1/2 orbitals of S, respectively, indicating the incorporation of S into the carbon framework.50 Note that the S 2p3/2 charge is shifted in the sample of NSCM-20. Fig. 4c shows the N 1s spectrum of NSCDBC and NSCM-20. The N 1s spectrum of NACDBC can be decomposed into two peaks, which attribute to pyrrolic-like nitrogen (400.43 eV) and pyridine-like nitrogen (398.04 eV),32,51 while the N and S contents are 1.9% and 0.56%, respectively. The above results indicate the successful binding of N and S substances into the carbon framework and creates a synergistic effect.
In addition to the characteristic peaks of pyrrole nitrogen and pyridine nitrogen in the NSCM-20 spectrum, a new characteristic peak appears at 402.45 eV, which corresponds to graphitic nitrogen. This is meaningful for improving the catalytic performance of the oxygen reduction reaction (ORR).52 Fig. 4b shows the comparison of Ti 2p spectra between NSCM-20 and MIL-125(Ti). It can be seen that two peaks appear at 458.57 and 464.31 eV from the Ti 2p3/2 and 2p1/2 orbitals, respectively, indicating that titanium is present in the titanium cluster in the IV-valent form.53,54 Moreover, the characteristic peaks of Ti shift toward higher binding energies after NSCDBC loading, which is attributed to the possible formation of Ti-OC bond inside the composite structure.55 The above results show that well-bonded NSCDBC/MIL-125(Ti) composite material is successfully synthesised.
There is characterization of specific surface area, pore size distribution and total pore volume of composites by means of BET specific surface area analysis. As shown in Fig. 5a, pure MIL-125(Ti) exhibits a type I adsorption isotherm, indicating a typical microporous structure. A pore size distribution of about 0.48 nm is estimated by using the Horvath-Kawazoe method (Fig. S1†).56 However, a very small hysteresis loop can be observed in the figure (P/P0, 0.47–1.0), the formation of which is related to capillary condensation, indicating that a certain mesoporous/macropore structure is also present in the MIL-125(Ti) structure. The presence of a small amount of mesoporous structure can also be observed by the Barrett–Joyner–Halenda method (Fig. S2†). On the other hand, pure NSCDBC presents as a type IV adsorption isotherm with the presence of mesopores (2–50 nm) at Fig. 5b and S3.† In addition, the hysteresis return line of pure NSCDBC is H3 type, which implies the presence of slit-like pores and capillary agglomerates in mesopores.57 Fig. 5c shows NSCM-20 exhibits mixed type I and IV adsorption isotherms with a large hysteresis return line, indicating the presence of micro-and mesopores. In the photocatalytic process, the presence of a certain number of mesoporous structures facilitates the adsorption of pollutants by the catalyst and improves the photocatalytic reaction efficiency.
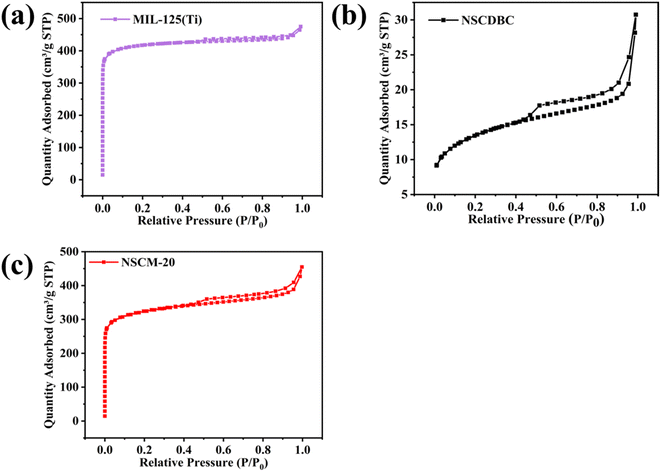 | ||
| Fig. 5 Nitrogen absorption–desorption isotherms of (a) pure MIL-125(Ti), (b) NSCDBC and (c) NSCM-20. | ||
The specific pore volume and surface area of these three catalysts are shown in Table 1. The specific surface area and pore volume of MIL-125(Ti) are 1925.92 m2 g−1 and 0.566 cm3 g−1, respectively, and the corresponding values of NSCDBC are 99.80 m2 g−1 and 0.048 cm3 g−1, respectively. The specific surface area and pore volume of NSCM-20 are between the values of the two individual substances, corresponding to 1626.94 m2 g−1 and 0.376 cm3 g−1. MIL-125(Ti) and NSCM-20 have high microporosity. The larger the specific surface area of the catalyst is, the smaller the microporous pore size will be, and the more adsorption and catalytic sites will possess, which facilitate the removal of the target contaminant, in this case tetracycline hydrochloride.
| Samples | Specific surface area (SSA) (m2 g−1) | Pore volume (cm3 g−1) |
|---|---|---|
| MIL-125(Ti) | 1925.92 | 0.566 |
| NSCDBC | 99.80 | 0.048 |
| NSCM-20 | 1626.94 | 0.376 |
3.3 Optical and electronic properties
The light absorption ability and band-gap energy of the catalyst largely determine the activity of the catalyst. As shown in the Fig. 6a, all samples exhibit very good absorption in the UV region (λ < 300 nm). The absorption edge of pure MIL-125(Ti) is around 350 nm, and it almost does not absorb visible light at wavelengths greater than 400 nm. After loading NSCDBC, the composite catalysts exhibit a significant absorption enhancement in the visible band, indicating their ability to utilize visible and UV light for photocatalytic processes.In addition, the band gap of all catalysts are estimated based on the Kubelka-Munk equation.58
| (F(R∞) × hυ)2 = B(hυ − Eg)1 |
 | (2) |
 | (3) |
Due to modifications, including surface doping, defects, and blocking, an in-band gap state may be introduced, resulting in an inaccurate estimate of Eg. Therefore, the linear fit to the basal peak and the linear fit to the slope below the basal absorption are given, and the transverse coordinate of the intersection point is the band gap estimate (Fig. 6b). The band-gap of pure MIL-125(Ti), NSCM-5, NSCM-10, NSCM-20 and NSCM-30 are 3.69, 3.66, 3.65, 3.64 and 3.64 eV, respectively, indicating that the loading of biomass carbon has no effect on the narrowing of the band-gap energy but promotes the absorption of the visible fraction. The obtained results are in agreement with other literature reports.37
As previously mentioned, NSCDBC has the effect of enhancing the separation of photogenerated electron–hole pairs, which results in the excellent photocatalytic performance of NSCDBC/MIL-125(Ti) composites. To prove this conclusion, PL measurements are used to examine the separation efficiency of photogenerated electron–hole pairs in the composites. In general, the weaker intensity of the PL result, the lower recombination of photoexcited charge carriers.59 Notably, the emission intensity of NSCM-20 is significantly lower than that of pure MIL-125(Ti), indicating that the photogenerated electron–hole separation is more effective in NSCM-20 (Fig. 6c). We suggest that NSCDBC can indeed act as an effective electron acceptor and hinder the complexation of photogenerated carriers under illumination. However, the electron–hole separation efficiency decreases when the NSCDBC content is higher than 30%, indicating that the excess NSCDBC is not favorable for charge separation. This conclusion is alignment with the impunity of photocatalytic performance tests.
3.4 Photocatalytic experiment
The excellent degradation performance of NSCM-20 is attributed to the synergistic effect between MIL-125(Ti) and BC. Three main effects of NSCDBC can be summarized as: (i) NSCDBC acts as an effective electron transport channel and acceptor to improve the separation of photogenerated electron–hole pairs, thus positively favoring the photocatalytic oxidation efficiency; (ii) the NSCDBC can promote light absorption as shown by UV-vis spectroscopy analysis; (iii) the abundant functional groups on the surface of NSCDBC have a strong affinity for organic substances thus enabling TC to be enriched on its surface. It is noteworthy that the removal efficiency of NSCM-30 slightly decreases, mainly due to the excess of biochar blocking the light reaching the catalyst surface.
The kinetics of TC photocatalytic degradation is investigated, and the variation of TC concentration with irradiation time for all prepared samples is in accordance with the quasi-level kinetic curve as shown in Fig. 7b. The equation-ln(C/C0) = kappt, where t, C0 and C are the reaction time, initial TC concentration (mg L−1) and TC concentration at time t (mg L−1), respectively. k represents the apparent pseudo-primary rate constant (min−1).60 The highest rate constant for NSCM-20 (0.03478 min−1) is approximately the same as that for pure MIL-125(Ti) (0.01183 min−1), which is consistent with the photocatalytic activity performance.
 | ||
| Fig. 8 Active species trapping experiment during the photocatalytic degradation of TC over NSCM-20 (a) and DMPO spin-trapping ESR spectra recorded with NSCM-20 under light irradiation (b and c). | ||
ERS is used to characterize the active particles produced by the catalyst in aqueous solution. As shown in the Fig. 8b and c, both ˙OH and ˙O2− radicals show negligible characteristic signals under dark conditions. It can be clearly seen that it shows the clear ˙O2− characteristic peak and also detects the signal of ˙OH radicals after illumination. Thus, the ESR results further demonstrate that limited ˙OH radicals come into being in the NSCM-20 system, and the addition of t-BuOH has little effect on the removal rate of ˙OH radicals. This is due to the low concentration of ˙OH radicals.62
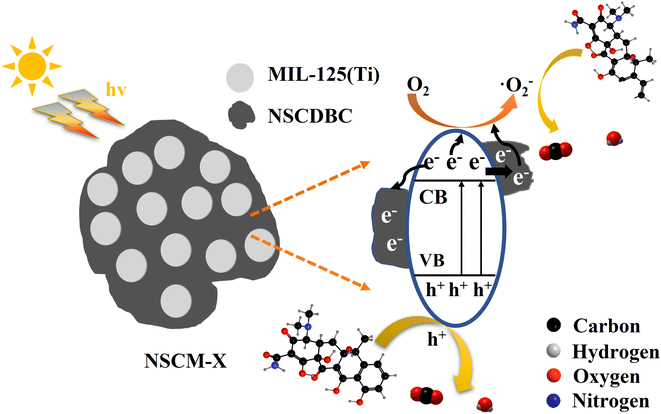
Based on the above experiments and analysis, a reasonable degradation mechanism of NSCM-20 is proposed (Fig. 9). Firstly, biochar adsorbs TC molecules attribute to its high porosity and abundant functional groups (i.e. C–O–C, –OH, C–O), which provide more opportunities for contact between the catalyst and the pollutant. When exposed to light, NSCM-20 is photoexcited to generate electrons and transferred to the conduction band while leaving holes in the valence band. Then NSCDBC transfers the electrons and acts as a carrier for the electrons, inhibiting the complexation of electron–hole pairs. Next, the electrons react with oxygen molecules to produce superoxide radicals and due to their lower valence band cannot drive water molecules to form hydroxyl radicals, but instead photogenerated holes are transferred to the catalyst surface to interact with TC molecules63 This is consistent with the results of radical trapping experiments and ESR tests. Thus, hydroxyl radicals and photogenerated holes interact together with TC molecules as active substances, and eventually, TC is degraded to CO2.
4 Conclusion
In this study, value-added utilization of waste biomass has been achieved by converting cow down into modified biomass char. The N,S co-doped biochar derived from cow dung pyrolysis was used to modify MIL-125(Ti) to achieve a cost-effective composite catalyst. The composite material offers great adsorption performance on TC. The effective linkage of biomass char with MIL-125(Ti) was confirmed by SEM, TEM and XPS analysis and they both existed in the pristine state. NSCM-20 exhibits the best photodegradation performance with a degradation efficiency of 94.62% (TOC removal 84.01%), which is higher than that of MIL-125(Ti), indicating that there is a synergistic effect between NSCDBC and MIL-125(Ti). The proper addition of NSCDBC is significantly beneficial to the photocatalytic process. The porous structure and the transfer of photogenerated carriers are the main reasons for the improved photocatalytic performance. In addition, by radical trapping experiments and ESR, photogenerated holes and superoxide radicals are the main oxidizing substances for degrading TC molecules, and a reasonable explanation of the photocatalytic degradation mechanism is made. Therefore, the NSCDBC/MIL-125(Ti) composite catalyst is a new economic and environmentally friendly high-efficiency photocatalyst for the removal of organic pollutants from the aqueous phase.Data availability
The raw/processed data required to reproduce these findings cannot be shared at this time as the data also forms part of an ongoing study.Author contributions
Zhiwei Liu: writing – original Draft, conceptualization, investigation; Yi Li: formal analysis; Chen Li: data curation; Kunyapat Thummavichai: editing; Chen Feng: methodology; Zhen Li: data curation; Song Liu: validation; Shenghua Zhang: writing – reviewing and editing; Nannan Wang and Yanqiu Zhu: resources, funding acquisition.Conflicts of interest
The authors declared that they have no conflicts of interest to this work.Acknowledgements
This project is supported by National Natural Science Foundation (No. 51972068), Specific Research Project of Guangxi for Research Bases and Talents (No. GuiKe AD19245145), Natural Science Foundation of Guangxi Province (No. 2018GXNSFBA281106 and No. 2021GXNSFBA076003), Guangxi “Bagui” Scholarship Foundation.References
- M. Y. Qi, M. Conte, M. Anpo, Z. R. Tang and Y. J. Xu, Chem. Rev., 2021, 121, 13051–13085 CrossRef CAS PubMed.
- L. Zhang, Y. Wang, Y. Shi and Y. Zhu, Chem. Eng. J., 2022, 447, 137406 CrossRef CAS.
- S. C. Roberts and T. R. Zembower, Lancet Infect. Dis., 2021, 21, 10–11 CrossRef PubMed.
- Y. Shang, X. Xu, B. Gao, S. Wang and X. Duan, Chem. Soc. Rev., 2021, 50, 5281–5322 RSC.
- L. Peng, X. Duan, Y. Shang, B. Gao and X. Xu, Appl. Catal., B, 2021, 287, 119963 CrossRef CAS.
- S. Rodriguez-Mozaz, S. Chamorro, E. Marti, B. Huerta, M. Gros, A. Sanchez-Melsio, C. M. Borrego, D. Barcelo and J. L. Balcazar, Water Res., 2015, 69, 234–242 CrossRef CAS PubMed.
- T. T. Xiao, Z. Tang, Y. Yang, L. Q. Tang, Y. Zhou and Z. G. Zou, Appl. Catal., B, 2018, 220, 417–428 CrossRef CAS.
- A. M. Huizar-Felix, C. Aguilar-Flores, A. Martinez-de-la Cruz, J. M. Barandiaran, S. Sepulveda-Guzman and R. Cruz-Silva, Nanomaterials, 2019, 9, 313 CrossRef CAS PubMed.
- D. Jeong and K. Y. Choi, Appl. Biochem. Microbiol., 2020, 56, 306–312 CrossRef CAS.
- X. Cui, N. Li, G. Chen, H. Zheng and X. Li, J. Colloid Interface Sci., 2019, 534, 490–498 CrossRef CAS PubMed.
- D. H. Bremner, R. Molina, F. Martínez, J. A. Melero and Y. Segura, Appl. Catal., B, 2009, 90, 380–388 CrossRef CAS.
- F. Chen, Q. Yang, X. M. Li, G. M. Zeng, D. B. Wang, C. G. Niu, J. W. Zhao, H. X. An, T. Xie and Y. C. Deng, Appl. Catal., B, 2017, 200, 330–342 CrossRef CAS.
- Z. Shi, Y. Zhang, X. F. Shen, G. Duoerkun, B. Zhu, L. S. Zhang, M. Q. Li and Z. G. Chen, Chem. Eng. J., 2020, 386, 124010 CrossRef CAS.
- M. N. Chong, B. Jin, C. W. Chow and C. Saint, Water Res., 2010, 44, 2997–3027 CrossRef CAS PubMed.
- C. Reyes, J. Fernandez, J. Freer, M. A. Mondaca, C. Zaror, S. Malato and H. D. Mansilla, J. Photochem. Photobiol., A, 2006, 184, 141–146 CrossRef CAS.
- L. B. Jiang, X. Z. Yuan, G. M. Zeng, Z. B. Wu, J. Liang, X. H. Chen, L. J. Leng, H. Wang and H. Wang, Appl. Catal., B, 2018, 221, 715–725 CrossRef CAS.
- L. Yu, Z. Ye, J. Li, C. Ma, C. Ma, X. Liu, H. Wang, L. Tang, P. Huo and Y. Yan, Nano, 2018, 13, 1850065 CrossRef CAS.
- H. Furukawa, K. E. Cordova, M. O'Keeffe and O. M. Yaghi, Science, 2013, 341, 1230444 CrossRef PubMed.
- E. Barea, C. Montoro and J. A. Navarro, Chem. Soc. Rev., 2014, 43, 5419–5430 RSC.
- Z. Chen, K. O. Kirlikovali, P. Li and O. K. Farha, Acc. Chem. Res., 2022, 55, 579–591 CrossRef CAS PubMed.
- I. Luz, F. X. L. I. Xamena and A. Corma, J. Catal., 2012, 285, 285–291 CrossRef CAS.
- D. Farrusseng, S. Aguado and C. Pinel, Angew. Chem., Int. Ed., 2009, 48, 7502–7513 CrossRef CAS PubMed.
- S. Dantas, L. Sarkisov and A. V. Neimark, J. Am. Chem. Soc., 2019, 141, 8397–8401 CrossRef CAS PubMed.
- X. Zhang, Z. Chen, X. Liu, S. L. Hanna, X. Wang, R. Taheri-Ledari, A. Maleki, P. Li and O. K. Farha, Chem. Soc. Rev., 2020, 49, 7406–7427 RSC.
- X. Zhao, X. Song, Y. Li, Z. Chang and L. Chen, ACS Appl. Mater. Interfaces, 2018, 10, 5633–5640 CrossRef CAS PubMed.
- A. J. Howarth, Y. Liu, P. Li, Z. Li, T. C. Wang, J. T. Hupp and O. K. Farha, Nat. Rev. Mater., 2016, 1, 15018 CrossRef CAS.
- M. Dan-Hardi, C. Serre, T. Frot, L. Rozes, G. Maurin, C. Sanchez and G. Ferey, J. Am. Chem. Soc., 2009, 131, 10857–10859 CrossRef CAS PubMed.
- H. Xiao, W. Y. Zhang, Q. S. Yao, L. L. Huang, L. H. Chen, B. Boury and Z. W. Chen, Appl. Catal., B, 2019, 244, 719–731 CrossRef CAS.
- X. Huo, P. Zhou, J. Zhang, Y. Liu, X. Cheng, Y. Liu, W. Li and Y. Zhang, J. Hazard. Mater., 2020, 391, 122055 CrossRef CAS PubMed.
- J. O. Olowoyo, U. Saini, M. Kumar, H. Valdes, H. Singh, M. O. Omorogie, J. O. Babalola, A. V. Vorontsov, U. Kumar and P. G. Smirniotis, J. CO2 Util., 2020, 42, 101300 CrossRef CAS.
- Y. G. Xu, J. Liu, M. Xie, L. Q. Jing, H. Xu, X. J. She, H. M. Li and J. M. Xie, Chem. Eng. J., 2019, 357, 487–497 CrossRef CAS.
- W. Tian, H. Zhang, X. Duan, H. Sun, M. O. Tade, H. M. Ang and S. Wang, ACS Appl. Mater. Interfaces, 2016, 8, 7184–7193 CrossRef CAS PubMed.
- J. Lee, K. H. Kim and E. E. Kwon, Renewable Sustainable Energy Rev., 2017, 77, 70–79 CrossRef CAS.
- W. Gwenzi, N. Chaukura, T. Wenga and M. Mtisi, Sci. Total Environ., 2021, 753, 142249 CrossRef CAS PubMed.
- A. Kumar, Shalini, G. Sharma, M. Naushad, A. Kumar, S. Kalia, C. S. Guo and G. T. Mola, J. Photochem. Photobiol., A, 2017, 337, 118–131 CrossRef CAS.
- L. Meng, W. Yin, S. Wang, X. Wu, J. Hou, W. Yin, K. Feng, Y. S. Ok and X. Wang, Chemosphere, 2020, 239, 124713 CrossRef CAS PubMed.
- V. Makrigianni, A. Giannakas, C. Daikopoulos, Y. Deligiannakis and I. Konstantinou, Appl. Catal., B, 2015, 174, 244–252 CrossRef.
- Z. Chen, Z. He, M. Zhou, M. Xie, T. He, Y. Zhao, X. Chen, Y. Wu and Z. Xu, Chemosphere, 2021, 284, 131260 CrossRef CAS PubMed.
- T. M. Clancy, K. F. Hayes and L. Raskin, Environ. Sci. Technol., 2013, 47, 10799–10812 CrossRef CAS PubMed.
- D. Wan, L. Wu, Y. Liu, H. Zhao, J. Fu and S. Xiao, Sci. Total Environ., 2018, 636, 1396–1407 CrossRef CAS PubMed.
- G. Kharel, O. Sacko, X. Feng, J. R. Morris, C. L. Phillips, K. Trippe, S. Kumar and J. W. Lee, ACS Sustainable Chem. Eng., 2019, 7, 16410–16418 CrossRef CAS.
- Q. C. Chen, J. L. Qin, P. Sun, Z. W. Cheng and G. Q. Shen, J. Cleaner Prod., 2018, 172, 2009–2018 CrossRef CAS.
- Q. Chen, J. Qin, Z. Cheng, L. Huang, P. Sun, L. Chen and G. Shen, Chemosphere, 2018, 199, 402–408 CrossRef CAS PubMed.
- J. Qin, Y. Cheng, M. Sun, L. Yan and G. Shen, Sci. Total Environ., 2016, 569–570, 1–8 CrossRef CAS PubMed.
- C. H. Hendon, D. Tiana, M. Fontecave, C. Sanchez, L. D'Arras, C. Sassoye, L. Rozes, C. Mellot-Draznieks and A. Walsh, J. Am. Chem. Soc., 2013, 135, 10942–10945 CrossRef CAS PubMed.
- M. A. Nasalevich, M. G. Goesten, T. J. Savenije, F. Kapteijn and J. Gascon, Chem. Commun., 2015, 51, 961–962 RSC.
- P. Lisowski, J. C. Colmenares, O. Masek, W. Lisowski, D. Lisovytskiy, A. Kaminska and D. Lomot, ACS Sustainable Chem. Eng., 2017, 5, 6274–6287 CrossRef CAS.
- S. N. Kim, J. Kim, H. Y. Kim, H. Y. Cho and W. S. Ahn, Catal. Today, 2013, 204, 85–93 CrossRef CAS.
- Y. He, S. Luo, X. Hu, Y. Cheng, Y. Huang, S. Chen, M. Fu, Y. Jia and X. Liu, Chem. Eng. J., 2021, 420, 127643 CrossRef CAS.
- F. Buckel, F. Effenberger, C. Yan, A. Golzhauser and M. Grunze, Adv. Mater., 2000, 12, 901–905 CrossRef CAS.
- Y. Wang, Y. Shao, D. W. Matson, J. Li and Y. Lin, ACS Nano, 2010, 4, 1790–1798 CrossRef CAS PubMed.
- S. B. Yang, L. J. Zhi, K. Tang, X. L. Feng, J. Maier and K. Mullen, Adv. Funct. Mater., 2012, 22, 3634–3640 CrossRef CAS.
- H. Wang, X. Z. Yuan, Y. Wu, G. M. Zeng, X. H. Chen, L. J. Leng and H. Li, Appl. Catal., B, 2015, 174, 445–454 CrossRef.
- X. D. Jiang, Y. P. Zhang, J. Jiang, Y. S. Rong, Y. C. Wang, Y. C. Wu and C. X. Pan, J. Phys. Chem. C, 2012, 116, 22619–22624 CrossRef CAS.
- L. Z. Huang and B. S. Liu, RSC Adv., 2016, 6, 17873–17879 RSC.
- Z. Y. Wu, X. B. Huang, H. Y. Zheng, P. Wang, G. T. Hai, W. J. Dong and G. Wang, Appl. Catal., B, 2018, 224, 479–487 CrossRef CAS.
- J. Yu, S. Wang, J. Low and W. Xiao, Phys. Chem. Chem. Phys., 2013, 15, 16883–16890 RSC.
- L. Lu, R. Shan, Y. Shi, S. Wang and H. Yuan, Chemosphere, 2019, 222, 391–398 CrossRef CAS PubMed.
- H. Eskandarloo, A. Badiei, M. A. Behnajady, A. Tavakoli and G. M. Ziarani, Ultrason. Sonochem., 2016, 29, 258–269 CrossRef CAS PubMed.
- J. Di, J. X. Xia, S. Yin, H. Xu, L. Xu, Y. G. Xu, M. Q. He and H. M. Li, J. Mater. Chem. A, 2014, 2, 5340–5351 RSC.
- B. Qiu, M. Xing and J. Zhang, Chem. Soc. Rev., 2018, 47, 2165–2216 RSC.
- X. He, M. Wu, Z. Ao, B. Lai, Y. Zhou, T. An and S. Wang, J. Hazard. Mater., 2021, 403, 124048 CrossRef CAS PubMed.
- X. Song, Y. Wang, T. Zhu, J. Liu and S. Zhang, Chem. Eng. J., 2021, 416, 129126 CrossRef CAS.
Footnote |
| † Electronic supplementary information (ESI) available. See DOI: https://doi.org/10.1039/d2ra05819g |
| This journal is © The Royal Society of Chemistry 2022 |

