 Open Access Article
Co,N-doped carbon sheets prepared by a facile method as high-efficiency oxygen reduction catalysts†
Wei Zhang,
Supeng Pei *,
Kangwei Xu,
Zhiyue Han,
Jialu Ma,
Yingge Zhang,
Guipeng Liu and
Xiaojun Xu
School of Chemical and Environmental Engineering, Shanghai Institute of Technology, Shanghai 201418, China. E-mail: peisupeng@126.com
First published on 28th November 2022
Abstract
Transition metal and nitrogen codoped carbon materials have emerged as one of the most promising candidates to replace noble metal-based oxygen reduction reaction (ORR) catalysts. However, the development of high-efficiency, stable and low-cost metal–nitrogen–carbon catalysts still remains a challenge. In this study, cobalt and nitrogen codoped carbon sheet catalysts were successfully prepared by a simple self-injected vapor phase growth and template method. The catalysts exhibited a multilevel pore structure with a large specific surface area and resulting physical characteristics. The catalysts have excellent onset and half-wave potentials during the ORR. Notably, the onset (E0) and half-wave potential (E1/2) in alkaline media for the Co-N-C-43.8 catalyst are 31 mV and 3 mV higher than those of a commercial Pt/C catalyst, respectively. Moreover, the durability of the Co-N-C-43.8 catalyst remains at a 93% current density after 10![[thin space (1/6-em)]](https://www.rsc.org/images/entities/char_2009.gif) 000 s, while that of a commercial Pt/C catalyst only remains at 83%. Also, the Co-N-C-43.8 catalyst has little change in the current density after the addition of methanol. These results indicate that the Co,N-doped carbon sheet is a promising ORR catalyst.
000 s, while that of a commercial Pt/C catalyst only remains at 83%. Also, the Co-N-C-43.8 catalyst has little change in the current density after the addition of methanol. These results indicate that the Co,N-doped carbon sheet is a promising ORR catalyst.
1 Introduction
Many efforts are being made towards modifying the existing energy structure because of the double crisis of energy depletion and environmental pollution. Hydrogen energy as a clean energy source has attracted much attention due to its high efficiency and environmental friendliness. Specifically, the fuel cell is regarded as an important form of hydrogen energy application. Oxygen reduction reaction (ORR) electrocatalysts are pivotal components of the fuel cell and play a key role in the performance and lifetime. Platinum-based catalysts are considered to be one of the best electrocatalysts for oxygen reduction and are used extensively. For example, platinum-based nanowire electrocatalysts prepared with a carbon support modified by graphite carbon nitride and noble metal nanocatalysts synthesized by ligands show excellent electrocatalytic activity.1–4 However, the scarcity and high price may limit its large-scale implementation.5 In addition, ORR catalysts face other challenges, such as insufficient long-term stability and CO deactivation.6–9 As a result, the synthesis of a high activity, superior durability and low-cost ORR catalysts is of great importance.10–15 Due to the low preparation cost and excellent electrochemical characteristics, transition metal and nitrogen codoped carbon catalysts have been shown to be viable non-precious metal catalysts for the ORR process.16–21The specific surface area and porous structure of catalysts are essential factors in determining catalyst performance. More active sites are generated by a large specific surface area and a graded porous structure, which can significantly boost catalytic activity.22–25 Due to the large specific surface area, high porosity, and superior electrical conductivity, porous carbon sheets have been employed as new carbon material. Meanwhile, they are also considered to have promising prospects in a variety of industries, including lithium batteries, supercapacitors, and sodium-ion batteries.26–31 The construction of porous carbon sheets through template synthesis32–34 and biomass carbonization35,36 has been widely reported. For example, silica is often used as a hard template to construct porous frames, followed by the impregnation of carbon precursors, carbonization and template removal.37,38 This process is time-consuming and cumbersome in a way. Additionally, the biomass carbonization usually requires suitable precursors (e.g., catkins,35 silk,39 and pistachio shells40). The composition of the biomass precursors is often complex, which may have the potential to affect their performance.
Herein, a simple and effective transition metal and nitrogen codoped carbon material was developed in this work. As shown in Scheme 1, the codoped carbon sheet catalysts were successfully prepared with lactose as the carbon source, zinc nitrate as the template, and cobalt nitrate as the Co source and the nitrogen source by combining self-ejecting gas phase growth and a template method. Thanks to the unique design of the self-ejection-vapor phase growth and template method, the Co-N-C co-doped carbon sheet catalyst obtained in this work has high specific surface area (841 m2 g−1), abundant pores/channels, and a high nitrogen content. The Co-N-C samples show an excellent electrochemical performance when they are applied to the oxygen reduction reaction.
2 Experimental section
2.1 Materials
The main raw materials for this experiment are lactose monohydrate (MW ∼ 360 g mol−1), cobalt nitrate hexahydrate, zinc nitrate hexahydrate, hydrochloric acid and anhydrous ethanol. All the materials were purchased from the Sinopharm Chemical Reagent Co., Ltd. All reagents were of analytical grade. None of the chemical reagents underwent any purification treatment.2.2 Preparation of cobalt and nitrogen codoped carbon sheet catalysts
Cobalt and nitrogen codoped carbon sheet catalysts were prepared by using a mix of self-injected vapor phase growth and a template approach. In a typical process, one gram of lactose monohydrate, 0.5 g of zinc nitrate hexahydrate, and 43.8 mg of cobalt nitrate hexahydrate were dissolved in 5 mL of deionized water and thoroughly mixed until no visible suspended particles were observed. Then, the samples were placed in a blast drying oven, quickly heated to 220 °C and held for 30 minutes. The collected samples were placed in ceramic boats, calcined in a nitrogen environment at a heating rate of 2 °C min−1 to 900 °C, maintained for 120 minutes. After cooling down to room temperature, the resulting carbon samples were immersed in dilute hydrochloric acid (1 M) for 24 hours and then washed several times with deionized water and ethanol. Finally, the final catalyst was obtained by drying at 60 °C for 12 h and named as Co-N-C-43.8. Four other catalyst samples were prepared by adding different masses of cobalt nitrate hexahydrate, with the other conditions unchanged, were used for comparison. They were designated as N-C (no cobalt nitrate hexahydrate), Co-N-C-21.9 (21.9 mg of cobalt nitrate hexahydrate), Co-N-C-65.7 (65.7 mg of cobalt nitrate hexahydrate), and Co-N-C-87.6 (87.6 mg of cobalt nitrate hexahydrate). The catalyst preparation is indicated in Scheme 1.2.3 Physical characteristics
A scanning electron microscope (SEM, JEOL2100F, Japan) was used to examine the appearance of all of the manufactured catalysts. The phase composition of all the samples was analyzed by X-ray diffraction (XRD, Bruker, German, APLX-DUO) with Cu Kα radiation (λ = 1.5418 Å) over a working voltage of 40 kV and a current of 40 mA. The chemical properties of the catalyst surface were analyzed by X-ray photoelectron spectroscopy (XPS) on an AXIS Ultra DLD X-ray photoelectron spectroscopy system with Al Kα radiation as the excitation source. On a 532 nm excitation laser, Raman spectra were obtained with Thermo Fisher H31XYZE-US. The degree of graphitization and destruction of the catalyst samples could be analyzed by Raman spectroscopy. The specific surface area of the catalyst sample was measured on an ASAP-2460 by the Brunauer–Emmett–Teller (BET) method, and the pore size distribution of the catalyst sample was assessed using the Barrett–Joyner–Halenda (BJH) model to provide nitrogen adsorption desorption isotherms.2.4 Electrochemical measurements
All of the electrochemical measurements were carried out using an Autolab PGSTAT302 (Metrohm) electrochemical workstation with a three-electrode configuration. Among them, a glassy carbon (GC) electrode, used to adhere to the catalyst sample, was used as the working electrode, platinum wire was used as the counter electrode, and Ag/AgCl (3.0 M KCl) was used as the reference electrode. The electrocatalyst ink was prepared by ultrasonically dispersing 1.0 mg of electrocatalyst powder in a mixture consisting of 10.0 μL of Nafion solution as the binder and 200.0 μL of ethanol and deionized water as the dispersant for 30 min. After that, 4 μL of catalyst ink was applied to the working electrode and allowed to dry in the air.Cyclic voltammetry (CV) and linear sweep voltammetry (LSV) were tested in 0.1 M KOH aqueous solution. The LSV rotating speed ranged from 400 to 2000 rpm with a scan rate of 10 mV s−1. The chronoamperometry and methanol tolerance (3 M CH3OH) experiments were tested under −0.35 V (vs. Ag/AgCL) at 1600 rpm.
The electron transfer number (n) was calculated by the Koutecky–Levich (K–L) equation:
| 1/J = 1/JL + 1/JK = 1/(Bω1/2) + 1/JK | (1) |
| JK = nFKfC0 | (2) |
| B = 0.2nFC0(D0)2/3ν−1/6Jk = nFkC0 | (3) |
In the formula, J is the current density obtained from the linear voltammetry test, and JK and JL are the kinetic current density and the limiting current density, respectively. ω is the angular velocity of the rotating disk electrode (rpm), n is the number of electron transfers, F is the Faraday constant (96![[thin space (1/6-em)]](https://www.rsc.org/images/entities/char_2009.gif) 485 C mol−1), C0 is the volume concentration of oxygen (1.2 × 10⁻⁶ mol cm−3), D0 is oxygen in the electrolyte (1.9 × 105 cm2 s−1), ν is the viscosity coefficient of the electrolyte (0.01 cm2 s−1) and k is the electron conversion rate constant. When the unit of rotation speed is rpm, a coefficient of 0.2 is adopted. Moreover, rotating ring-disk electrode (RRDE) of the catalyst was performed at 1600 rpm in 0.1 M KOH medium, the value of n and H2O2 yield could be determined according the following equations:
485 C mol−1), C0 is the volume concentration of oxygen (1.2 × 10⁻⁶ mol cm−3), D0 is oxygen in the electrolyte (1.9 × 105 cm2 s−1), ν is the viscosity coefficient of the electrolyte (0.01 cm2 s−1) and k is the electron conversion rate constant. When the unit of rotation speed is rpm, a coefficient of 0.2 is adopted. Moreover, rotating ring-disk electrode (RRDE) of the catalyst was performed at 1600 rpm in 0.1 M KOH medium, the value of n and H2O2 yield could be determined according the following equations:
| H2O2% = 100 × (2 × Ir/N)/(Id + Ir/N) | (4) |
| n = 4 × Id/(Id + Ir/N) | (5) |
3 Results and discussion
The surface morphologies of the five samples by SEM are illustrated in Fig. 1. It can be clearly seen from Fig. 1a and b that the synthesized N-C samples exhibit a layered sheet structure with a small thickness, smooth surface and interconnected holes between the layers. The catalyst sample in Fig. 1c–f has a sheet structure. In addition, it can be seen from the SEM cross section (Fig. S1†) that the samples present a fluffy and porous structure, which will provide more effective active sites and facilitate the oxygen reduction catalytic performance of the catalysts.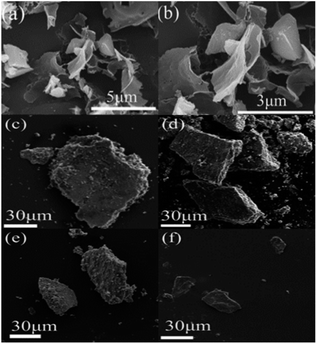 | ||
| Fig. 1 SEM images of N-C (a, b), Co-N-C-21.9 (c), Co-N-C-43.8 (d), Co-N-C-65.7 (e), and Co-N-C-87.6 (f). | ||
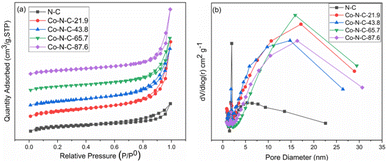
A nitrogen adsorption and desorption test was used to determine the specific surface area and pore size distribution of the catalysts. According to the nitrogen adsorption and desorption curves (Fig. 2a), the catalyst samples belong to the typical type IV group, which proves that the Co-N-C catalyst has an obvious mesoporous structure. Based on the Barrett–Joyner–Helenda (BJH) method and from the pore size distribution curve (Fig. 2b), it can be seen that the N-C catalyst is mainly concentrated in the small size range of 1.9 nm to 5.5 nm, with an average pore size of 4.6 nm. However, the pore size of the samples become significantly larger with the introduction of cobalt. The average pore size of the Co-N-C-43.8 catalyst is 6.6 nm, and there is an obvious response near 15 nm. This transition may be the result of the synergistic etching of zinc oxide and cobalt oxide by HCl.41,42 The presence of these mesoporous structures facilitates the contact between the oxygen molecules and electrolytes and promotes the oxygen reduction reaction.43–46 Furthermore, due to the presence of pore channels, all six samples have large specific surface areas. According to the Brunauer–Emmett–Teller isotherm equation, the specific surface areas of N-C, Co-N-C-21.9, Co-N-C-43.8, Co-N-C-65.7, and Co-N-C-87.6 are 850 m2 g−1, 841 m2 g−1, 599 m2 g−1, 532 m2 g−1, and 531 m2 g−1, respectively. The mesopores and large specific surface area increase the number of accessible active sites and make oxygen reduction easier.
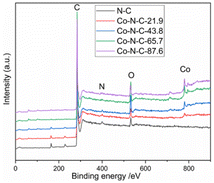
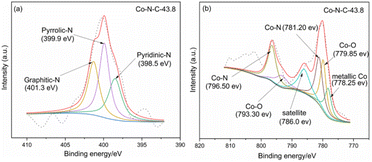
XPS was used to characterize the amount and type of cobalt and nitrogen in the five catalysts. Fig. 3 and ESI (see Table S1 and Fig. S2†) show the XPS results for Co-N-C-43.8 and other samples. As shown in Fig. 3, the C, N and O peaks are shown for all five samples, and Co peaks can also be found in the Co-N-C samples, demonstrating the Co was successfully doped into the catalyst. The contents of C, N, O, and Co of the five samples are shown in Table S1 (see ESI†). The results of nitrogen deconvolution are shown in Fig. 4a and S2b, d, f, g.† It can be seen that N 1s is divided into three peaks, which correspond to pyridine nitrogen (398.5 eV), pyrrole nitrogen (399.9 eV) and graphite nitrogen (401.3 eV), respectively.47 From Fig. 4b and S2a, c, e,† it can also be seen that Co 2p is divided into six peaks at 793.30 eV, 778.25 eV, 796.50 eV, 781.2 eV, 786.0 eV and 779.85 eV, which result from the deconvolution of Co 2p1/2 and Co 2p3/2. Furthermore, the peak at 778.25 eV is metal cobalt, the double peaks at 779.85/793.30 eV and 781.2/796.50 eV belong to the Co-O and Co-N bonds, respectively, and the satellite peak is 786.0 eV.48,49 Their contents are listed in Table S2 (see ESI†). Among the different forms of nitrogen, pyridine nitrogen has been identified as a highly electrically active site, while graphite nitrogen favors the formation of Co-Nx, which has also been demonstrated to be the active site for catalytic activities.50 According to the different types of N and Co contents (Table S2 in ESI†), Co-N-C-43.8 has a higher proportion of pyridine and graphite nitrogen, with an overall content of pyridine and graphite nitrogen of 3.17% × (28.95% + 31.31%) = 1.9%, slightly higher than those of Co-N-C-21.9 (0.8%), Co-N-C-65.7 (1.4%) and Co-N-C-87.6 (1.6%). In addition, the Co-NC-43.8 sample had the highest relative content of Co-O bonds and Co-N bonds, which are the active sites of the ORR. The results indicated that Co-N-C-43.8 sample could be a good catalyst for the ORR.
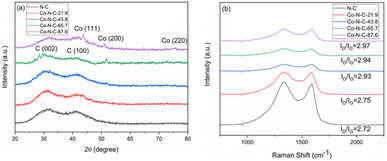
XRD was used to characterize the structure of the catalyst samples. The XRD pattern of catalysts is shown in Fig. 5a. As seen from the figure, the catalyst samples exhibit distinct broadening peaks at approximately 2θ = 30.2° and 41.8°, which correspond to the (002) and (100) crystallographic planes of amorphous carbon, respectively.51,52 With an increase of metal content, the characteristic diffraction peak of metal Co became more and more obvious. The characteristic diffraction peak corresponding to the crystal plane of Co(200) appears at 51.5° for Co-N-C-65.7 and Co-NC-87.6. In addition, two other peaks of cobalt appear at 44.2°, and 75.8° for Co-NC-87.6. The two peaks are attributed to Co(111) and Co(220), respectively, by comparing the XRD standard card PDF#15-0806.53 However, there is no obvious Co diffraction peak in the Co-N-C-21.7 and Co-N-C-43.8 samples, which may be mainly related to the low content of metal or a good dispersion in the samples. Raman spectroscopy can usually characterize the graphitization degree or defect degree of carbon. It can be seen that the two main peaks appeared at 1340 cm−1 and 1590 cm−1 for the catalyst samples (Fig. 5b). The two peaks around 1340 and 1590 cm−1 represent the D band (originating from the edge or defect site of the carbon) and G band (originating from the E2g form of the sp2 carbon), respectively.54 The Raman ratios (ID/IG) of the five samples are 2.72, 2.75, 2.93, 2.94 and 2.97. Higher ID/IG ratios suggest more flaws in the graphitization plane, which corresponds to the amorphous carbon XRD results. These flaws encourage the formation of more active sites, making the oxygen reduction reaction easier.
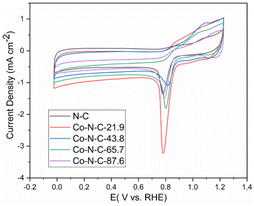
The electrochemical performance for oxygen reduction was studied, and the cyclic voltammetric curves of the catalysts in a 0.1 M KOH solution are shown in Fig. 6. As shown in the picture, the peak values of N-C, Co-N-C-21.9, Co-N-C-43.8, Co-N-C-65.7, and Co-N-C-87.6 are 0.778 V, 0.781 V, 0.821 V, 0.794 V, and 0.791 V, respectively. The CV curve of the Co-N-C-43.8 sample shows the maximum oxygen reduction peak among the five samples. This may be caused by a suitable metal activity content and better structure.
The kinetics of the catalytic oxygen reduction can be studied using linear voltammetry. In a 0.1 M KOH solution, the five catalyst samples and commercial Pt/C catalysts were tested, and the results are given in Fig. 7 and S3 (see ESI†). The plots can be used to compute the number of electron transfers in the alkaline solutions and thus determine the oxygen reduction products. The K–L equation can be used to calculate the onset potential, half-wave potential, and limiting current density of the catalysts. The oxygen reduction kinetic parameters of the catalysts are listed in Table S3 (see ESI†). The oxygen reduction kinetic performance of the catalysts increases and then decreases with increasing cobalt content, indicating that doping with an appropriate amount of cobalt is favorable for improving the catalyst performance. Furthermore, the Co-N-C-43.8 catalyst has a higher onset potential, half-wave potential and limiting current density than those of the other Co-N-C catalysts. Especially, the onset potential of Co-N-C-43.8 is 31 mV higher than that of commercial Pt/C and the half-wave potential is 3 mV higher than that of commercial Pt/C. The electron transfer number of the catalysts are shown Fig. S4 and Table S3 (see ESI†). It can be seen that the Co-N-C 43.8 catalyst has an electron transfer number of 4.3, which indicates the reaction follows a near four-electron transfer pathway. In addition to calculating the apparent electron transfer number from the K–L equation, the RRDE can also be used to determine whether the ORR is a 4e− process or a 2e− process by measuring the yield of H2O2 in the ORR process. As shown in Fig. 8, the hydrogen peroxide yield and electron transfer number of the five catalysts were calculated by the RRDE curve. It can be found that the electron transfer number of the Co-N-C-43.8 sample in the whole potential range is the highest (3.75), close to 4, and the hydrogen peroxide yield is the lowest. This indicates that the Co-N-C-43.8 sample has an excellent catalytic performance for ORR, and the catalytic process is an efficient direct 4e− process. The electrochemical impedance spectra of the electrodes prepared with N-C, Co-N-C-21.9, Co-N-C-43.8, Co-N-C-65.7 and Co-N-C-87.6 are shown in Fig. S5 (see ESI†). The low internal resistance values of the Co-N-C-43.8 sample (Table S4, ESI†) indicate that the electrode has a good electrical conductivity. By comparing the ORR performance of Co-NC-43.8 and some nonprecious metal catalysts in alkaline solutions, as listed in Table 1, it can be seen that the Co-N-C-43.8 catalyst synthesized in this work has a higher onset potential (0.99 V vs. RHE) and limit current density (5.80 mA cm−2) than those of other catalysts. Meanwhile, compared with the bimetallic FeCo-Co/NC and Ag/Co-NC-30, the Co-N-C-43.8 prepared in this work exhibits a simpler preparation process.
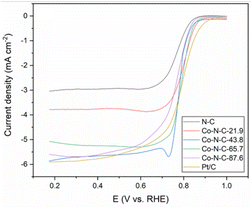 | ||
| Fig. 7 LSV curves of the five catalyst samples and Pt/C in O2-saturated 0.1 M KOH with a scan rate of 10 mV s−1. | ||
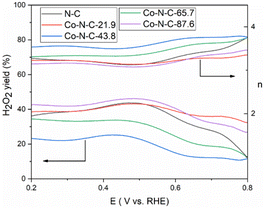 | ||
| Fig. 8 H2O2 yield and the number of transferred electrons n of the five catalysts in O2-saturated 0.1 M KOH with a scan rate of 10 mV s−1. | ||
| Sample | Onset potential (V vs. RHE) | Half-wave potential (V vs. RHE) | Limited current density (mA cm−2) | Ref. |
|---|---|---|---|---|
| a Ag/AgCl potential is converted to RHE using the following Nernst equation. E (vs. RHE) = EAg/AgCl + pH × 0.059 + 0.210. | ||||
| Co-N-C-43.8 | 0.99 | 0.800 | 5.80 | This work |
| FeCo-Co/NC | 0.93 | 0.808 | 4.94 | 55 |
| Co@NC/RGO-2.6 | 0.96 | 0.820 | 5.60 | 56 |
| Co-N/PC@C NT-700 | 0.92 | 0.790 | 4.50 | 57 |
| Ag/Co-NC-30 | 0.88 | 0.800 | 4.94 | 58 |
| Co@MPC-800 | 0.89 | 0.796 | 5.49 | 59 |
I–t tests were performed on the Co-N-C samples to assess their stability and methanol tolerance. The durability and methanol tolerance test plots for the catalyst samples and commercial Pt/C catalysts are shown in Fig. 9 and S6 (see ESI†). Based on the results in Fig. 9a, it can be seen that the N-C, Co-N-C-21.9, Co-N-C-43.8, Co-N-C-65.7, Co-N-C-87.6 and commercial Pt/C catalysts all underwent 10![[thin space (1/6-em)]](https://www.rsc.org/images/entities/char_2009.gif) 000 s durability tests with residual current density percentages of 66%, 77%, 93%, 89%, 84% and 83%. In addition, ae 20
000 s durability tests with residual current density percentages of 66%, 77%, 93%, 89%, 84% and 83%. In addition, ae 20![[thin space (1/6-em)]](https://www.rsc.org/images/entities/char_2009.gif) 000 s durability test of the Co-N-C-43.8 was carried out and the result is shown in Fig. S7.† It can be seen that the percentage of residual current density of the catalyst is 88.3% and the attenuation trend of the current density is not obvious, which indicates that Co-N-C-43.8 maintains a good catalytic stability. The methanol tolerance test plots for the five catalyst samples and the commercial Pt/C catalyst are shown in Fig. 9b and S6 (see ESI†). As can be seen from the figure, after methanol was added at 500 s, the current density of commercial Pt/C decreased sharply, while the current density of the Co-N-C catalyst did not change significantly. In particular, the residual percentage of current density of Co-NC-43.8 catalyst in alkaline medium was 97%, which was better than that of commercial Pt/C (86%). These results indicate that the Co-N-C catalysts, especially the Co-N-C-43.8 sample, has excellent stability and methanol tolerance in an alkaline medium.
000 s durability test of the Co-N-C-43.8 was carried out and the result is shown in Fig. S7.† It can be seen that the percentage of residual current density of the catalyst is 88.3% and the attenuation trend of the current density is not obvious, which indicates that Co-N-C-43.8 maintains a good catalytic stability. The methanol tolerance test plots for the five catalyst samples and the commercial Pt/C catalyst are shown in Fig. 9b and S6 (see ESI†). As can be seen from the figure, after methanol was added at 500 s, the current density of commercial Pt/C decreased sharply, while the current density of the Co-N-C catalyst did not change significantly. In particular, the residual percentage of current density of Co-NC-43.8 catalyst in alkaline medium was 97%, which was better than that of commercial Pt/C (86%). These results indicate that the Co-N-C catalysts, especially the Co-N-C-43.8 sample, has excellent stability and methanol tolerance in an alkaline medium.
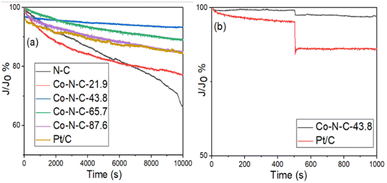 | ||
| Fig. 9 (a) Chronoamperometric responses of the five catalyst samples in O2-saturated 0.1 M KOH and (b) chronoamperometric responses of Co-N-C-43.8 and Pt/C with 3 M methanol. | ||
4 Conclusions
In conclusion, a simple and effective pore production strategy combining self-injected vapor phase growth with a template method has been effectively used to generate cobalt–nitrogen codoped carbon sheet catalysts. By changing the cobalt percentage, a variety of cobalt–nitrogen codoped carbon sheet catalysts were prepared. The impact of variation in the cobalt content on the shape and electrochemical characteristics of the catalysts was also examined. According to the test results, the Co-N-C-43.8 catalyst has a larger specific surface area and better ORR catalytic performance. Compared with a commercial Pt/C catalyst, it offers a better onset potential and half-wave potential. At the same time, it exhibits a superior stability and methanol tolerance compared with those of commercial Pt/C. As a result, this work not only provides a prospective ORR catalyst but also provides a facile method to design and synthesis metal–nitrogen–carbon catalysts.Conflicts of interest
The authors declare that they have no competing interests.Acknowledgements
This project was financially supported by the State Key Laboratory of Fluorinated Functional Membrane Materials.References
- L. F. Lu, H. Zheng, Y. X. Li, Y. H. Zhou and B. Z. Fang, Chem. Eng. J., 2023, 451, 138668 CrossRef CAS.
- L. F. Lu, S. H. Zou and B. Z. Fang, ACS Catal., 2021, 11, 6020–6058 CrossRef CAS.
- B. Z. Fang, L. Daniel, A. Bonakdarpour, R. Govindarajan, J. Sharman and D. P. Wilkinson, Small, 2021, 17, 2102288 CrossRef CAS PubMed.
- G. F. Liao, C. X. Li, X. Z. Li and B. Z. Fang, Cell Rep. Phys. Sci., 2021, 2, 100355 CrossRef CAS.
- C. Sealy, Mater. Today, 2008, 11, 65–68 CrossRef CAS.
- K. Gong, F. Du, Z. Xia, M. Durstock and L. Dai, Science, 2009, 323, 760–764 CrossRef CAS PubMed.
- M. Winter and R. J. Brodd, Chem. Rev., 2004, 104, 4245–4270 CrossRef CAS PubMed.
- P. Thiel, M. Kaiser and C. Ottmann, Angew. Chem., Int. Ed., 2012, 51, 2012–2018 CrossRef CAS PubMed.
- X. Tian, X. F. Lu, B. Y. Xia and X. W. Lou, Joule, 2020, 4, 45–68 CrossRef CAS.
- Z. Zhu, H. Yin, Y. Wang, C. H. Chuang, L. Xing, M. Dong, Y. R. Lu, G. Casillas-Garcia, Y. Zheng, S. Chen, Y. Dou, P. Liu, Q. Cheng and H. Zhao, Adv. Mater., 2020, 32, 2004670 CrossRef CAS PubMed.
- D. S. Su, J. Zhang, B. Frank, A. Thomas, X. Wang, J. Paraknowitsch and R. Schlögl, ChemSusChem, 2010, 3, 169–180 CrossRef CAS PubMed.
- L. Li, Y. Li, R. Huang, X. Cao and Y. Wen, ChemCatChem, 2021, 13, 4645–4651 CrossRef CAS.
- Y. Cheng, S. He, S. F. Lu, J. P. Veder, B. Johannessen, L. Thomsen, M. Saunders, T. Becker, R. De Marco, Q. F. Li, S. Z. Yang and S. P. Jiang, Adv. Sci., 2019, 6, 1802066 CrossRef PubMed.
- C. Z. Zhu, H. Li, S. F. Fu, D. Du and Y. H. Lin, Chem. Soc. Rev., 2016, 45, 517–531 RSC.
- Z. Yang, H. G. Nie, X. Chen, X. H. Chen and S. M. Huang, J. Power Sources, 2013, 236, 238–249 CrossRef CAS.
- S. Roy, Trans. IMF, 2019, 97, 280–281 CrossRef CAS.
- G. Wu, K. L. More, C. M. Johnston and P. Zelenay, Science, 2011, 332, 443–447 CrossRef CAS PubMed.
- X. L. Zhao, X. X. Yang, M. Y. Wang, S. Hwang, S. Karakalos, M. J. Chen, Z. Qiao, L. Wang, B. Liu, Q. Ma, D. A. Cullen, D. Su, H. P. Yang, H. Y. Zang, Z. X. Feng and G. Wu, Appl. Catal., B, 2020, 279, 119400 CrossRef CAS.
- Y. X. Wang, H. Y. Su, Y. H. He, L. G. Li, S. Q. Zhu, H. Shen, P. F. Xie, X. B. Fu, G. Y. Zhou, C. Feng, D. K. Zhao, F. Xiao, X. J. Zhu, Y. C. Zeng, M. H. Shao, S. W. Chen, G. Wu, J. Zeng and C. Wang, Chem. Rev., 2020, 120, 12217–12314 CrossRef CAS PubMed.
- J. F. Sun, Q. Q. Xu, J. L. Qi, D. Zhou, H. Y. Zhu and J. Z. Yin, ACS Sustainable Chem. Eng., 2020, 8, 14630–14656 CrossRef CAS.
- H. G. Zhang, H. T. Chung, D. A. Cullen, S. Wagner, U. I. Kramm, K. L. More, P. Zelenay and G. Wu, Energy Environ. Sci., 2019, 12, 11 Search PubMed.
- P. Du, X. Xiao, F. Ma, H. Wang, J. Shen, F. Lyu, Y. Chen, J. Lu and Y. Li, ACS Appl. Nano Mater., 2020, 3, 5637–5644 CrossRef CAS.
- Z. Wang, K. Wang, Y. Wang, S. Wang, Z. Chen, J. Chen and J. Fu, Nanoscale, 2019, 11, 8785–8797 RSC.
- P. Wu, S. Yu, M. Feng, H. Liu, S. Liu and J. Fu, Appl. Surf. Sci., 2021, 567, 150875 CrossRef CAS.
- X. Zheng, X. Cao, K. Zeng, J. Yan, Z. Sun, M. H. Rummeli and R. Yang, Small, 2021, 17, 2006183 CrossRef CAS PubMed.
- H. J. Niu, L. Zhang, J. J. Feng, Q. L. Zhang, H. Huang and A. J. Wang, J. Colloid Interface Sci., 2019, 552, 744–751 CrossRef CAS PubMed.
- J. T. Zhang, M. Zhang, Y. Zeng, J. S. Chen, L. X. Qiu, H. Zhou, C. J. Sun, Y. Yu, C. Z. Zhu and Z. H. Zhu, Small, 2019, 15, 1900307 CrossRef PubMed.
- H. Park, S. Oh, S. Lee, S. Choi and M. Oh, Appl. Catal., B, 2019, 246, 322–329 CrossRef CAS.
- Z. K. Yang, Y. Wang, M. Z. Zhu, Z. J. Li, W. X. Chen, W. C. Wei, T. W. Yuan, Y. T. Qu, Q. Xu, C. M. Zhao, X. Wang, P. Li, Y. F. Li, Y. Wu and Y. D. Li, ACS Catal., 2019, 9, 2158–2163 CrossRef CAS.
- H. Jiang, J. X. Gu, X. S. Zheng, M. Liu, X. Q. Qiu, L. B. Wang, W. Z. Li, Z. F. Chen, X. B. Ji and J. Li, Energy Environ. Sci., 2019, 12, 322–333 RSC.
- W. J. Zang, A. Sumboja, Y. Y. Ma, H. Zhang, Y. Wu, S. S. Wu, H. J. Wu, Z. L. Liu, C. Guan, J. Wang and S. J. Pennycook, ACS Catal., 2018, 8, 8961–8969 CrossRef CAS.
- Z.-Y. Jin, A.-H. Lu, Y.-Y. Xu, J.-T. Zhang and W.-C. Li, Adv. Mater., 2014, 26, 3700–3705 CrossRef CAS PubMed.
- X. Zhuang, F. Zhang, D. Wu and X. Feng, Adv. Mater., 2014, 26, 3081–3086 CrossRef CAS PubMed.
- Z. Fan, Y. Liu, J. Yan, G. Ning, Q. Wang, T. Wei, L. Zhi and F. Wei, Adv. Energy Mater., 2012, 2, 419–424 CrossRef CAS.
- Y. Li, G. Wang, T. Wei, Z. Fan and P. Yan, Nano Energy, 2016, 19, 165–175 CrossRef CAS.
- B. Liu, Y. Liu, H. Chen, M. Yang and H. Li, J. Power Sources, 2017, 341, 309–317 CrossRef CAS.
- Q. Wang, J. Yan, T. Wei, J. Feng, Y. Ren, Z. Fan, M. Zhang and X. Jing, Carbon, 2013, 60, 481–487 CrossRef CAS.
- J. Yang, Y.-X. Wang, S.-L. Chou, R. Zhang, Y. Xu, J. Fan, W.-x. Zhang, H. K. Liu, D. Zhao and S. X. Dou, Nano Energy, 2015, 18, 133–142 CrossRef CAS.
- J. Hou, C. Cao, F. Idrees and X. Ma, ACS Nano, 2015, 9, 2556–2564 CrossRef CAS PubMed.
- J. Xu, Q. Gao, Y. Zhang, Y. Tan, W. Tian, L. Zhu and L. Jiang, Sci. Rep., 2014, 4, 5545 CrossRef CAS PubMed.
- P. Du, X. Xiao, F. Ma, H. Wang, J. Shen, F. Lyu, Y. Chen, J. Lu and Y. Li, ACS Appl. Nano Mater., 2020, 3, 5637–5644 CrossRef CAS.
- K. Chen, S. Weng, J. Lu, J. Gu, G. Chen, O. Hu, X. Jiang and L. Hou, Microporous Mesoporous Mater., 2021, 320, 111106 CrossRef CAS.
- Z. Wang, J. M. Ang, J. Liu, X. Y. D. Ma, J. H. Kong, Y. F. Zhang, T. Yan and X. H. Lu, Appl. Catal., B, 2020, 263, 118344 CrossRef CAS.
- Q.-L. Zhu, W. Xia, L.-R. Zheng, R. Zou, Z. Liu and Q. Xu, ACS Energy Lett., 2017, 2, 504–511 CrossRef CAS.
- Q. Cheng, S. Han, K. Mao, C. Chen, L. Yang, Z. Zou, M. Gu, Z. Hu and H. Yang, Nano Energy, 2018, 52, 485–493 CrossRef CAS.
- J. J. Duan, X. X. Zheng, H. J. Niu, J. J. Feng, Q. L. Zhang, H. Huang and A. J. Wang, J. Colloid Interface Sci., 2020, 560, 467–474 CrossRef CAS PubMed.
- Q. Bai, F. C. Shen, S. L. Li, J. Liu, L. Z. Dong, Z. M. Wang and Y. Q. Lan, Small Methods, 2018, 2, 1800049 CrossRef.
- S. Chao, Z. Bai, Q. Cui, H. Yan, K. Wang and L. Yang, Carbon, 2015, 82, 77–86 CrossRef CAS.
- P. Yin, T. Yao, Y. Wu, L. Zheng, Y. Lin, W. Liu, H. Ju, J. Zhu, X. Hong, Z. Deng, G. Zhou, S. Wei and Y. Li, Angew. Chem., Int. Ed., 2016, 55, 10800–10805 CrossRef CAS PubMed.
- J. Wei, Y. Hu, Y. Liang, B. Kong, J. Zhang, J. Song, Q. Bao, G. P. Simon, S. P. Jiang and H. Wang, Adv. Funct. Mater., 2015, 25, 5768–5777 CrossRef CAS.
- X. Xiao, X. H. Li, Z. X. Wang, G. C. Yan, H. J. Guo, Q. Y. Hu, L. J. Li, Y. Liu and J. X. Wang, Appl. Catal., B, 2020, 265, 118603 CrossRef CAS.
- Q. Y. Zhou, Z. Zhang, J. J. Cai, B. Liu, Y. L. Zhang, X. F. Gong, X. L. Sui, A. P. Yu, L. Zhao, Z. B. Wang and Z. W. Chen, Nano Energy, 2020, 71, 104592 CrossRef CAS.
- H. Meng, Y. Liu, H. Liu, S. Pei, X. Yuan, H. Li and Y. Zhang, ACS Appl. Mater. Interfaces, 2020, 12, 41580–41589 CrossRef CAS PubMed.
- Y.-N. Hou, Z. Zhao, Z. Yu, Y. Tang, X. Wang and J. Qiu, Chem. Commun., 2017, 53, 7840–7843 RSC.
- X. C. Liu, S. Y. Peng, X. X. Li, C. Liu, J. M. Zeng, X. P. Qi and T. X. Liang, J. Electrochem. Soc., 2021, 168, 090514 CrossRef CAS.
- H. L. Gao, Y. Q. Ma, Y. P. Li, Y. Cao, Z. G. Yin, H. W. Luo, J. Yan and Y. Zhang, Inorg. Chem. Commun., 2021, 123, 108330 CrossRef CAS.
- J. J. Ban, G. C. Xu, L. Zhang, G. Xu, L. J. Yang, Z. P. Sun and D. Z. Jia, Nanoscale, 2018, 10, 9077–9086 RSC.
- P. Y. Jiang, Z. H. Xiao, Y. F. Wang, N. Li and Z. Q. Liu, Bioelectrochemistry, 2021, 138, 107717 CrossRef CAS PubMed.
- N. Zhou, L. G. Li, S. W. Chen, X. W. Peng, W. H. Niu and Y. P. Qu, J. Mater. Sci., 2019, 54, 4168–4179 CrossRef CAS.
Footnote |
| † Electronic supplementary information (ESI) available. See DOI: https://doi.org/10.1039/d2ra05877d |
| This journal is © The Royal Society of Chemistry 2022 |


