 Open Access Article
Construction of an aflatoxin aptamer sensor based on a DNA nanoprism structure
WenChun Liao,
ZhiXiong Chen,
BenQi Chen,
Meng Yang,
ZiYing Li,
Tong Yang ,
YunHui Yang
 *,
Shuang Meng* and
Rong Hu
 *
*
College of Chemistry and Chemical Engineering, Yunnan Normal University, Kunming, China 650500. E-mail: yyhui2002@aliyun.com; ms19880719@126.com; hudierong_168@163.com; Fax: +86 871 65941086
First published on 13th December 2022
Abstract
Aflatoxin B1 (AFB1) is a group of heterocyclic aromatic hydrocarbon secondary metabolites, which are the most toxic among the known fungal toxins. Therefore, it becomes particularly important to develop sensitive, accurate, rapid and simple methods for the detection of AFB1. In this work, a method of constructing aflatoxin aptasensor with black phosphorus nano sheet loaded with gold nanoparticles as electrode modification material, Ce-metal organic framework (MOF) material as signal label and prism DNA nano structure modified electrode as recognition interface is proposed. The hybridization between prism DNA and primer probe was used to trigger rolling circle amplification (RCA) on the electrode surface, and then the complementary chain modified with Au NPs@Ce-MOF is bound to the amplification chain to provide electrochemical signals. In the range of 0.024–100 ng mL−1, the response current showed a good linear relationship with the logarithm of aflatoxin concentration, the linear equation was I = 6.4181![[thin space (1/6-em)]](https://www.rsc.org/images/entities/char_2009.gif) lg
lg![[thin space (1/6-em)]](https://www.rsc.org/images/entities/char_2009.gif) c + 11.975 with the linear correlation coefficient of 0.9973, and the detection limit was 1.48 pg mL−1 (S/N = 3).
c + 11.975 with the linear correlation coefficient of 0.9973, and the detection limit was 1.48 pg mL−1 (S/N = 3).
Introduction
Aflatoxin is a toxic secondary metabolite produced by a mold.1 In our life, it is often present in food products and is more commonly found in moldy foods.2 Humid conditions favor the production of molds, and humidity and temperature also have a greater impact.3 Aflatoxin was classified as a class I carcinogen by the World Health Organization Cancer Agency in 1993.4 Currently, the common ones are B1, B2, M1, M2, G1, and G2.5 The toxicity of aflatoxins varies with different structures.6 In recent years, the content of AFT in feed and stored agricultural products has been on the rise, with peanuts and corn and the corresponding products having the highest levels. The excessive mycotoxin content has brought great potential danger to human health and the development of agricultural products. Aflatoxins are highly toxic to humans, including carcinogenicity, teratogenicity, nephrotoxicity, immunotoxicity, and mutagenicity.7 In 1973, the World Health Organization designated aflatoxin as a natural carcinogen.8 Given the high toxicity and carcinogenicity of AFB1, the level of AFB1 in food was used as an indicator of food contamination.9Currently, there are many methods for detecting aflatoxins. The common ones are immunochromatography,10 chemiluminescence,11 high performance liquid chromatography tandem mass spectrometry12 and fluorescence.13 These methods have accurate test results and high testing efficiency, but they require reliance on large instruments, high costs and more complicated pre-treatment.14 Therefore, it has become particularly important to develop a sensitive, accurate, rapid and simple detection method. However, aptasensors have been rapidly developed in recent years because of their selectivity and stability.15–17
In recent years, two-dimensional materials such as graphene and black phosphorus have become hot research topics in chemistry and medicine because of their unique optical and electrical properties and good biocompatibility. Black phosphorus nanosheets (BPNs) are lamellar 2D materials obtained from black phosphorus crystals by mechanical exfoliation. BPNs have better properties, such as, high specific surface and high electron mobility.18 In the field of analytical chemistry, BPNs was used for the detection of hydrogen peroxide,19 inorganic ions,20 and disease markers,21 among others.
Metal–organic frameworks (MOFs) are a class of porous coordination polymerized nanomaterials22 that have received a lot of attention from researchers for their good biocompatibility, electrical conductivity, and large specific surface area especially for their simple synthesis methods.23–25 On the other hand, composites containing cerium have been extensively studied in various catalytic reactions due to its high oxygen affinity.26,27 The modification of MOFs with rare earth elements has been used to make MOFs electrochemically active.
DNA single strands with base-pairing properties have become the material for generating various DNA nanostructures with precise dimensions and programmed shapes.28,29 DNA nanostructures improve the recognition of targets and have better modifiability. Based on the recognition of the target, it is particularly important to improve its sensitivity, and rolling loop amplification (RCA) is a commonly used signal amplification technique. The introduction of this method will be beneficial to improve its sensitivity and detection limit.
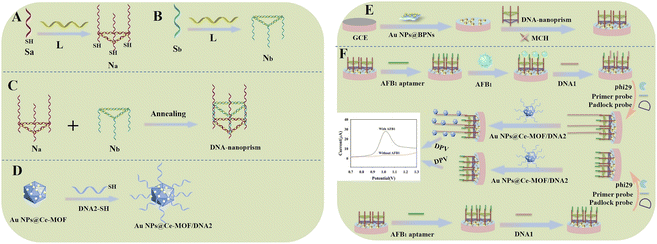
In this work, an aptasensor based on DNA nanoprism was designed for the sensitive detection of AFB1 with the signal amplification of RCA. As shown in Scheme 1, firstly, the previously prepared DNA nanoprism was anchored to the gold nanoparticles of the substrate Au NPs@BPNs by the thiol groups at the three bottom vertices with the help of Au–S bonds, and then the AFB1 aptamer was bound through hybridization. Because AFB1 can bind specifically to the AFB1 aptamer, AFB1 aptamer chain was dissociated when AFB1 was introduced in the system. Next, DNA1 complementary to the top strand of the DNA prism structure was added so that DNA1 was bound to the electrode by hybridization, and then padlock probe, primer probe and Phi29 DNA polymerase were added and the RCA reaction was initiated on the electrode surface. This repeated DNA sequence will complementarily pair with DNA2 modified with Au NPs@Ce-MOF, allowing Au NPs@Ce-MOF to be modified onto the electrode. The current response signal of Au NPs@Ce-MOF was detected by differential pulse voltammetry (DPV). The more AFB1 in the system present, the more AFB1 aptamer was dissociated, and more RCA reactions occurred on the electrode surface, resulting in a larger current response signal from Au NPs@Ce-MOF, thus a sensitive detection of AFB1 can be achieved. The introduction of DNA nanoprism will be beneficial to improve target recognition and are better modifiable. Moreover, the RCA is a common signal amplification technique which can improve sensitivity and detection limit of this method. Therefore, the proposed strategy has the advantages of high sensitivity, better selectivity and easy operation, and has a good application prospect for the detection of AFB1.
Experimental section
Materials and apparatus
The DNA primers used in this work were prepared by Shanghai Sangon Biological Engineering Technology and Services Co., Ltd (Shanghai, China). Aflatoxin B1 was obtained from Aladdin Biotechnology Co., Ltd (Shanghai China), ceric ammonium nitrate, dimethyl sulfoxide, Phi29 DNA polymerase, T4 DNA ligase, exonuclease I, deoxy-ribonucleoside triphosphate (dNTP) were bought from Sigma-Aldrich (USA), nitric acid was purchased from Chongqing Chuandong Chemical Group Co., Ltd (Chongqing, China), N,N-dimethylformamide (DMF) was bought from Chengdu Kolon Chemical Co., Ltd (Sichuan, China), magnesium chloride hexahydrate was obtained from Sinopharm Chemical Reagent Co., Ltd (Shanghai, China), potassium ferrocyanide was purchased from Tianjin Damao Chemical Reagent Factory (Tianjin, China), potassium ferricyanide was purchased from Tianjin Wind Ship Chemical Reagent Co., Ltd (Tianjin China).L chain (5′ to 3′): AGGCACCATCGTAGGTCTTGCCAGGCACCATCGTAGGTCTTGCCAGGCACCATCGTAGGTCTTGCC, Sa chain (5′ to 3′): AAAAAAAAAAAAAAAAAACGATGGTGCCTGGCAAGACCTTTCCGAACTGAT-C6-SH, Sb chain (5′ to 3′): CGATGGTGCCTGGCAAGACCTTTCAGTTCGGA, DNA1 chain (5′ to 3′): TGAGGTAGTATTTTTTTTTTTTTTTTTT, DNA2 chain (5′ to 3′): SH-C6-TATCTCTATCTC, primer probe chain (5′ to 3′): TACTACCTCAATCCCTATAAATACCCTAAC, padlock probe chain (5′ to 3′): p-TTATAGGGTATCTCTATCTCTTAGGGTAT. All DNA primers were synthesized by Bioengineering (Shanghai, China). Glassy carbon electrode were purchased from Tianjin Hengsheng Technology Development Co., Ltd (Tianjin, China), Fourier transform infrared spectroscopy (FTIR) was measured with Nicolet IS 10 Fourier transform infrared spectroscopy (Nicolite Co., USA), transmission electron microscope (TEM) were measured with JEM-2100 transmission electron microscope (JEOL, Japan), scanning electron microscope (SEM) was conducted with SU8020 scanning electron microscope (Hitachi, Japan), X-ray diffractomer (XRD) was carried out using BRUCKER D8 ADVANCE X-ray diffractomer (Bruker Co., Germany), X-ray photoelectron spectroscopy (XPS) were performed with Thermo Escalab 250Xi X-ray photoelectron spectroscopy (Thermo Fisher Scientific, USA).
Synthesis of Ce-MOF
Ce-MOF was synthesized according to the previously reported method with some modifications.30 Firstly, 708 mg of terephthalic acid was dissolved in 24 mL of DMF, and then 8 mL of 0.53 mol L−1 ceric ammonium nitrate solution was added into the solution and mixed well. The mixture was heated at 100 °C for 3 h using an oil bath to obtain the light yellow solid. Then, the product was separated by filtration and washed with DMF and acetone for three times respectively, and solvent exchange with methanol in a Soxhlet extractor. Finally, the product was dried under vacuum at 100 °C for 24 h and stored under seal.Synthesis of Au NPs
Gold nanoparticles were synthesized according to the method with some modifications.31 50 mL of sterilized water was added to a clean three-necked flask, and then 500 μL of 1% solution of chloroauric acid was added and heated to boiling with stirring in an oil bath at 120 °C. 1.75 mL of 1% trisodium citrate was added and continuously heated with stirring for 15 min until the solution turned burgundy, and stored in separate tubes at 4 °C in dark.Synthesis of Au NPs@Ce-MOF
50 mg of Ce-MOF was dispersed in 30 mL of sterile water, and sonicated to make them uniformly dispersed. Then, 15 mL of gold nanosol was added into above solution and stirred for 48 h at room temperature in dark. The synthesized product was centrifuged and washed with sterile water. After dried under vacuum, Au NPs@Ce-MOF was obtained.Fabrication of Au NPs@Ce-MOF-modified DNA2
5 mg of Au NPs@Ce-MOF was dispersed in 1 mL of PBS buffer (pH 7.0). Then, 200 μL of 10 μmol L−1 DNA2 was added into above solution in a shaker incubator at 37 °C for 120 min followed by centrifuging and washing twice with PBS buffer (pH 7.0) to remove unbound and weakly bound DNA2. Finally, the product was dispersed in 1 mL of PBS buffer (pH 7.0) to obtain Au NPs@Ce-MOF-modified DNA2, which was stored at 4 °C for later use.Synthesis of DNA nanoprism
The DNA nanoprism was synthesized by a three-step assembly method according to the ref. 32 with some modifications. The synthesis process is shown in Scheme 1. First, the lyophilized DNA powder of L chain, Sa chain, and Sb chain were diluted to 5 μmol L−1 with PBS buffer (pH 7.0) containing 5 mmol L−1 of Mg2+, respectively. Second, the lower Na structure of DNA nanoprism was synthesized by mixing the L chain and Sa chain with the ratio of 1![[thin space (1/6-em)]](https://www.rsc.org/images/entities/char_2009.gif) :
:![[thin space (1/6-em)]](https://www.rsc.org/images/entities/char_2009.gif) 3, and then heated in a water bath at 95 °C for 5 min, and incubated at 65 °C for 40 min, 50 °C for 40 min, 37 °C for 40 min, 22 °C for 40 min, and finally placed at 4 °C for 40 min. Third, the upper Nb structure of DNA nanoprism was synthesized by mixing the L chain and Sb chain with the ratio of 1
3, and then heated in a water bath at 95 °C for 5 min, and incubated at 65 °C for 40 min, 50 °C for 40 min, 37 °C for 40 min, 22 °C for 40 min, and finally placed at 4 °C for 40 min. Third, the upper Nb structure of DNA nanoprism was synthesized by mixing the L chain and Sb chain with the ratio of 1![[thin space (1/6-em)]](https://www.rsc.org/images/entities/char_2009.gif) :
:![[thin space (1/6-em)]](https://www.rsc.org/images/entities/char_2009.gif) 3 and assembling Nb by the same method as synthesizing Na structure of DNA nanoprism.
3 and assembling Nb by the same method as synthesizing Na structure of DNA nanoprism.
Finally, the DNA nanoprism was assembled by mixing the lower structure Na and the upper structure Nb with the ratio of 1![[thin space (1/6-em)]](https://www.rsc.org/images/entities/char_2009.gif) :
:![[thin space (1/6-em)]](https://www.rsc.org/images/entities/char_2009.gif) 1 and then incubated at 50 °C for 40 min, 37 °C for 30 min, 22 °C for 30 min and 4 °C for 30 min, and diluted to 500 nmol L−1 with PBS buffer (pH 7.0) to obtain the DNA nanoprism, and stored at 4 °C for later use.
1 and then incubated at 50 °C for 40 min, 37 °C for 30 min, 22 °C for 30 min and 4 °C for 30 min, and diluted to 500 nmol L−1 with PBS buffer (pH 7.0) to obtain the DNA nanoprism, and stored at 4 °C for later use.
Synthesis of loop-forming DNA
1 μmol L−1 primer chain and 1 μmol L−1 padlock chain were mixed in equal volumes. Then, 10× T4 DNA ligase buffer was added and mixed well. Next, the mixture was heated a water bath at 95 °C for 5 min, and transferred in incubator at 37 °C for 60 min, and then 5 U T4 DNA ligase was added and transferred in incubator at 37 °C for 60 min. And, 10 U of exonuclease I was added into the above solution and transferred in incubator at 37 °C for 30 min, and incubated in a water bath at 95 °C for 5 min to inactivate the enzyme. Finally, the loop-forming DNA was stored at 4 °C for further use.Synthesis of black phosphorus nanosheets
The black phosphorus nanosheets (BPNs) were synthesized according to the method with some modifications.33 50 mg of black phosphorus crystals were added into an agate mortar and 1 mL of N-methylpyrrolidone was added to grind the crystals to make the particles smaller. The grinding solution was transferred to a round-bottom flask. After 100 mL of N-methylpyrrolidone was added, the mixture was protected by nitrogen gas, and the round-bottom flask was sealed. The sealed round bottom flask was sonicated at 300 W for 10 h in an ice bath. After centrifuged, the large crystals were discarded, and the resulting suspension was freeze-dried to obtain black phosphorus nanosheets.Synthesis of Au NPs@BPNs
20 mg of BPNs solid powder were dissolved in 10 mL of sterilized water and sonicated to make it dispersed uniformly. Then, 10 mL of gold nanoparticle sols were added slowly dropwise and stirred at room temperature and protected from light for 48 h. After centrifuged, the mixture was washed with sterile water and dried under vacuum to obtain Au NPs@BPNs.Measurement procedure
The glassy carbon electrodes were polished with three different particle sizes of alumina, followed by ultrasonic washing with dilute nitric acid (1![[thin space (1/6-em)]](https://www.rsc.org/images/entities/char_2009.gif) :
:![[thin space (1/6-em)]](https://www.rsc.org/images/entities/char_2009.gif) 1 ratio of nitric acid to water by volume), anhydrous ethanol and ultrapure water for 5 min, respectively, and dried for later use.
1 ratio of nitric acid to water by volume), anhydrous ethanol and ultrapure water for 5 min, respectively, and dried for later use.
4 mg mL−1 Au NPs@BPNs was mixed with 0.5% chitosan with a 1![[thin space (1/6-em)]](https://www.rsc.org/images/entities/char_2009.gif) :
:![[thin space (1/6-em)]](https://www.rsc.org/images/entities/char_2009.gif) 1 volume ratio to obtain 2 mg mL−1 of Au NPs@BPNs dispersion. 10 μL of the dispersion was modified on the electrode surface and dried in air. Then, 10 μL of 500 nmol L−1 DNA nanoprism was added dropwise and incubated at room temperature and humidity incubator for 60 min. In this work, 1% MCH was used to block the non-specific sites on the surface of Au NPs@BPNs for 30 min. Then, 2 μmol L−1 of AFB1 aptamer was added and incubated for 60 min. 10 μL of different concentrations of AFB1 was added dropwise on the electrode surface and incubated for 60 min. Next, 10 μL of 3 μmol L−1 DNA1 was added and incubated for 60 min, followed by adding 10 μL of 1 μmol L−1 primer probe and incubated for 60 min. Next, 10 μL of 1 μmol L−1 padlock probe was added dropwise and incubated for 60 min, followed by adding 5 U of Phi29 DNA polymerase and 10 μL of 100 mmol L−1 dNTP and incubated for 30 min. Finally, DNA2 modified with Au NPs@Ce-MOF was added dropwise and incubated for 60 min.
1 volume ratio to obtain 2 mg mL−1 of Au NPs@BPNs dispersion. 10 μL of the dispersion was modified on the electrode surface and dried in air. Then, 10 μL of 500 nmol L−1 DNA nanoprism was added dropwise and incubated at room temperature and humidity incubator for 60 min. In this work, 1% MCH was used to block the non-specific sites on the surface of Au NPs@BPNs for 30 min. Then, 2 μmol L−1 of AFB1 aptamer was added and incubated for 60 min. 10 μL of different concentrations of AFB1 was added dropwise on the electrode surface and incubated for 60 min. Next, 10 μL of 3 μmol L−1 DNA1 was added and incubated for 60 min, followed by adding 10 μL of 1 μmol L−1 primer probe and incubated for 60 min. Next, 10 μL of 1 μmol L−1 padlock probe was added dropwise and incubated for 60 min, followed by adding 5 U of Phi29 DNA polymerase and 10 μL of 100 mmol L−1 dNTP and incubated for 30 min. Finally, DNA2 modified with Au NPs@Ce-MOF was added dropwise and incubated for 60 min.
All incubation temperature were 37 °C, electrodes were rinsed with PBS after each incubation, finally the DPV response was measured in PBS (pH 7.0).
Results and discussion
Characterization of Ce-MOF
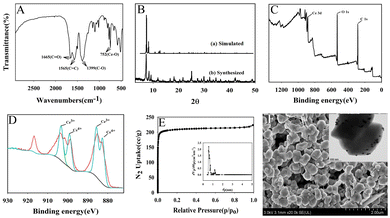
Ce-MOF was characterized by FTIR, XRD, XPS, SEM, TEM and N2 adsorption–desorption isotherm.Fig. 1A shows FTIR spectrum of Ce-MOF. The peaks at 1565 cm−1 and 1399 cm−1 are related to the C![[double bond, length as m-dash]](https://www.rsc.org/images/entities/char_e001.gif) C in the aromatic ring of the organic linker and the C–O bond in the C–OH, respectively. The peak at 752 cm−1 can be seen as a Ce–O bending vibration. In addition, the peak at 1665 cm−1 is the stretching vibration of the carbonyl group adsorbed in the Ce-MOF structure. Fig. 1B shows the X-ray diffraction pattern of Ce-MOF. The sharp reflections around 2θ = 7.2°, 8.3° correspond to the reflections of (111), (200) planes which is in accordance with previously reported work.30 The Ce 3d3/2 and Ce 3d5/2 peaks can be observed from the XPS spectra of Ce 3d, as shown in Fig. 1C. Two valence states of cerium ions are present in the Ce-MOF, Ce3+ and Ce4+, respectively (Fig. 1D). N2 adsorption isotherms are measured at 77 K to investigate the porosity of Ce-MOF (Fig. 1E). The samples were pre-treated by heating at 120 °C for 6 h under vacuum. As shown in Fig. 1E, the material showed a type I isotherm characterized by a significant absorption in the low pressure region and calculated for a surface area of 929.54 m2 g−1. The major pore size distribution of these products was 0.5–1.2 nm (Fig. 1E (inset)). According to the SEM of Ce-MOF, the nanoparticles are uniform in size and distributed in a cubic particle shape (Fig. 1F). As displayed in Fig. 1F (inset), the gold nanoparticles were evenly loaded on the Ce-MOF.
C in the aromatic ring of the organic linker and the C–O bond in the C–OH, respectively. The peak at 752 cm−1 can be seen as a Ce–O bending vibration. In addition, the peak at 1665 cm−1 is the stretching vibration of the carbonyl group adsorbed in the Ce-MOF structure. Fig. 1B shows the X-ray diffraction pattern of Ce-MOF. The sharp reflections around 2θ = 7.2°, 8.3° correspond to the reflections of (111), (200) planes which is in accordance with previously reported work.30 The Ce 3d3/2 and Ce 3d5/2 peaks can be observed from the XPS spectra of Ce 3d, as shown in Fig. 1C. Two valence states of cerium ions are present in the Ce-MOF, Ce3+ and Ce4+, respectively (Fig. 1D). N2 adsorption isotherms are measured at 77 K to investigate the porosity of Ce-MOF (Fig. 1E). The samples were pre-treated by heating at 120 °C for 6 h under vacuum. As shown in Fig. 1E, the material showed a type I isotherm characterized by a significant absorption in the low pressure region and calculated for a surface area of 929.54 m2 g−1. The major pore size distribution of these products was 0.5–1.2 nm (Fig. 1E (inset)). According to the SEM of Ce-MOF, the nanoparticles are uniform in size and distributed in a cubic particle shape (Fig. 1F). As displayed in Fig. 1F (inset), the gold nanoparticles were evenly loaded on the Ce-MOF.
From the above characterization, it can be concluded that Ce-MOF was synthesized successfully.
Characterization of BPNs
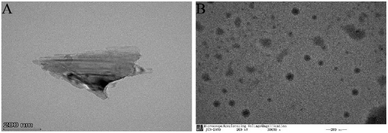
To observe the microscopic morphology of the BPNs prepared by the ultrasound-assisted liquid-phase exfoliation method, the BPNs were characterized by TEM. Fig. 2A shows that the prepared BPNs are thin-layered flakes, and the BPNs obtained by black phosphorus crystal exfoliation are smaller in size and fewer in number of layers. The thickness is 1.3 ± 0.7 nm and number of layers is about 2. Fig. 2B is TEM image of Au NPs@BPNs. It can be seen that a large number of gold nanoparticles are uniformly adsorbed on the surface of the BPNs.Electrophoretic characterization of DNA nanoprism
To investigate the construction process of DNA nanoprism, 8% polyacrylamide gel electrophoresis (PAGE) was employed for characterization. The results were shown in Fig. 3. Lane 1 shows the Sa chain; lane 2 shows the Sb chain; lane 3 shows the L chain; lane 4 shows the lower part Na of the DNA nanoprism obtained after incubation of the L and Sa chains. As a result, new bands can be seen, indicating that the lower part Na of the DNA nanoprism was successfully assembled after incubation. Lane 5 shows the upper part Nb of the DNA nanoprism obtained after incubation of the L and Sb strands, and as a result, new bands can be seen, indicating the successful assembly of the upper part Nb of the DNA nanoprism after incubation; lane 6 shows the new bands obtained after incubation of Na and Nb, indicating the successful assembly of the DNA nanoprism.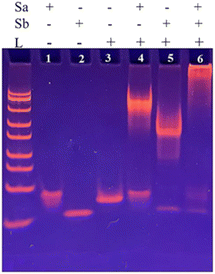 | ||
| Fig. 3 PAGE electropherogram of DNA nanoprism: Sa chain (line 1), Sb chain (line 2), L chain (line 3), Sa + L chain (line 4), Sb + L chain (line 5), Sa + Sb + L chain (line 6). | ||
Feasibility analysis of AFB1 aptamer sensor
The DPV response of the system with and without AFB1 was first compared in Fig. 4A. When there was no AFB1 in the system, the DPV response of the system was small. When 50 ng mL−1 AFB1 was present in the system, more RCA reactions were triggered due to the dissociation of the AFB1 aptamer, resulting in a larger DPV response of the system. This phenomenon illustrates that the proposed method can be used for the sensitive detection of AFB1.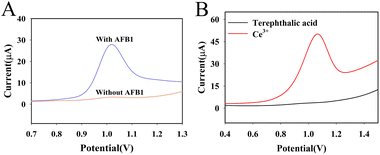 | ||
| Fig. 4 Sensing performance of DNA nanoprism-based aptasensor with and without AFB1 (50 ng mL−1) in PBS (100 mmol L−1, pH 7.0) containing 5 mmol L−1 MgCl2 (A) and exploration of signal sources (B). | ||
To investigate the peak at 1.0 V in Fig. 4A is produced by cerium ion or ligand (terephthalic acid), the ligand and cerous nitrate was dissolved in distilled water (40 mg mL−1), respectively. The DPV response of these two solution were tested with bare glassy carbon electrode. The result was shown in Fig. 4B. There is an oxidation peak at 1.0 V in the solution of cerous nitrate. In contrast, there is no oxidation peak at 1.0 V in the solution of ligand, indicating the DPV response in Fig. 4A is produced by the oxidation of Ce3+ of Au@Ce-MOF.
AC impedance curves of electrode modification process
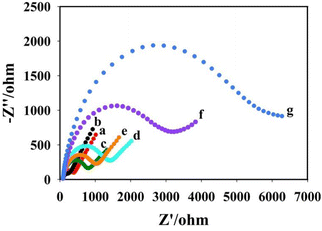
The electrochemical AC impedance was obtained in 5 mmol L−1 K3Fe(CN)4/K4Fe(CN)6 solution containing 100 mmol L−1 KCl to characterize the assembly process of the sensor. As shown in Fig. 5, curve a shows the impedance of the bare glassy carbon electrode (Rct = 400 Ω). Curve b shows the impedance of the bare electrode modified with Au NPs@BPNs, the impedance value reduced (Rct = 210 Ω) due to the better conductivity of Au NPs@BPNs. Curve c was obtained by dropping DNA nanoprism on Au NPs@BPNs/GCE with increased impedance value (Rct = 800 Ω) due to the non-conducting nature of DNA. Curve d was obtained after further modification of AFB1 aptamer. Impedance value increases due to complementary pairing of AFB1 aptamer with DNA nanoprism (Rct = 1432 Ω). After incubation of AFB1, curve e was obtained. The impedance became smaller because AFB1 aptamer combines with AFB1 and dissociates from DNA nanoprism (Rct = 1060 Ω). Curve f was obtained after the RCA reaction on the electrode surface, where a large number of DNA strands were generated. Thus, the AC impedance value increased further (Rct = 3210 Ω). Curve g was obtained after the combination of Au NPs@Ce-MOF/DNA2 on the basis of RCA reaction. The impedance increases further (Rct = 6100 Ω). The change of electrochemical AC impedance on the electrode surface shows that the layer-by-layer modification on the electrode surface is successful and proves that the aptasensor was constructed successfully.Optimization of detection conditions
To improve sensor performance, pH of the buffer solution, incubation time of AFB1, concentration of AFB1 aptamer and RCA reaction time were optimized. Firstly, as shown in Fig. 6A, the current response of the aptasensor increases with increasing pH and reaches the highest at pH 7.0, after that, the current response decreases. Therefore, pH 7.0 was chosen as the optimal pH of the buffer solution. Secondly, AFB1 incubation time have a large influence on the response performance of the aptasensor. For this reason, the effect of incubation time of AFB1 on the aptasensor was investigated. With the increase of AFB1 incubation time, the current response of the aptasensor increased and reached a plateau when the AFB1 incubation time reached 100 min (Fig. 6B). Therefore, 100 min was selected as the optimal incubation time for AFB1 in the later study. Fig. 6C displays the effect of the concentration of AFB1 aptamer on the current response. As the concentration of AFB1 aptamer increased, the DPV response became larger. When the concentration of AFB1 aptamer was 3 μmol L−1, the change of DPV response reached a plateau. Thus, 3 μmol L−1 was selected as the optimum aptamer concentrations for further work. The RCA reaction time has a large effect on the sensor response performance, and it determines the amount of Au NPs@Ce-MOF/DNA2 that can be modified by the sensor. As shown in Fig. 6D, the DPV response increased sharply with the RCA response time increased and reach the highest at 40 min. Hence, 40 min was selected in the subsequent work.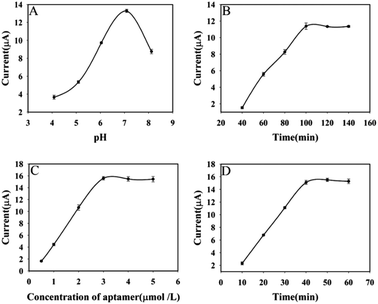 | ||
| Fig. 6 The effect of detection conditions on the DPV response (pH of buffer solution (A), incubation time of AFB1 (B), concentration of AFB1 aptamer (C) and RCA response time (D)). | ||
Response performance of the AFB1 aptamer sensor
Under the optimal experimental conditions, AFB1 at 0.024 ng mL−1, 0.098 ng mL−1, 0.39 ng mL−1, 1.56 ng mL−1, 6.25 ng mL−1, 25 ng mL−1, and 100 ng mL−1 was measured using this aptasensor, and the results were shown in Fig. 7. Fig. 7A shows the DPV curves for a series of AFB1 concentrations; Fig. 7B shows the calibration curve. The DPV response current was linear with the logarithm of AFB1 concentration in the range of 0.024–100 ng mL−1, and the obtained linear equation was I = 6.4181![[thin space (1/6-em)]](https://www.rsc.org/images/entities/char_2009.gif) lg
lg![[thin space (1/6-em)]](https://www.rsc.org/images/entities/char_2009.gif) c + 11.975, R2 = 0.9973. The detection limit of this aptasensor was 1.48 pg mL−1 (S/N = 3). The calculation of detection limit is based on the IUPAC standard method, ĪL = Īb (μA) + 3σb, and
c + 11.975, R2 = 0.9973. The detection limit of this aptasensor was 1.48 pg mL−1 (S/N = 3). The calculation of detection limit is based on the IUPAC standard method, ĪL = Īb (μA) + 3σb, andwhere ĪL is the average signal value of target AFB1 at detecting limit, Īb is the average signal value without the target AFB1 (blank sample, n = 11) and the σb is the standard deviation of the blank sample.
![[C with combining macron]](https://www.rsc.org/images/entities/i_char_0043_0304.gif) L is detection limit, S is the sensitivity(the slope of linear equation).
L is detection limit, S is the sensitivity(the slope of linear equation).
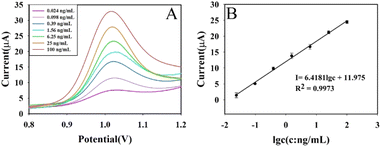 | ||
| Fig. 7 DPV response curves of different concentrations of AFB1 (A) and calibration curve of aptasensor (B). | ||
Compared with the current common AFB1 detection methods, the proposed aptamer sensor has a lower detection limit and better response (Table 1), which can be applied to the sensitive detection of AFB1.
| Method | Linear range | Detection limit | References |
|---|---|---|---|
| Differential pulse voltammetry | 0.05–6 ng mL−1 | 0.05 ng mL−1 | 34 |
| Chemiluminescence competitive aptamer | 0.1–10 ng mL−1 | 0.11 ng mL−1 | 11 |
| Fluorescence | 0.2–20 ng mL−1 | 0.16 ng mL−1 | 35 |
| Fluorescence | 0.005–2 ng mL−1 | 5 pg mL−1 | 13 |
| Aptamer sensors of DNA nanostructures | 0.024–100 ng mL−1 | 1.48 pg mL−1 | This work |
Comparison with other methods
Comparisons between the detection methods proposed in this experiment and the current common methods for detecting AFB1 are shown in Table 1. It can be seen that this method has a wide detection range, a lower detection limit and a better response.Selectivity and anti-interference ability of AFB1 aptamer sensor
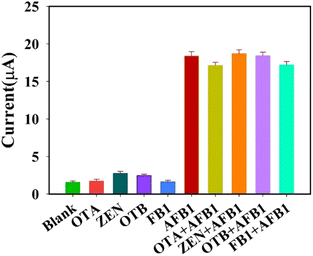
In order to investigate the selectivity and interference resistance of this aptasensor, four interfering substances were selected and measured by mixed solution method and separate solution method, respectively. First, the DPV responses of the aptasensor to 100 ng mL−1 of ochratoxin A (OTA), zearalenone (ZEN), ochratoxin B (OTB), fumonisin B1 (FB1) and 10 ng mL−1 of AFB1 were measured, respectively. Then, 10 ng mL−1 of AFB1 was mixed with 100 ng mL−1 of OTA, ZEN, OTB, and FB1 in equal volumes for measurement, respectively. The results are shown in Fig. 8, from which it can be seen that the aptasensor has good selectivity and anti-interference ability.Determination of recovery
To test the practicality of this aptasensor, the experiments were carried out in real samples using the standard addition method for the determination of the recovery. As shown in Table 2, 10, 50 and 100 ng mL−1 of AFB1 were added to corn flour for the determination, and the recoveries ranged from 97.7% to 106.4%, indicating that the aptasensor can be used for the determination of AFB1 in real samples.| Sample | Added (ng mL−1) | Found (ng mL−1), n = 3 | RSD (%) | Recovery (%) |
|---|---|---|---|---|
| 1 | 0 | No found | — | — |
| 2 | 10.0 | 10.40 | 3.28 | 104.0 |
| 10.64 | 106.4 | |||
| 9.97 | 99.7 | |||
| 3 | 50.0 | 50.12 | 1.32 | 100.2 |
| 49.75 | 99.5 | |||
| 48.85 | 97.7 | |||
| 4 | 100.0 | 104.71 | 3.27 | 104.7 |
| 98.18 | 98.2 | |||
| 102.62 | 102.6 |
Conclusions
In this work, BPNs loaded with gold nanoparticles were used as the modification material of the electrode, and the prismatic DNA nanostructure modified electrode was used as the recognition interface with Ce-MOF as the signal marker. The AFB1 aptamer sensor was constructed by using hybridization between prismatic DNA, primer probes to trigger RCA on the electrode surface, and hybridization of complementary strands modified with Au NPs@Ce-MOF bound to the amplified strand to provide DPV response signal. The DPV response current of the aptasensor showed a good linear relationship with the logarithm of aflatoxin concentration in the range of 0.024–100 ng mL−1, and the limit of detection was as low as 1.48 pg mL−1 (S/N = 3). The aptasensor is highly sensitive, specific and can be used for the detection of aflatoxin in real samples.Conflicts of interest
The authors declare there are no conflicts of interest regarding the publication of this paper.Acknowledgements
This work was supported by the National Natural Science Foundation of China (Grant No. 21765026).References
- D. L. Eaton and E. P. Gallagher, Annu. Rev. Pharmacol. Toxicol., 1994, 34(1), 135–172 CrossRef CAS PubMed.
- S. L. Lin, P. T. Gao, Q. L. Li, Y. Q. Zhang, J. W. Hu, M. Y. Cai, W. Z. Qin, L. L. Ma, Z. Ren and Z. Zhang, Mol. Med. Rep., 2020, 21(3), 1276–1284 CAS.
- A. Astoreca, G. Vaamonde, A. Dalcero, S. Marin and A. Ramos, Food Microbiol., 2014, 38(4), 276–283 CrossRef CAS PubMed.
- M. S. Simmonds, Phytochemistry, 2004, 65(1), 139 CrossRef CAS.
- J. F. Alberts, Y. Engelbrecht, P. S. V. Steyn, W. Holzapfel and W. van Zyl, Int. J. Food Microbiol., 2006, 109(1), 121–126 CrossRef CAS PubMed.
- W. L. Zheng, J. Teng, L. Cheng, Y. W. Ye, D. D. Pan, J. J. Wu, F. Xue, G. D. Liu and W. Chen, Biosens. Bioelectron., 2016, 80, 574–581 CrossRef CAS PubMed.
- J. Koshiol, Y. T. Gao, M. Dean, P. Egner, C. Nepal, K. Jones, B. S. Wang, A. Rashid, W. Luo and A. L. Van Dyke, Gastroenterology, 2017, 153(2), 488–494 CrossRef CAS PubMed.
- W. F. Haddon, M. Wiley and A. C. Waiss, Anal. Chem., 1971, 43(2), 268–270 CrossRef CAS PubMed.
- N. M. Danesh, H. B. Bostan, K. Abnous, M. Ramezani, K. Youssefi, S. M. Taghdisi and G. Karimi, TrAC, Trends Anal. Chem., 2017, 99, 117–128 CrossRef.
- L. Z. Wang, J. D. Sun, J. Ye, L. P. Wang and X. L. Sun, Food Chem., 2022, 374, 131684 CrossRef CAS PubMed.
- W. B. Shim, H. Mun, H. A. Joung, J. A. Ofori, D. H. Chung and M. G. Kim, Food Control, 2014, 36(1), 30–35 CrossRef CAS.
- O. L. Areo, O. A. Abafe, S. Gbashi and P. B. Njobeh, Food Control, 2023, 143, 109255 CrossRef CAS.
- B. Wang, Y. F. Chen, Y. Y. Wu, B. Weng, Y. S. Liu, Z. S. Lu, C. M. Li and C. Yu, Biosens. Bioelectron., 2016, 78, 28–30 Search PubMed.
- F. Hong, C. X. Huang, W. Long, M. Wang, Y. P. Chen and Y. X. She, Biosens. Bioelectron., 2021, 192, 113489 CrossRef CAS PubMed.
- H. H. Li, C. Y. Wen, C. Y. Hong and J. C. Lai, RSC Adv., 2017, 7(68), 42856–42865 RSC.
- C. Liu, W. Zeng, J. M. Liu, B. Hu and L. Wu, Sens. Actuators, B, 2022, 371, 132494 CrossRef CAS.
- L. Wu, M. Zhou, Y. S. Wang and J. M. Liu, J. Hazard. Mater., 2020, 399, 123154 CrossRef CAS PubMed.
- H. W. Liu, K. Hu, D. F. Yan, R. Chen, Y. Q. Zou, H. B. Liu and S. Y. Wang, Adv. Mater., 2018, 30(32), 1800295 CrossRef PubMed.
- S. C. Yan, B. J. Wang, Z. L. Wang, D. Hu, X. Xu, J. Z. Wang and Y. Shi, Biosens. Bioelectron., 2016, 80, 34–38 CrossRef CAS PubMed.
- W. Gu, X. Y. Pei, Y. X. Cheng, C. L. Zhang, J. D. Zhang, Y. H. Yan, C. P. Ding and Y. Z. Xian, ACS Sens., 2017, 2(4), 576–582 CrossRef CAS PubMed.
- J. Peng, Y. Q. Lai, Y. Y. Chen, J. Xu, L. P. Sun and J. Weng, Small, 2017, 13(15), 1603589 CrossRef PubMed.
- J. Lee, J. S. Choi, N. C. Jeong and W. Choe, Chem. Sci., 2019, 10(24), 6157–6161 RSC.
- S. Barthel, E. V. Alexandrov, D. M. Proserpio and B. Smit, Cryst. Growth Des., 2018, 18(3), 1738–1747 CrossRef CAS PubMed.
- A. W. Thornton, K. E. Jelfs, K. Konstas, C. M. Doherty, A. J. Hill, A. K. Cheetham and T. D. Bennett, Chem. Commun., 2016, 52(19), 3750–3753 RSC.
- L. Wu, S. H. Zhou, G. L. Wang, Y. H. Yun, G. Z. Liu and W. M. Zhang, Frontiers in Bioengineering and Biotechnology, 2021, 9, 727886 CrossRef PubMed.
- J. Ke, J. W. Xiao, W. Zhu, H. C. Liu, R. Si, Y. W. Zhang and C. H. Yan, J. Am. Chem. Soc., 2013, 135(40), 15191–15200 CrossRef CAS PubMed.
- X. Wang, S. N. Zhao, Y. B. Zhang, Z. Wang, J. Feng, S. Y. Song and H. J. Zhang, Chem. Sci., 2016, 7(2), 1109–1114 RSC.
- M. X. You, Y. F. Lyu, D. Han, L. P. Qiu, Q. L. Liu, T. Chen, C. S. Wu, L. Peng, L. Q. Zhang, G. Bao and W. H. Tan, Nat. Nanotechnol., 2017, 12, 453–459 CrossRef CAS PubMed.
- G. Z. Zhu, S. F. Zhang, E. Q. Song, J. Zheng, R. Hu, X. H. Fang and W. H. Tan, Angew. Chem., Int. Ed., 2013, 52(21), 5490–5496 CrossRef CAS PubMed.
- M. Karimi, H. Mohebali, S. Sadeghi, V. Safarifard, A. Mahjoub and A. Heydari, Microporous Mesoporous Mater., 2021, 322(13), 111054 CrossRef CAS.
- G. Frens, Nature Physical Science, 1973, 241(105), 20–22 CrossRef CAS.
- S. Zeng, S. Wang, X. Xie, S. H. Yang, J. H. Fan, Z. Nie, Y. Huang and H. H. Wang, Anal. Chem., 2020, 92(22), 15194–15201 CrossRef CAS PubMed.
- Y. Li, Z. M. Liu, Y. Q. Hou, G. C. Yang, X. X. Fei, H. N. Zhao, Y. X. Guo, C. K. Su, Z. Wang and H. Q. Zhong, ACS Appl. Mater. Interfaces, 2017, 9(30), 25098–25106 CrossRef CAS PubMed.
- K. Y. Goud, A. Hayat, G. Catanante, M. Satyanarayana, K. V. Gobi and J. L. Marty, Electrochim. Acta, 2017, 244, 96–103 CrossRef CAS.
- Z. L. Zhao, H. Wang, W. L. Zhai, X. Y. Feng, X. Fan, A. L. Chen and M. Wang, Toxins, 2020, 12(2), 136 CrossRef CAS PubMed.
| This journal is © The Royal Society of Chemistry 2022 |

