 Open Access Article
T1–T2 dual-modal magnetic resonance contrast-enhanced imaging for rat liver fibrosis stage†
Fulin Luab,
Liang Dua,
Wei Chena,
Hai Jianga,
Chenwu Yanga,
Yu Pua,
Jun Wua,
Jiang Zhua,
Tianwu Chena,
Xiaoming Zhang*a and
Changqiang Wu *a
*a
aMedical Imaging Key Laboratory of Sichuan Province, School of Medical Imaging, Affiliated Hospital of North Sichuan Medical College, Nanchong 637000, China. E-mail: wucq1984@nsmc.edu.cn
bDepartment of Radiology, Sichuan Academy of Medical Sciences, Sichuan Provincial People's Hospital, University of Electronic Science and Technology of China, Chengdu 610072, China
First published on 14th December 2022
Abstract
The development of an effective method for staging liver fibrosis has always been a hot topic of research in the field of liver fibrosis. In this paper, PEGylated ultrafine superparamagnetic iron oxide nanocrystals (SPIO@PEG) were developed for T1–T2 dual-modal contrast-enhanced magnetic resonance imaging (MRI) and combined with Matrix Laboratory (MATLAB)-based image fusion for staging liver fibrosis in the rat model. Firstly, SPIO@PEG was synthesized and characterized with physical and biological properties as a T1–T2 dual-mode MRI contrast agent. Secondly, in the subsequent MR imaging of liver fibrosis in rats in vivo, conventional T1 and T2-weighted imaging, and T1 and T2 mapping of the liver pre- and post-intravenous administration of SPIO@PEG were systematically collected and analyzed. Thirdly, by creative design, we fused the T1 and T2 mapping images by MATLAB and quantitively measured each rat's hepatic fibrosis positive pixel ratio (PPR). SPIO@PEG was proved to have an ultrafine core size (4.01 ± 0.16 nm), satisfactory biosafety and T1–T2 dual-mode contrast effects under a 3.0 T MR scanner (r2/r1 = 3.51). According to the image fusion results, the SPIO@PEG contrast-enhanced PPR shows significant differences among different stages of liver fibrosis (P < 0.05). The combination of T1–T2 dual-modal SPIO@PEG and MATLAB-based image fusion technology could be a promising method for diagnosing and staging liver fibrosis in the rat model. PPR could also be used as a non-invasive biomarker to diagnose and discriminate the stages of liver fibrosis.
1 Introduction
Cholestatic liver fibrosis has quickly become a research hotspot with an increased relationship to the mechanism of liver cirrhosis and liver failure associated with severe morbidity and mortality.1–4 However, despite treatment, some biliary liver fibrotic patients progress toward liver cirrhosis or other end-stage liver diseases.5 At present, the gold standard method for detecting and staging liver fibrosis in clinical practice is liver biopsy, which is limited by obvious bias, sampling error, and high cost.6 Moreover, a biopsy is an invasive method with infection risk and other significant complications that are not suitable for dynamic observation and repeating examinations.7 Traditional diffusion-weighted imaging (DWI) and ultrasound transient elastography are two diagnostic techniques for liver fibrosis with the greatest potential.8 Nevertheless, both methods have inherent drawbacks: the diffusion of water molecules affects DWI, and ultrasound transient elastography has poor imaging quality. Notably, both methods are single-mode imaging techniques and their diagnosis and staging abilities could be significantly limited.9,10 For these reasons, noninvasive multi-mode imaging techniques that can repeatedly evaluate liver fibrosis throughout the entire organ hold great promise for a more accurate assessment of the fibrosis burden and progression, and treatment response is desperately needed on a clinical basis.Great efforts have been made to develop a non-invasive and highly effective method for diagnosing and staging liver fibrosis.11–13 However, single-mode image modality provides limited information and cannot meet the requirements of complex disease diagnoses, surgery, and radiation therapy.14 Among the existing techniques, magnetic resonance imaging (MRI) is considered a powerful multi-mode imaging technology, which includes T1 mapping, T2 mapping, magnetic resonance spectroscopy, etc., and can be used to evaluate the patient from different aspects and make cross-validation for diseases.15,16 For example, the T1–T2 dual-mode contrast-enhanced imaging can provide both T1 and T2 information to effortlessly distinguish the focal lesions from the normal tissue with fault-free and self-confirming MR images. The combination of T1 and T2 imaging modes might be a potential strategy since this method can double-check the obtained imaging data, yielding complementary information for sensitive and accurate MRI.17 Furthermore, the measurement of T1 and T2 relaxation times by using T1 and T2 mapping may be more objective and reliable for qualifying the quantitative evaluation of the relaxation time of liver parenchyma in the progression of liver fibrosis.18,19
Superparamagnetic iron oxide (SPIO) with good biosafety and low toxicity is commonly studied as a T2 contrast agent for the liver. However, the negative contrast effect and low signal-to-noise ratio make the widespread application in clinical settings difficult.20 Previous studies have demonstrated that the crystal size, surface coating, and aggregation state of SPIO are significantly related to its relaxivities (r2 and r1) and r2/r1 ratio, and SPIO nanoparticles with appropriate sizes and magnetizations could inherently display both T1 and T2 contrasts.21–23 They found that the ultrafine size of SPIO nanoparticles would lead to T1-dominated contrast efficiency. The T1 effect of SPIO is likely attributed to (i) the reduced magnetization, which diminishes the T2 decaying effect, and (ii) the enhanced surface-to-volume ratio, which provides a large number of paramagnetic centers on the surface.24,25 Moreover, our previous study found that monodisperse ultrafine PEGylated SPIO nanocrystals (SPIO@PEG) have a high T1 relaxivity and a modest r2/r1 ratio (<10) at the magnetic field of 3.0 T and could be potentially used as a T1–T2 dual-modal MRI contrast agent.26 Ultrafine MR nano-contrast agents that combine the advantages of both T1 and T2 imaging modalities could be the key to the highly accurate and sensitive diagnosis and staging of liver fibrosis.
Herein, we have investigated the diagnosis and stage performance of SPIO@PEG nanoparticles as a T1–T2 dual-modal MR contrast agent for liver fibrosis under a clinical 3.0 T MR scanner. Based on the T1 and T2 mapping technology, we first fused the T1 mapping and T2 mapping images to verify the power of the double-checking process in the field of liver fibrosis in the rat model.
2 Materials and methods
2.1 Synthesis of PEGylated ultrafine superparamagnetic iron oxide nanocrystals
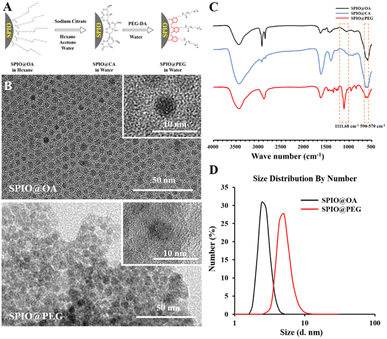
Ultrafine SPIO@PEG was prepared as previously reported.26,27 In brief, hydrophobic SPIO nanocrystals were synthesized by the high-temperature thermal decomposition of iron acetylacetonate, and the small crystal size was obtained by controlling the reaction heating conditions. After that, SPIO nanocrystals were transferred to the aqueous phase by a ligand exchange reaction with sodium citrate. Subsequently, polyethylene glycol dopamine (PEG-DA) was coated on the surface of SPIO nanocrystals in an aqueous environment (for synthesis details, see ESI†). The crystal size and dispersity were examined using transmission electron microscopy (TEM, Thermo Fisher Scientific, USA), selected area electron diffraction (SAED, Thermo Fisher Scientific, USA) and dynamic light scattering (DLS, Malvern Panalytical, UK). Fourier transform infrared spectroscopy (FTIR, Thermo Nicolet, USA) was used to test for the characteristic absorption peak of PEG in SPIO@PEG nanoparticles. The composition of SPIO@PEG was determined by atomic absorption spectroscopy (AAS).2.2 In vitro MRI study of ultrafine SPIO@PEG nanoparticles
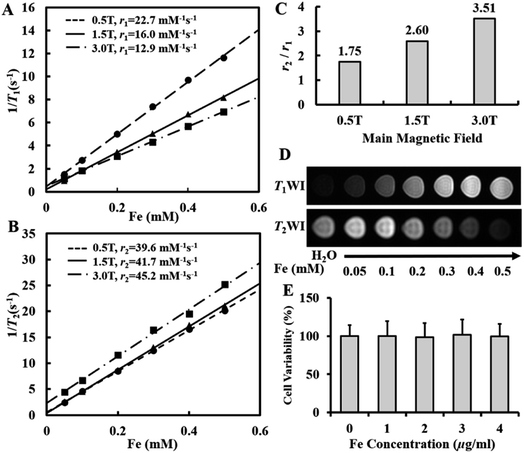
Ultrafine SPIO@PEG aqueous samples with different Fe concentrations (0.05, 0.1, 0.2, 0.3, 0.4, and 0.5 mmol L−1) were prepared and placed in 2 mL test bottles. Longitudinal and transverse relaxation times (T1 and T2) were measured at room temperature at 0.5 T (magnetic resonance developer relaxation rate analyzer, NIUMAG, Suzhou, China), 1.5 T (Minispec Mq60 NMR Analyzer, Bruker, Beijing, China), and 3.0 T (Discovery MR750, GE Medical System, Milwaukee, WI), respectively. The T1 and T2 relaxivities (r1 and r2, mM−1 s−1) were determined by the curve fitting of T1 and T2 vs. Fe concentration. MR imaging of samples was performed under a clinical 3.0 T MR scanner (Discovery MR750, GE Medical System, Milwaukee, WI). Axial images of the phantoms were acquired by T1-weighted spin-echo sequence (repetition time = 200 ms, echo time = 9 ms, matrix = 320 × 320, field of view = 18 × 18 cm, slice thickness = 3 mm, flip angle = 90°) and T2-weighted spin echo sequence (repetition time = 2500 ms, echo time = 100 ms, matrix = 320 × 320, field of view = 18 × 18 cm, slice thickness = 3 mm, flip angle = 90°).2.3 Cytotoxicity assay
Cytotoxicity on the mouse macrophage cell line Raw 264.7 and serum stability of SPIO@PEG were determined in our previous study.20 We further tested the cytotoxicity of SPIO@PEG nanoparticles on hepatic cancer cells (Hep G2). Hep G2 was provided by the Chinese Academy of Sciences Cell Bank (Shanghai, China). The cells were cultured in Dulbecco's Modified Eagle's Medium (DMEM)/high glucose (4.5 g L−1 glucose) containing 10% (v/v) fetal bovine serum (Biological Industries, Israel) and 1% (v/v) penicillin–streptomycin (Hyclone, Logan, UT) at 37 °C, 5% CO2, and saturated humidity. Hep G2 cells were plated in 96-well plates at 4 × 10³ cells per well (100 μL) of complete medium and incubated for 24 h. The cells were added with varying Fe concentrations (5, 10, 15, and 20 μg mL−1) of SPIO@PEG nanoparticles and with subsequent incubation for 24 h. Afterward, to each well was added a 10 μL Cell Counting Kit-8 (CCK-8) solution (Boster Biological Technology, Wuhan, China), followed by incubation at 37 °C for 1 h. The absorbance of the samples was measured using a microplate reader (Thermo Scientific, USA). Cell viability was calculated according to the following equation:| Cell viability (%) = (NS/NC) × 100% | (1) |
2.4 Animal liver fibrosis model
This study has been approved by the Animal Ethics Committee of North Sichuan Medical College (NSMC-2021-79). All experimental procedures were followed in strict accordance with the proposal in the Guide for the Care and Use of Laboratory Animals of the National Institutes of Health. Healthy male Sprague-Dawley (SD) rats (180–200 g and 6–7 weeks old) were obtained from the Experimental Animal Center of our institute. Twenty-eight rats were randomly divided into the control group and four experimental groups. The control group rats (n = 7) were fed a standard commercial diet. The four experimental groups were fed a 0.1% 3,5-diethoxycarbonyl-1,4-dihydro-collidine (DDC) supplemented diet (Tokyo Chemical Industry, Co., Ltd, Tokyo, Japan) for 1 week, 4 weeks, 8 weeks and 12 weeks, respectively, to build different stages of the biliary liver fibrotic model.28 All animals were raised at 23 ± 3 °C with a 12 h:12 h light/dark cycle and tap water ad libitum.2.5 In vivo MR imaging
All MR imaging was performed using a 3.0 T MRI scanner (GE Healthcare, MR750 Medical System, Milwaukee, WI). The rats were anesthetized via the inhalation of isoflurane (RWD Life Science, Shenzhen, China) with a face mask (anesthetic conc.: 1.0–1.5%; 20–30 mL O2 per kg) and transferred to the MR scanner. A custom-made animal receiver coil was used to obtain the MR images. MRI scans were carried out before (pre) and immediately after (post) SPIO@PEG intravenous injection at a dose of 2.5 mg (Fe concentration) kg−1 body weight through the tail veins of the rats. Conventional T1 and T2 weighted MR imaging was also performed pre- and post-contrast injection, and the detailed parameters of T1 and T2-weighted sequences were as follows: T1 weighted imaging (gradient recalled echo sequence, repetition time (TR) = 9 ms, echo time (TE) = 3 ms, flip angle (FA) = 30°, field of view (FOV) = 80 × 80 mm); T2 weighted imaging (fast spin echo sequence, TR = 4000 ms, TE = 76 ms, FA = 90°, FOV = 80 × 80 mm and slice thickness = 2.0 mm).T1 mapping images were acquired by using the variable flip angle (VFA) technique29 that contains a series of rat liver acquisition volume accelerations (LAVA) with five different flip angles (3, 6, 9, 12, and 15°). The following are the MR imaging parameters: TR = 5.0 ms, TE = 2.4 ms, number of excitations = 4, FOV = 80 × 80 mm, matrix = 512 × 512, reconstruction matrix = 400 × 400, bandwidth = 83.33 Hz per pixel, slice thickness = 0.8 mm. T2 mapping images were acquired by using free-breathing fast spin echo (FES) sequences; the detailed parameters were as follows: TR = 1200 ms, TE = 8, 16, 24, 32, 40, 48, 56, and 64 ms, number of excitations = 2, FA = 90°, FOV = 80 × 80 mm, matrix = 512 × 512, reconstruction matrix = 400 × 400, bandwidth = 166.67 Hz per pixel, thickness = 2.0 mm, slice space = 0.6 mm.
2.6 Image analysis
Two radiologists with diagnosis experience of three and fourteen, respectively, performed image analyses; they were blinded to both the animal groups and pathological results of this study. The conventional T1 and T2 weighted MR images, including the pre- and post-contrast images, were presented on a picture archiving and communication system (PACS; GE Advantage Workstation Version 4.4-09, Sun Microsystems, Palo Alto, CA, USA) with an optimal window setting adjustment. Subsequently, we measured each experimental rat's signal-to-noise ratio (SNR = mean signal intensity of the liver/background noise). Furthermore, based on the SNR measurements, the contrast-to-noise ratio (ΔCNR = abs(SNRpre − SNRpost)) as described by Siedek F. et al.30 was calculated for each rat, including T1 and T2 weighted MR images pre- and post-SPIO@PEG enhancement (ΔCNR-T1 and ΔCNR-T2, respectively).T1 mapping and T2 mapping images, including pre- and post-contrast images, were transferred to the matrix laboratory (MATLAB, version 9.7 (R2019b), Mathworks, USA) for the next analysis. T1 relaxation times were measured by the VFA method, which has been demonstrated by Deoni S. C. et al.29 (Fig. S2, see ESI†). T2 relaxation times were calculated by a monoexponential function model, which was used to fit the T2 signal versus echo time (TE) decay curve31 (Fig. S3, see ESI†). Three regions of interest (ROIs) of one section were respectively drawn within the liver parenchyma and constantly measured on five liver sections of each rat, avoiding confounding factors like biliary structures, vessels, and organ boundaries. The size of ROI was controlled within 0.8–1.2 cm2. The ROIs were first placed into the pre-contrast T1 and T2 mapping, then the ROIs were copied and placed on the same area on post-contrast relaxation maps for each rat. Mean T1 and T2 values were used for further analyses. The decreasing rates of T1 relaxation time (ΔT1%) and T2 relaxation time (ΔT2%) were calculated as follows:
| ΔT1% = (T1pre − T1post)/T1pre × 100% | (2) |
| ΔT2% = (T2pre − T2post)/T2pre × 100% | (3) |
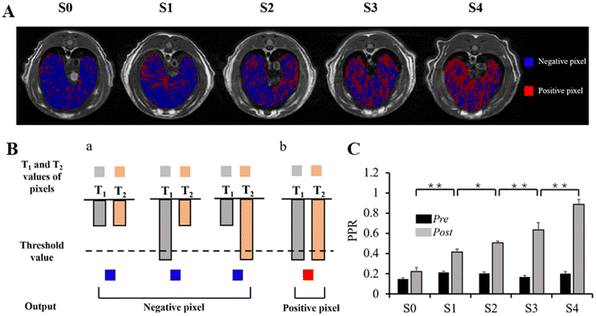
Based on the calculated relaxation time of T1 and T2, we adapted the T1 mapping and T2 mapping sequences for the T1–T2 dual-mode image fusion (Fig. S3, see ESI†). Firstly, we associated the T1 mapping and T2 mapping images with image registration. Secondly, the pixels of ROIs in these two sequences were divided and colored via a “logic gate” (Fig. 7B). Thirdly, the number of positive pixels and all the pixels in ROIs were measured to calculate the PPR (PPR = the number of positive pixels/all the pixels in ROI). It is worth noting that the threshold value of the logic gate was defined as subtracting the mean reduction value of T1 and T2 values from the corresponding pre-contrast-enhanced T1 and T2 values. All the image fusion analyses were performed by using MATLAB.
2.7 Statistical analysis
All the quantitative data are shown as mean ± standard deviation. All the statistical analyses were performed by using SPSS commercial software (SPSS version 26.0, SPSS Inc., Chicago, IL). The Shapiro–Wilk test was used to analyse the distribution type, in which the parameters resulted in an approximately normal distribution. Spearman's ranked correlation test was used to investigate the correlation between the ΔCNR (ΔCNR-T1 and ΔCNR-T2), relaxation time parameters (T1 values, T2 values, ΔT1%, and ΔT2%), PPR, and pathological liver fibrosis stages. Unpaired Student's t-test or one-way analysis of variance (ANOVA) was used to compare the mean variance between different fibrosis groups. The intraclass correlation coefficient (ICC) was used to test the consistency of signal intensity and relaxation time measurements of the two observers; ICC values less than 0.5, between 0.5 and 0.75, between 0.75 and 0.90, and greater than 0.90 represent poor, moderate, good, and excellent repeatability, respectively.33 All tests were two-tailed, with P values less than 0.05 being considered statistically significant.2.8 Histopathological analysis
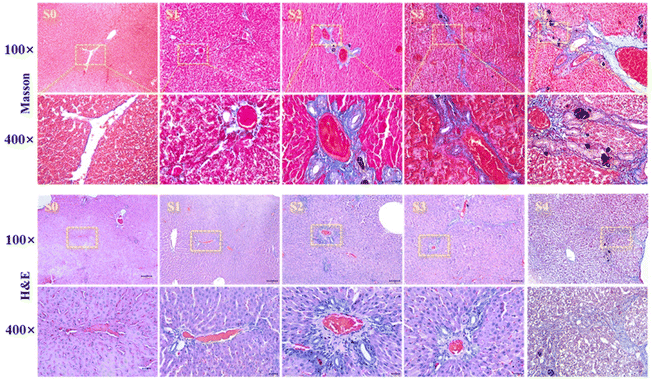
After the MRI examination, animals were sacrificed by cervical dislocation under deep anesthesia with isoflurane, and the livers were removed and immediately fixed in 10% formalin. All the liver samples were stained with hematoxylin–eosin (HE) stain, Masson's trichrome stain, and Prussian blue stain. Pathologic analysis was regarded as the reference standard for staging rat liver fibrosis according to the METAVIR classification score system,34 in which S0 = no fibrosis, S1 = portal fibrosis without septa, S2 = portal fibrosis and a few septa, S3 = numerous septa without cirrhosis, and S4 = cirrhosis. A pathologist with five years of experience in the diagnosis of liver pathology evaluated the stage of liver fibrosis (S0–S4) based on the standard classification mentioned before.3 Results
3.1 Synthesis and characterization of ultrafine PEGylated superparamagnetic iron oxide
Ultrafine hydrophobic SPIO nanocrystals were synthesized by high-temperature thermal decomposition and were transferred to the aqueous phase by ligand exchange reaction (Fig. 1A). The SAED pattern of the SPIO@PEG nanocrystals is shown in Fig. S1 (ESI†). The measured lattice spacing was based on the rings in the diffraction pattern conforming to the known lattice spacing of Fe3O4 crystals from the PDF database. As shown in Fig. 1B, the SPIO nanocrystals have an ultrafine particle size (crystal size: 4.01 ± 0.16 nm in hexane and 5.21 ± 0.08 in water) in TEM and maintained good mono-dispersion before and after being coated with PEG-DA. FTIR spectroscopy was used to characterize the surface coating of PEG. As shown in Fig. 1C, the band around 570–590 cm−1 was attributed to the Fe–O stretching vibrations of the magnetite lattice. The presence of the peak at 1111.68 cm−1 was assigned to the asymmetric and symmetric stretching vibrations of ACH2 of PEG-DA.35 DLS was used to detect the hydrodynamic size distribution of the SPIO nanocrystals in hexane and PEGylated SPIO in the aqueous solution (Fig. 1D). In solution, SPIO nanoparticles had a narrow hydrodynamic size distribution, and the particle size slightly increased after PEGylation (the number average size increased from 3.19 ± 1.13 nm to 6.86 ± 2.99 nm). All the results confirmed the successful preparation of ultrafine SPIO@PEG nanoparticles. The iron concentration of SPIO@PEG aqueous solution was determined by AAS and used in subsequent experiments.3.2 Relaxivity of ultrafine SPIO@PEG nanoparticles
To quantitively evaluate the T1 and T2 dual-modal MRI contrast effect of the ultrafine SPIO@PEG, the relaxivities (r1 and r2) of aqueous samples were measured at three main different magnetic fields (0.5, 1.5, and 3.0 T). As shown in Fig. 2A and B, the ultrafine SPIO@PEG simultaneously has high r1 and r2. However, r1 decreased with the increase of the magnetic field (from 0.5 to 3.0 T), while r2 increased across the same magnetic field range, leading to the increase of the r2/r1 ratio. Significantly, the r2/r1 ratio of SPIO@PEG is 3.51 at 3.0 T, indicating that this SPIO@PEG is a T1–T2 dual-modal contrast agent at 3.0 T (Fig. 2C).23 To further confirm this, FSE T1WI and T2WI of SPIO@PEG aqueous samples were carried out using a 3.0 T clinical MRI scanner to study the T1–T2 dual-modal enhancement in vitro. As shown in Fig. 2D, the MRI signal intensity tends to increase with the increase of concentration in SE T1WI, while in SE T2WI, the signal intensity tends to decrease with the increase of Fe concentration. These results confirm that ultrafine SPIO@PEG can be a proper T1–T2 dual-modal contrast agent with the 3.0 T MRI scanner.3.3 Cytotoxicity assay
The toxicity of SPIO@PEG was evaluated by the cell viability assay and the cytotoxicity was estimated using Cell Counting Kit-8. SPIO@PEG nanoparticles did not show appreciable cytotoxicity at different drug loading concentrations, and there was no statistically significant difference (P > 0.05) compared with the blank group (without SPIO@PEG nanoparticles) as shown in Fig. 2E. All these results indicate that the ultrafine SPIO@PEG has reliable biocompatibility.3.4 Animal model establishment and pathological results
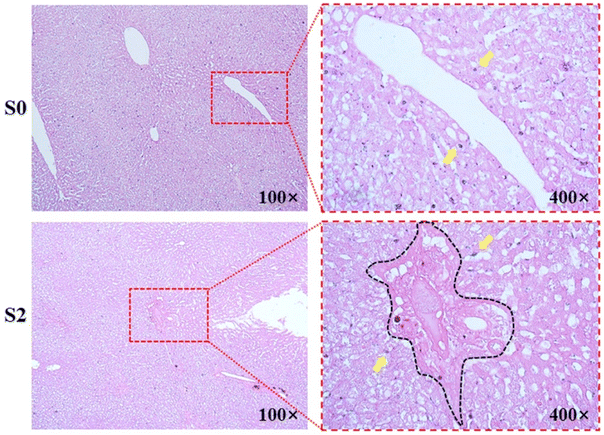
A total of twenty-eight rats were enrolled in this study. Based on the pathological liver fibrosis stage principle,28 five rats were diagnosed with stage I liver fibrosis (S1), five rats were diagnosed with stage II (S2), five rats were diagnosed with stage III (S3), and six rats were diagnosed with stage IV (S4). Seven normal rats comprised the control group. Histologic analysis with HE staining and Masson's trichrome staining demonstrated uneven distributions of liver fibrosis in the experimental rats as shown in Fig. 3.3.5 In vivo contrast-enhanced MRI of liver fibrosis in the rat model
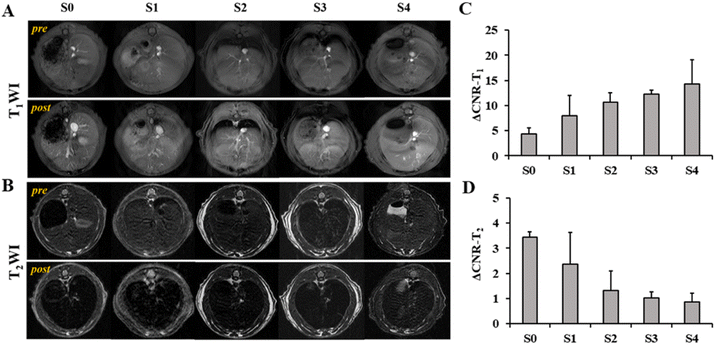
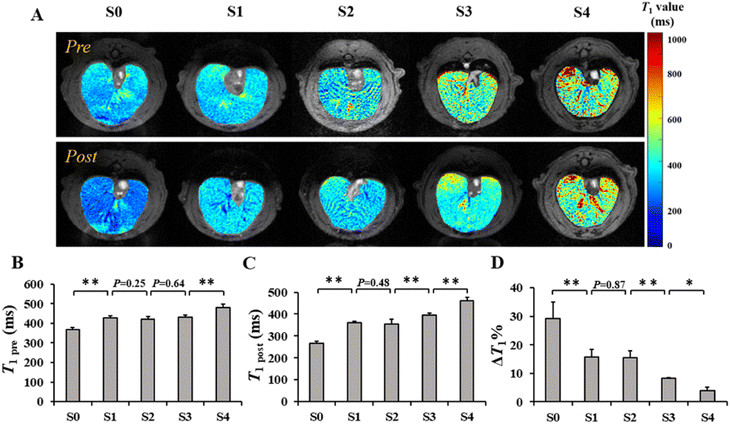
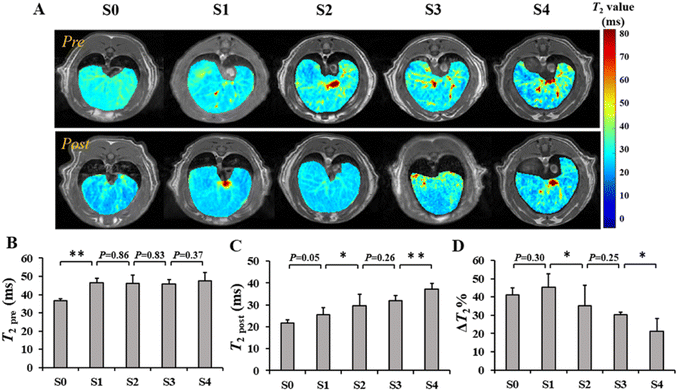
To investigate the performance of SPIO@PEG in the MRI enhancement of liver fibrosis stages, axial T1 and T2 weighted imaging of rat livers was obtained under a 3.0 T MRI scanner before and after the administration of the ultrafine SPIO@PEG through the tail vein. Fig. 4A shows the T1-weighted MR imaging at different stages of liver fibrosis (S0 to S4). The post-enhanced images were brighter than the pre-contrast-enhanced images among all the groups. For the T2-weighted MR imaging, the post-enhanced images were darker than the pre-contrast-enhanced images among the same groups (Fig. 4B). However, it failed to discriminate the different stages of liver fibrosis from visual inspection. Subsequently, we measured the SNR and CNR of liver parenchyma and quantitatively analysed the CNR changes of each rat in the two imaging modes (ΔCNR-T1, ΔCNR-T2). The results are shown in Fig. 4C and D. The ΔCNR-T1 gradually increased with the progression of liver fibrosis; on the contrary, the ΔCNR-T2 gradually decreased with the same range of liver fibrosis. Both parameters can be used to discriminate the non-fibrotic liver and stages (S ≥ 2) of liver fibrosis. However, it is challenging for these two parameters to distinguish adjacent stages of liver fibrosis.The axial T1 and T2 mapping images were acquired, including pre- and post-injection of SPIO@PEG for all experimental rats. Fig. 5A and 6A have depicted that all the T1 and T2 mapping images display regular changes with the progression of liver fibrosis. Post-intravenous injection of SPIO@PEG, all the T1 and T2 values were decreased to different degrees (Fig. 5C and 6C). Moreover, both ΔT1% and ΔT2% decreased with the range of fibrosis stages (S0 to S4). The image fusion procession result showed that after the intravenous injection of SPIO@PEG, the PPR gradually increased with the progression of liver fibrosis. The pre-contrast enhanced PPR did not show any regular changes among the different stages of liver fibrosis (Fig. 7C).
For statistical analysis, Spearman's correlation test depicted positive correlations between the pre- and post-contrast T1 and T2 values and liver fibrosis stages (r = 0.867 and 0.940 for T1 value, r = 0.608 and 0.888 for T2 value, respectively, P < 0.001). PPR also showed positive correlations and liver fibrosis stages (r = 0.979, P < 0.001). Conversely, the ΔT1% and ΔT2% were negatively correlated to liver fibrosis stages (r = −0.943 and −0.784, respectively, P < 0.001) (Table 1).
| Parameter | r | P | |||||||||||||||||||||||||||||||||||||||||||||||||||||||||||||||||||||||||||||||||||||||||||||||||
|---|---|---|---|---|---|---|---|---|---|---|---|---|---|---|---|---|---|---|---|---|---|---|---|---|---|---|---|---|---|---|---|---|---|---|---|---|---|---|---|---|---|---|---|---|---|---|---|---|---|---|---|---|---|---|---|---|---|---|---|---|---|---|---|---|---|---|---|---|---|---|---|---|---|---|---|---|---|---|---|---|---|---|---|---|---|---|---|---|---|---|---|---|---|---|---|---|---|---|---|
| a ΔT1% = [(T1pre − T1post)/T1pre] × 100%, ΔT2% = [(T2pre − T2post)/T2pre] × 100%, PPR = positive pixel ratio. | |||||||||||||||||||||||||||||||||||||||||||||||||||||||||||||||||||||||||||||||||||||||||||||||||||
| T1pre | 0.876 | <0.001 | |||||||||||||||||||||||||||||||||||||||||||||||||||||||||||||||||||||||||||||||||||||||||||||||||
| T1post | 0.94 | <0.001 | |||||||||||||||||||||||||||||||||||||||||||||||||||||||||||||||||||||||||||||||||||||||||||||||||
| ΔT1% | −0.943 | <0.001 | |||||||||||||||||||||||||||||||||||||||||||||||||||||||||||||||||||||||||||||||||||||||||||||||||
| T1pre | 0.608 | <0.001 | |||||||||||||||||||||||||||||||||||||||||||||||||||||||||||||||||||||||||||||||||||||||||||||||||
| T2post | 0.888 | <0.001 | |||||||||||||||||||||||||||||||||||||||||||||||||||||||||||||||||||||||||||||||||||||||||||||||||
| ΔT2% | −0.784 | <0.001 | |||||||||||||||||||||||||||||||||||||||||||||||||||||||||||||||||||||||||||||||||||||||||||||||||
| PPR | 0.979 | <0.001 | |||||||||||||||||||||||||||||||||||||||||||||||||||||||||||||||||||||||||||||||||||||||||||||||||
Based on Spearman's correlation test, the mean differences among different liver fibrosis subgroups were determined by one-way ANOVA. For the pre-contrast T1 and T2 parameters, there were significant differences between the control group (S0) and any other fibrotic groups. However, there were no statistical differences between the adjacent groups (P < 0.05), especially among the S1, S2, and S3 subgroups (Fig. 5D and 6D). After intravenous administration of SPIO@PEG, the differences between the S2 and S3 were shown in the post-contrast T1 values, and for S1 and S2 in post-contrast T2 values. Nonetheless, single T1 or T2 parameters could not independently discriminate the stage of liver fibrosis. Moreover, the ΔT1% and ΔT2% were also tested by one-way ANOVA. Interestingly, the ΔT1% differences between S0 and S1, and S2 and S3; S3 and S4 were significantly different but it was not significant between S1 and S2 stages (Fig. 5D). Notably, ΔT2% showed a statistically significant difference between the liver fibrosis groups of S1 and S2 (P < 0.05) (Fig. 6D). Nevertheless, these two parameters cannot independently distinguish the different stages of liver fibrosis. For PPR analysis, there was a significant difference among all the subgroups of liver fibrosis (Fig. 7A and C). Compared with the control group (S0), other groups exhibited higher PPR, which increased from 0.22 ± 0.04 to 0.89 ± 0.05 with the progression of liver fibrosis.
3.6 Repeatability and reproducibility
The ICCs of the parameters including ΔCNR-T1, ΔCNR-T2, T1 and T2 pre- and post-contrast were carried out between the two observers. All the parameters showed good or excellent inter-observer agreement with repeatability and reproducibility. The ΔCNR-T1, ΔCNR-T2, pre- and post-contrast enhanced T1 and T2 relaxation times, and PPR had ICC values of 0.932, 0.943, 0.912, 0.923, 0.876, 0.897, and 0.927, respectively.3.7 Distribution of iron nanoparticles
According to the pathological results of Prussian blue staining, the liver specimen of the control group demonstrated that the deposition of iron nanoparticles is mainly distributed in the region of the portal track and its adjacent hepatic sinus. However, iron nanoparticles are mainly deposited along the edge fibrotic septa in fibrotic groups, and few iron nanoparticles can have access to the fibrotic septa as shown in Fig. 8.4 Discussion
The crucial element of liver fibrosis treatment efficiency relies on precise diagnosis and stage methods. T1–T2 dual-modal ultrafine SPIO@PEG enhanced MRI provides a non-invasive approach that combines both T1 and T2 contrast-enhanced information that may improve the diagnosis and staging of liver fibrosis.This present study confirmed a strong correlation between the relaxation times of the liver fibrosis stages. Additionally, the results showed that both T1 and T2 relaxation times were consistently elevated with the progression of hepatic fibrosis in rats. Several human and animal studies have demonstrated that fibrosis could prolong the T1 and T2 relaxation times of the liver.36–38 The prolonged T1 and T2 relaxation times were possibly caused by the pathophysiological alterations associated with activated liver fibrogenesis, characterized by inflammation, edema, and the excess deposition of extracellular matrix (ECM) with the degree of fibrosis.39 In histology, biliary liver fibrosis is characterized by chronic cholangitis and mainly affects septal and interlobular bile ducts.40 Fibrogenesis in chronic cholestatic liver diseases could be seen as a classic chronic wound-healing reaction that could directly activate fibrogenesis in liver parenchyma.41 In the early stages, the liver parenchyma shows an intense inflammatory reaction. Moreover, the interlobular bile ducts are surrounded and infiltrated by immune/inflammatory cells causing structural damage and peribiliary stromal expansion, which could lead to a slightly higher T1 value in S1 than S2;42 the portal venules are then compressed and occluded by the inflammatory reaction. In later stages, the inflammation extends to the lobule, causing the formation of fibrous septa and collagenous fiber. The pattern of collagenous fiber accumulation can be characterized by increased expression of several collagenous and non-collagenous extracellular matrix (ECM) components.43 Collagen deposition could be the main significant influencing factor for the elevated unenhanced measurement of T1 and T2 values, as well as PPR. Unfortunately, our study revealed that the liver parenchyma's unenhanced T1 and T2 relaxation times could not accurately differentiate the liver fibrosis stages.
After intravenous administration of ultrafine SPIO@PEG nanoparticles, we found that both T1 and T2 values decreased by different degrees among the different liver fibrosis stages. Our study firstly demonstrated that the reduction rate of T1 (ΔT1%) and T2 (ΔT2%) both gradually decreased with the severity of the stages of biliary liver fibrosis (from S0 to S4) under T1–T2 dual-modal ultrafine SPIO@PEG enhanced MR images. Furthermore, the results showed significant differences between each set of adjacent hepatic fibrosis subgroups, providing potential biomarkers in precisely staging biliary liver fibrosis. However, these two parameters cannot independently distinguish the different fibrosis stages. Based on the study results of T1 and T2 values, we creatively fused the T1 and T2 mapping images and quantitively measured the PPR of each rat. Compared with the control group (S0), other groups exhibited higher PPR. Moreover, significant differences were observed among the different groups. These results collectively demonstrated the highly effective T1–T2 dual-mode SPIO@PEG diagnosis and staging ability for liver fibrosis.
According to the Prussian blue staining of the liver specimen after the administration of SPIO@PEG nanoparticles, we found that the iron particles were mainly deposited along the edges of fibrotic septa in fibrotic rats. The deposition of collagen fibers takes up space in the perisinusoidal space (space of Disse), leading to a variety of iron nanoparticle distributions among different fibrotic objects. The alteration of iron nanoparticle distribution leads to changes in both MR signal intensity and relaxation times among different fibrosis stages.44 In contrast, the deposition of iron particles in the healthy liver (S0) was randomly distributed in the hepatic sinus where HSCs most commonly reside, after the administration of SPIO@PEG, on which the collagen deposition could not have an influence.
In this study, SPIO@PEG-enhanced T1-weighted MR imaging showed a higher ΔCNR across the range of fibrosis stages S0 to S4, while the ΔCNR of T2 became lower across the same range of fibrosis stages at 3.0 T. Tanimoto A.45 reported that patients with chronic liver cirrhosis showed less signal intensity loss for background liver because of the poor phagocytic activity due to Kupffer cell dysfunction and therefore, the cirrhotic liver is superior as compared with the non-cirrhotic liver. We believe that the normal phagocytic function of Kupffer cells in the non-fibrotic liver can be attributed to the more significant signal intensity loss of liver parenchyma, and the incomplete phagocytic function of Kupffer cells in the fibrotic liver can be attributed to the improvement in the SNR of post-contrast T1 weighted MR images, resulting in higher ΔCNR-T1. On the contrary, based on the blank hole effect of SPIO, the poor phagocytic activity of Kupffer cells in the fibrotic liver could result in a lower ΔCNR-T2 than non-fibrotic liver on T2-weighted MR images.
There are some advantages to our study. Firstly, the T1–T2 dual-modal magnetic resonance imaging combined with image fusion could avoid the false-positive signals caused by a single imaging mode and supply complementary and more accurate information for the diagnosis and staging of diseases. Secondly, in order to remove the influence of liver steatosis and ensure timely resolution, we selected the LAVA sequence to access the T1 and T2 values. VFA T1 mapping has been widely studied as a potential clinical application in detecting and diagnosing liver fibrosis.46 VFA T1 mapping was first introduced by Fram et al., which is based on a series of T1-weighted spoiled gradient echo sequences with different flip angles.47 At least two flip angles are required to calculate the T1 relaxation time. However, the method of two flip angles could potentially decrease the accuracy and increase the estimation error of the T1 value.48 In this study, we used five flip angles to calculate the T1 relaxation time, which could minimize the estimation error and increase the reliability of T1 values. According to the study by Li et al.36 VFA T1 mapping is a non-invasive, reliable, and accurate imaging method for assessing experimental liver fibrosis in rodents. Compared with ultrasound elastography, it provides similar good repeatability and reproducibility, similarly high accuracy for staging fibrosis, and significantly better accuracy for detecting fibrosis regression. Thirdly, we used a 3.0 T scanner instead of a 1.5 T MR scanner for this study. The T1 and T2 values obtained with a 3.0 T scanner can be more accurate than with a 1.5 T scanner, which results in more reliable and accurate T1 and T2 values measurements in fibrotic or healthy livers. Finally, the ultrafine SPIO@PEG is a suitable T1–T2 dual-mode MRI contrast agent, even if there is a time lag in T1–T2 dual-mode imaging scanning, due to its long circulation time in vivo as found in our previous study.26
The combination of T1 and T2 mapping can integrate the high tissue resolution and high time resolution of T1 mode contrast imaging and the high feasibility of soft tissue detection of T2 mode contrast imaging.
5 Conclusions
In conclusion, we have successfully synthesized T1–T2 dual-modal ultrafine SPIO@PEG nanoparticles and applied them in the diagnosis and discrimination of the different stages of DDC-induced biliary liver fibrosis in the rat model. For the first time, we have demonstrated that the PPR calculated by the image fusion of T1 and T2 mapping could be used to discriminate different stages of biliary liver fibrosis. Furthermore, the PPR might be a noninvasive biomarker to distinguish the different stages of biliary liver fibrosis, which could be a promising non-invasive method to monitor the liver fibrosis progression and therapeutic response to the antifibrotic treatment.Author contributions
Conceptualization, methodology, investigation, data curation, writing original draft, FLL; methodology, data curation, investigation, LD; methodology, validation, WC, HJ, YP, CWY and JW; methodology, resources, validation, TWC; resources, project administration, XMZ; supervision, writing review and editing, funding acquisition, project administration, CQW; all authors have read and agreed to the published version of the manuscript.Conflicts of interest
There are no conflicts to declare.Acknowledgements
The work was supported by National Natural Science Foundation of China (81601490), Natural Science Foundation of Sichuan Province (2022NSFSC0636), Science and Technology Project of Municipal School Strategic Cooperation, Nanchong (20SXQT0306), Pre-research Project of North Sichuan Medical College (CBY19-YZ05), Open Research Program of Antibiotic Research and Reevaluation Key Laboratory of Sichuan Province (ARRLKF20-03).References
- R. Bataller and D. A. Brenner, J. Clin. Invest., 2005, 115, 209–218 CrossRef CAS PubMed.
- M. Pinzani, M. Rosselli and M. Zuckermann, Best Pract. Res., Clin. Gastroenterol., 2011, 25, 281–290 CrossRef CAS PubMed.
- A. Ortiz-Perez, B. Donnelly, H. Temple, G. Tiao, R. Bansal and S. K. Mohanty, Front. Immunol., 2020, 11, 329 CrossRef CAS PubMed.
- S. Sakiani, D. E. Kleiner, T. Heller and C. Koh, Clin. Liver Dis., 2019, 23, 263–277 CrossRef PubMed.
- C. Corpechot, F. Carrat, R. Poupon and R. E. Poupon, Gastroenterology, 2002, 122, 652–658 CrossRef CAS PubMed.
- L. Castera, Expert Rev. Gastroenterol. Hepatol., 2008, 2, 541–552 CrossRef CAS PubMed.
- G. Germani, P. Hytiroglou, A. Fotiadu, A. K. Burroughs and A. P. Dhillon, Semin. Liver Dis., 2011, 31, 82–90 CrossRef PubMed.
- P. C. Tien, M. Duarte, A. Roque and J. Price, Dig. Dis. Sci., 2020, 65, 928–930 CrossRef PubMed.
- S. Sharma, K. Khalili and G. C. Nguyen, World J. Gastroenterol., 2014, 20, 16820–16830 CrossRef PubMed.
- U. Agbim and S. K. Asrani, Expert Rev. Gastroenterol. Hepatol., 2019, 13, 361–374 CrossRef CAS PubMed.
- S. A. Harrison, V. Ratziu, J. Boursier, S. Francque, P. Bedossa, Z. Majd, G. Cordonnier, F. B. Sudrik, R. Darteil, R. Liebe, J. Magnanensi, Y. Hajji, J. Brozek, A. Roudot, B. Staels, D. W. Hum, S. J. Megnien, S. Hosmane, N. Dam, P. Chaumat, R. Hanf, Q. M. Anstee and A. J. Sanyal, Lancet Gastroenterol. Hepatol., 2020, 5, 970–985 CrossRef PubMed.
- N. Perakakis, K. Stefanakis and C. S. Mantzoros, Metabolism, 2020, 111S, 154320 CrossRef PubMed.
- R. Masuzaki, T. Kanda, R. Sasaki, N. Matsumoto, M. Ogawa, S. Matsuoka, S. J. Karp and M. Moriyama, Int. J. Mol. Sci., 2020, 21, 4906 CrossRef CAS PubMed.
- Y. Yang, J. Wu, S. Huang, Y. Fang, P. Lin and Y. Que, IEEE J. Biomed. Health Inform., 2019, 23, 1647–1660 Search PubMed.
- R. Zhao, G. Hamilton, J. H. Brittain, S. B. Reeder and D. Hernando, Magn. Reson. Med., 2021, 85, 734–747 CrossRef CAS PubMed.
- R. Zhao, D. Hernando, D. T. Harris, L. A. Hinshaw, K. Li, L. Ananthakrishnan, M. R. Bashir, X. Duan, M. A. Ghasabeh, I. R. Kamel, C. Lowry, M. Mahesh, D. Marin, J. Miller, P. J. Pickhardt, J. Shaffer, T. Yokoo, J. H. Brittain and S. B. Reeder, Med. Phys., 2021, 48, 4375–4386 CrossRef PubMed.
- J. Wang, Y. Jia, Q. Wang, Z. Liang, G. Han, Z. Wang, J. Lee, M. Zhao, F. Li, R. Bai and D. Ling, Adv. Mater., 2021, 33, e2004917 CrossRef PubMed.
- M. T. Long and E. J. Benjamin, Circ.: Cardiovasc. Imaging, 2018, 11, e007553 Search PubMed.
- S. Pan, X. Q. Wang and Q. Y. Guo, World J. Gastroenterol., 2018, 24, 2024–2035 CrossRef CAS.
- Y. D. Xiao, R. Paudel, J. Liu, C. Ma, Z. S. Zhang and S. K. Zhou, Int. J. Mol. Med., 2016, 38, 1319–1326 CrossRef CAS PubMed.
- W. Xie, Z. Guo, F. Gao, Q. Gao, D. Wang, B. S. Liaw, Q. Cai, X. Sun, X. Wang and L. Zhao, Theranostics, 2018, 8, 3284–3307 CrossRef CAS PubMed.
- M. Doig, C. P. Warrens and P. J. Camp, Langmuir, 2014, 30, 186–195 CrossRef CAS PubMed.
- Z. Zhou, R. Bai, J. Munasinghe, Z. Shen, L. Nie and X. Chen, ACS Nano, 2017, 11, 5227–5232 CrossRef CAS.
- Z. Zhou, Z. Zhao, H. Zhang, Z. Wang, X. Chen, R. Wang, Z. Chen and J. Gao, ACS Nano, 2014, 8, 7976–7985 CrossRef CAS.
- Z. Zhou, C. Wu, H. Liu, X. Zhu, Z. Zhao, L. Wang, Y. Xu, H. Ai and J. Gao, ACS Nano, 2015, 9, 3012–3022 CrossRef CAS PubMed.
- L. H. Deng, H. Jiang, F. L. Lu, H. W. Wang, Y. Pu, C. Q. Wu, H. J. Tang, Y. Xu, T. W. Chen, J. Zhu, C. Y. Shen and X. M. Zhang, Int. J. Nanomed., 2021, 16, 201–211 CrossRef.
- S. Sun, H. Zeng, D. B. Robinson, S. Raoux, P. M. Rice, S. X. Wang and G. Li, J. Am. Chem. Soc., 2004, 126, 273–279 CrossRef CAS.
- P. Fickert, U. Stoger, A. Fuchsbichler, T. Moustafa, H. U. Marschall, A. H. Weiglein, O. Tsybrovskyy, H. Jaeschke, K. Zatloukal, H. Denk and M. Trauner, Am. J. Pathol., 2007, 171, 525–536 CrossRef CAS PubMed.
- S. C. Deoni, B. K. Rutt and T. M. Peters, Magn. Reson. Med., 2003, 49, 515–526 CrossRef PubMed.
- F. Siedek, A. M. Muehe, A. J. Theruvath, R. Avedian, A. Pribnow, S. L. Spunt, T. Liang, C. Farrell and H. E. Daldrup-Link, Eur. Radiol., 2020, 30, 1790–1803 CrossRef CAS PubMed.
- M. Beaumont, I. Odame, P. S. Babyn, L. Vidarsson, M. Kirby-Allen and H. L. Cheng, J. Magn. Reson. Imaging, 2009, 30, 313–320 CrossRef PubMed.
- R. F. Sheng, H. Q. Wang, L. Yang, K. P. Jin, Y. H. Xie, C. X. Fu and M. S. Zeng, Dig. Liver Dis., 2017, 49, 789–795 CrossRef CAS PubMed.
- T. K. Koo and M. Y. Li, J. Chiropr. Med., 2016, 15, 155–163 CrossRef PubMed.
- T. Poynard, P. Bedossa and P. Opolon, Lancet, 1997, 349, 825–832 CrossRef CAS PubMed.
- G. Prabha and V. Raj, Biomed. Pharmacother., 2016, 80, 173–182 CrossRef CAS PubMed.
- J. Li, H. Liu, C. Zhang, S. Yang, Y. Wang, W. Chen, X. Li and D. Wang, Eur. Radiol., 2020, 30, 337–345 CrossRef PubMed.
- J. A. Luetkens, S. Klein, F. Traber, F. C. Schmeel, A. M. Sprinkart, D. L. R. Kuetting, W. Block, F. E. Uschner, R. Schierwagen, K. Hittatiya, G. Kristiansen, J. Gieseke, H. H. Schild, J. Trebicka and G. M. Kukuk, Radiology, 2018, 288, 748–754 CrossRef PubMed.
- A. M. Chow, D. S. Gao, S. J. Fan, Z. Qiao, F. Y. Lee, J. Yang, K. Man and E. X. Wu, J. Magn. Reson. Imaging, 2012, 36, 152–158 CrossRef PubMed.
- D. H. Hoffman, A. Ayoola, D. Nickel, F. Han, H. Chandarana and K. P. Shanbhogue, Abdom. Radiol., 2020, 45, 692–700 CrossRef PubMed.
- M. Pinzani and T. V. Luong, Biochim. Biophys. Acta, Mol. Basis Dis., 2018, 1864, 1279–1283 CrossRef CAS PubMed.
- N. S. Ghonem, D. N. Assis and J. L. Boyer, Hepatology, 2015, 62, 635–643 CrossRef CAS PubMed.
- A. F. Gulamhusein and G. M. Hirschfield, Nat. Rev. Gastroenterol. Hepatol., 2020, 17, 93–110 CrossRef PubMed.
- A. Lleo, S. Marzorati, J. M. Anaya and M. E. Gershwin, Hepatol. Int., 2017, 11, 485–499 CrossRef PubMed.
- J. Y. He, W. H. Ge and Y. Chen, World J. Gastroenterol., 2007, 13, 2061–2065 CrossRef CAS PubMed.
- A. Tanimoto, Y. Yuasa, H. Shinmoto, M. Jinzaki, Y. Imai, S. Okuda and S. Kuribayashi, Radiology, 2002, 222, 661–666 CrossRef PubMed.
- Y. Choi, J. Huh, D. C. Woo and K. W. Kim, Br. J. Radiol., 2016, 89, 20150666 CrossRef PubMed.
- E. K. Fram, R. J. Herfkens, G. A. Johnson, G. H. Glover, J. P. Karis, A. Shimakawa, T. G. Perkins and N. J. Pelc, Magn. Reson. Imaging, 1987, 5, 201–208 CrossRef CAS PubMed.
- H. Kuribayashi, M. Sekino, T. Minowa, Y. Maitani, H. Ohsaki, S. Tsushima, S. Hirai, M. Ueda and Y. Katayama, J. Magn. Reson. Imaging, 2013, 38, 1245–1250 CrossRef PubMed.
Footnote |
| † Electronic supplementary information (ESI) available. See DOI: https://doi.org/10.1039/d2ra05913d |
| This journal is © The Royal Society of Chemistry 2022 |

