 Open Access Article
Fluorination effects on bithiophene unit in benzodithiophene-4,8-dione based D–A type alternating copolymers for highly efficient polymer solar cells†
Yunxiang Chen *ab and
Fang Chen
 a
a
aCollege of Materials and Chemical Engineering, Minjiang University, Fuzhou, 350007, PR China. E-mail: falling147@126.com
bFujian Engineering and Research Center of New Chinese Lacquer Materials, Fuzhou, 350007, PR China
First published on 16th December 2022
Abstract
In this study, two D–A polymers consisting of benzodithiophene-4,8-dione and tetrathiophene with or without fluorination were synthesized to reveal the photovoltaic properties of fluorination effect on the polymer backbone. Polymer PDFTB with two fluorine atoms substituted on the backbone exhibits an enhanced π–π stacking effect, deeper HOMO energy level and better backbone planarity than PDTB without fluorine atom substitution. Devices based on PDFTB:ITIC show a power conversion efficiency of 4.39%, which is 15% higher than that of PDTB-based devices due to the higher hole mobility, optimized surface morphology and homogeneous phase separation of the active layer. These results suggest that the fluorination strategy is a facile way to design polymeric donors for solvent-processed polymer solar cells.
1. Introduction
In the quest for alternative energy sources, bulk-heterojunction (BHJ) polymer solar cells (PSCs) have been widely investigated due to their advantages of flexible, low-cost, and large-area printable techniques, such as roll-to-roll coating and inkjet printing.1–8 Thanks to the development of material synthesis and device fabrication, significant progress in the power conversion efficiency (PCE) of BHJ-based PSC devices has been achieved. The BHJ active layer in PSCs consists of donor and acceptor materials. The compatibility of donor and acceptor materials may affect the phase separation scale and microstructure morphology of the BHJ films, and the energy levels of donor and acceptor can provide the driving force for charge separation.9–15 Therefore, much attention has been paid to the design and optimization of donor and acceptor materials in recent years.Developing D–A type alternating polymers has proved to be an effective way to realize high-performance PSC devices, due to the occurrence of the intramolecular charge transport (ICT) effect.16–19 However, molecular design still plays an important role in promoting photovoltaic properties of polymeric donors. Broad light absorption and suitable energy levels are the fundamental requirements of high-performance donor materials. Molecular energy levels including LUMO and HOMO levels can be adjusted by adding electron-donating or electron-accepting units on the polymer backbone. Electron-accepting units like cyano groups and fluorine atoms are popularly used to downshift the molecular energy levels of donor materials, in order to boost the open-circuit voltage (VOC) of devices.20–22 In addition, introducing fluorine atoms to the polymer backbone also can enhance the ICT and π–π stacking effects, which may promote the short-circuit current density (JSC) of PSC devices.18
To further investigate the fluorination effect on polymeric donor materials, two alternating conjugated polymers were designed and synthesized. Benzodithiophene-4,8-dione (BDD) was employed as the electron-accepting unit, which was then connected with either of two different electron-donating units, namely tetrathiophene and fluorinated tetrathiophene, to afford polymers named PDTB and PDFTB. Of the two medium-band-gap polymers, PDFTB with two fluorine atoms substituted on the polymer backbone shows promising device performance, realizing an average PCE of 4.11%, and a maximum value of 4.39% with VOC of 0.86 V, and JSC of 12.28 mA cm−2. For the other polymer, PDTB, both VOC and JSC values experienced a dramatic decrease to 0.64 V and 9.91 mA cm−2 respectively, which resulted in a lower PCE of 3.81%. To reveal the fluorination effect on the structure-device performance relationships, photophysical/electrochemical properties, charge transport and BHJ film morphologies were investigated to provide a valuable design strategy for high-performance photovoltaic materials.
2. Experimental section
2.1. Materials and synthesis
All the starting materials were purchased from Nanjing Zhiyan Technology Co. Ltd. Acceptor ITIC was purchased from SunaTech Inc. Pd2dba3 and P(o-tol)3 were purchased from Admas. Toluene was freshly distilled from CaH2. Other solvents and reagents were used as received, unless otherwise specified.![[thin space (1/6-em)]](https://www.rsc.org/images/entities/char_2009.gif) :
:![[thin space (1/6-em)]](https://www.rsc.org/images/entities/char_2009.gif) CH2Cl2 (8
CH2Cl2 (8![[thin space (1/6-em)]](https://www.rsc.org/images/entities/char_2009.gif) :
:![[thin space (1/6-em)]](https://www.rsc.org/images/entities/char_2009.gif) 1, v/v) as the eluent to afford the final product (538.9 mg) as a light-yellow oil. 1H NMR (400 MHz, CDCl3) δ 7.56 (d, J = 1.2 Hz, 1H), 7.06 (s, 1H), 3.31 (s, 2H), 2.56 (s, 2H), 1.83–1.72 (m, 1H), 1.70–1.62 (m, 1H), 1.40–1.21 (m, 40H), 0.97–0.81 (m, 12H).
1, v/v) as the eluent to afford the final product (538.9 mg) as a light-yellow oil. 1H NMR (400 MHz, CDCl3) δ 7.56 (d, J = 1.2 Hz, 1H), 7.06 (s, 1H), 3.31 (s, 2H), 2.56 (s, 2H), 1.83–1.72 (m, 1H), 1.70–1.62 (m, 1H), 1.40–1.21 (m, 40H), 0.97–0.81 (m, 12H).![[thin space (1/6-em)]](https://www.rsc.org/images/entities/char_2009.gif) :
:![[thin space (1/6-em)]](https://www.rsc.org/images/entities/char_2009.gif) CH2Cl2 (8
CH2Cl2 (8![[thin space (1/6-em)]](https://www.rsc.org/images/entities/char_2009.gif) :
:![[thin space (1/6-em)]](https://www.rsc.org/images/entities/char_2009.gif) 1, v/v) as the eluent to afford the final product (520.0 mg) as a light-yellow oil.
1, v/v) as the eluent to afford the final product (520.0 mg) as a light-yellow oil.2.2. Fabrication and characterization of devices
The PSC devices were fabricated with a conventional device structure of ITO/PEDOT:PSS/polymer:PC71BM/LiF/Al. Patterned ITO glass (15 Ω per square) was cleaned in an ultrasonic bath of detergent, deionized water, acetone and isopropyl alcohol. All the ITO glass were treated in an ultraviolet-ozone plasma for 15 min before use in fabrication. Poly(3,4-ethylenedioxythiophene):poly(styrenesulfonate) (PEDOT:PSS) (Clevios P, VP AI 4083) was spin-coated on to the ITO surface and annealed for 15 min to form a thin film at about 30 nm. The total concentration of polymer and ITIC in chloroform was 10 mg mL−1 and the solutions were stirred at 30 °C overnight. The solutions were heated to 50 °C and stirred for another 20 min before spin-coating to ensure solubility. The solutions were spin-coated onto the PEDOT:PSS layer to form the active layers, the thickness being determined by an Alpha Step D-300 as about 100 nm. LiF (1 nm) and Al (100 nm) were deposited by vacuum evaporation under 3 × 10⁻⁴ Pa to form the electron-transporting layer and cathode respectively. The active area of the cells was 0.04 cm2. Current–voltage (J–V) curves were measured under 100 mW cm−2 irradiation by using the simulated solar light from a Newport Orial solar 3A simulator and recorded with a Keithley 2400 source meter. External quantum efficiencies (EQEs) were measured with an Enlitech QE-R system. For space-charge-limited current (SCLC) method, architectures of hole-only devices and electron-only devices were ITO/PEDOT:PSS/polymer:PC71BM/MoO3/Ag and ITO/PFN/polymer:PC71BM/PFN/Al respectively.2.3. Materials characterization and measurements
1H NMR spectra were obtained with a Bruker AVIII-400 spectrometer. All the intermediates and polymers were tested in CDCl3 solution and tetramethylsilane as standard. UV-visible absorption spectra were measured with a Shimadzu UV-2600 spectrophotometer. All solution experiments were conducted in dilute chloroform. Cyclic voltammetry (CV) measurements were performed on a Zahner IM6e electrochemical workstation with a scan rate of 0.1 V s−1. Glassy carbon electrode and platinum electrode were used as working electrode and counter electrode respectively. Silver wire coated with silver chloride (Ag/AgCl) electrode was used as reference electrode. CV measurements were carried out in an electrolyte solution of acetonitrile containing 0.1 M n-Bu4NPF6. Polymer films were deposited from chloroform solution onto the working electrodes. Fc/Fc+ was used as internal standard. The absolute energy level of Fc/Fc+ was −4.80 eV. The solution was bubbled with nitrogen before the measurements. The potential of the polymers was corrected by the standard reference of Fc/Fc+ (0.40 V vs. Ag/Ag+ electrode). Highest occupied molecular orbital (HOMO) and lowest unoccupied molecular orbital (LUMO) energy levels were calculated from the onset oxidation potential according to the following equations: EHOMO = −(4.40 + Eonsetox) eV; ELUMO = −(4.40 + Eonsetred) eV. Energy levels were estimated from the optical band gap and HOMO levels. Gel permeation chromatography (GPC) was performed using a waters 1515 at 40 °C with tetrahydrofuran as eluent against polystyrene standard. Differential scanning calorimetry (DSC) was conducted with a NETZSCH DSC 214 nevio, under a nitrogen atmosphere at a heating rate of 10 °C min−1. Thermogravimetric analysis (TGA) was performed with a Mettler-Toledo 851e/822e analysis system under a nitrogen atmosphere at a heating rate of 10 °C min−1. Photoluminescence (PL) was measured by a RF-5301PC spectrometer. X-ray diffraction (XRD) was conducted using an X'Pert3 and Empyrean in reflection mode. Atomic force microscopy (AFM) images were obtained using a Bruker dimension edge scanning probe microscope in tapping mode. Transmission electron microscopy (TEM) images were obtained using a JEOL-2000 FX electron microscope at a voltage of 200 kV.3. Results and discussion
3.1. Synthesis and characterization
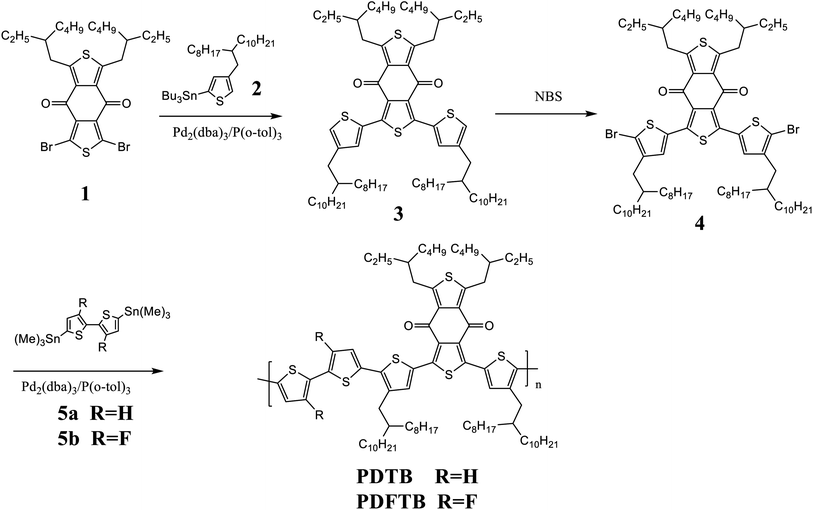
The chemical structures and synthetic route of the polymers are shown in Fig. 1. 1,3-Bis(2-ethylhexyl)-5,7-bis(4-(2-octyldodecyl)thiophen-2-yl)-4H,8H-benzo[1,2-c:4,5-c′]dithiophene-4,8-dione (3) was obtained by Stille coupling reaction between 1,3-dibromo-5,7-bis(2-ethylhexyl)-4H,8H-benzo[1,2-c:4,5-c′]dithiophene-4,8-dione (1) and tributyl(4-(2-octyldodecyl)thiophen-2-yl)stannane (2), with Pd2dba3 as the catalyst and P(o-tol)3 as the ligand in toluene at 110 °C. NBS bromination was carried out in chloroform to afford 1,3-bis(5-bromo-4-(2-octyldodecyl)thiophen-2-yl)-5,7-bis(2-ethylhexyl)-4H,8H-benzo[1,2-c:4,5-c′]dithiophene-4,8-dione (4). Polymers PDTB and PDFTB were synthesized via Stille coupling reaction between 4 and 5,5′-bis(trimethylstannyl)-2,2′-bithiophene (5a) or (3,3′-difluoro-[2,2′-bithiophene]-5,5′-diyl)bis(trimethylstannane) (5b). PDTB and PDFTB exhibit good solubility in common organic solvents, for example chloroform and 1,2-dichlorobenzene. GPC analysis of the two polymers showed Mn of PDTB and PDFTB are 12.1 and 14.7 kDa respectively. The corresponding PDI were calculated as 1.74 and 2.03. DSC measurements (Fig. S1 in the ESI†) of the two polymers reveal that no obvious endothermic processes were observed in the range of 30–300 °C. The resulting polymers show a high glass transmission temperature (Tg) of around 270 °C. The decomposition temperatures (Td) of PDTB and PDFTB are confirmed to be 388 and 402 °C respectively at 5% weight loss, which are obtained from TGA (Fig. S2 in the ESI†). The excellent thermal stabilities of the polymers establish their application potential in photovoltaic devices.3.2. Physical and electrochemical properties of polymers
The normalized UV-visible absorption spectra of PDTB and PDFTB in dilute chloroform are shown in Fig. 2a. Both polymers show two distinct absorption bands. The absorption band in the high-energy region of 350–450 nm may be attributed to the localized π–π* transition, while the band located in the low-energy region of 470–600 nm indicated ICT from electron-donating unit to electron-accepting unit. When going from solution to solid state (Fig. 2b), the two absorption bands show a red shift, implying the increased π–π stacking of polymer backbone. PDFTB exhibits a vibronic absorption shoulder at around 660 nm in the solid state, implying that the introduction of fluorine atoms on the polymer backbone enhanced the interchain interaction and strong stacking among the polymer chains.21,23 Moreover, PDFTB shows a red-shifted maximum absorption peak in comparison with the non-fluorinated polymer, which may benefit the light-harvesting of low-energy photons and lead to an improvement of JSC for solar cell devices. The absorption onset (λonset) of PDTB in the solid state is determined to be 691 nm; when fluorine atoms are introduced into the polymer backbone, the absorption onset of PDFTB shows a slight blue shift to 687 nm. This is attributed to the electron-withdrawing effect of the fluorine atoms, which weakens the conjugation strength.21,24 The optical bandgaps (Eoptg) of PDTB and PDFTB are calculated to be 1.79 eV and 1.80 eV, respectively.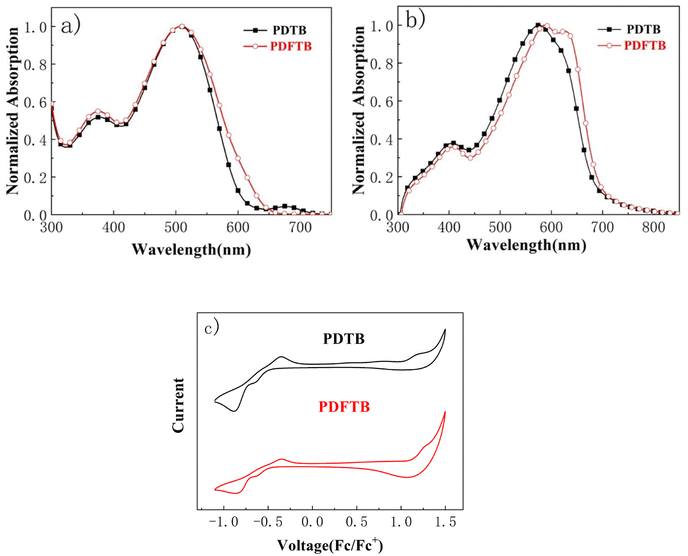 | ||
| Fig. 2 UV-visible absorption spectra of PDTB and PDFTB in (a) chloroform and (b) solid state, and (c) CV curves of PDTB and PDFTB films. | ||
The frontier energy levels of the two polymers were investigated by CV measurements. The LUMO energy levels of PDTB and PDFTB were determined to be −3.69 eV and −3.74 eV, while the HOMO energy levels were determined to be −5.58 eV, and −5.68 eV for PDTB and PDFTB, respectively. The fluorinated polymer PDFTB displays both deeper LUMO and HOMO energy levels than PDTB. This may be attributed to the electron-withdrawing effect of the fluorine atoms. Accordingly, the electronic band gaps of PDTB and PDFTB were calculated from CV measurements as 1.89 eV and 1.94 eV, respectively. The physical and optical properties and frontier energy levels of PDTB and PDFTB are summarized in Table 1.
| Polymer | Mn (kDa) | PDI | Td (°C) | λonset (nm) | Eoptg (eV) | EHOMO (eV) | ELUMO (eV) | ECVg (eV) |
|---|---|---|---|---|---|---|---|---|
| PDTB | 12.1 | 1.74 | 388 | 691 | 1.79 | −5.58 | −3.69 | 1.89 |
| PDFTB | 14.7 | 2.03 | 402 | 687 | 1.80 | −5.68 | −3.74 | 1.94 |
Density functional theory (DFT)-based calculations were conducted to further investigate the fluorination effect on the polymer backbone, for which alkyl side chains are truncated to a methyl for simplification (Fig. 3a). For the two polymers, the dihedral torsion angle between the BDD unit and the adjacent thiophene ring (θ1) is calculated to be around 21°, because of the steric hindrance of the carbonyl group on the BDD unit.25 The dihedral angles between the thiophene rings (θ2 and θ3) for polymer PDTB are 22.49° and 18.52° respectively. After the fluorine atoms are inserted into the polymer backbone, the corresponding dihedral angles between the thiophene rings of PDFTB decrease dramatically to 19.74° and 0.10° respectively, indicating that the fluorine substitution may build up the non-covalent conformation locks between sulfur and fluorine atoms.21 This can effectively reduce the steric hindrance between the thiophene rings in order to improve the backbone planarity, π–π stacking effect and the molecular packing, which can improve the charge transfer ability of the polymeric donor. When observing the orbital distribution (Fig. 3b), it is evident that the HOMO is occupied by the fluorine atoms in PDFTB. Compared with PDTB, the fluorination lowers the HOMO/LUMO level of PDFTB, which is in accordance with the CV measurements.
 | ||
| Fig. 3 Geometries of triads of repeating units of polymers by DFT calculation (a), orbital distribution (b). | ||
3.3. Photovoltaic properties of the polymers
Polymers PDTB and PDFTB were used as donors in PSC devices with the conventional device architecture of ITO/PEDOT:PSS/polymer:ITIC/LiF/Al to evaluate the effect of fluorination on the polymer backbone. The devices were tested under illumination of AM 1.5G simulated solar light. BHJ active layers were spin-coated with chloroform. In order to achieve maximum PCE, we optimized the devices by modifying D![[thin space (1/6-em)]](https://www.rsc.org/images/entities/char_2009.gif) :
:![[thin space (1/6-em)]](https://www.rsc.org/images/entities/char_2009.gif) A ratios, solvent additives and thermal annealing process. The optimal D
A ratios, solvent additives and thermal annealing process. The optimal D![[thin space (1/6-em)]](https://www.rsc.org/images/entities/char_2009.gif) :
:![[thin space (1/6-em)]](https://www.rsc.org/images/entities/char_2009.gif) A weight ratio was identified as 1
A weight ratio was identified as 1![[thin space (1/6-em)]](https://www.rsc.org/images/entities/char_2009.gif) :
:![[thin space (1/6-em)]](https://www.rsc.org/images/entities/char_2009.gif) 1 after checking the weight ratios from 1
1 after checking the weight ratios from 1![[thin space (1/6-em)]](https://www.rsc.org/images/entities/char_2009.gif) :
:![[thin space (1/6-em)]](https://www.rsc.org/images/entities/char_2009.gif) 0.8 to 1
0.8 to 1![[thin space (1/6-em)]](https://www.rsc.org/images/entities/char_2009.gif) :
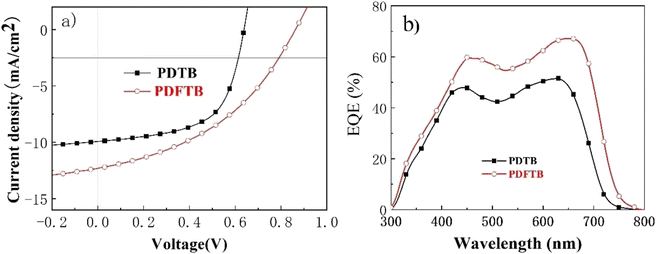
:![[thin space (1/6-em)]](https://www.rsc.org/images/entities/char_2009.gif) 1.2; the optimization details are available in Table S1.† The devices that were processed with 1,8-diiodooctane (DIO) as additive followed by thermal annealing at 100 °C for 10 min exhibited further promotion of PCE compared with the devices processed without additives; the optimization details are available in Table S2.† The optimal PCE of the devices fabricated with PDTB was obtained as 3.81% with photovoltaic parameters VOC = 0.64 V, JSC = 9.91 mA cm−2, FF = 60.1%. The fluorinated polymer PDFTB exhibited a higher PCE of 4.39%. J–V curves of PDTB:ITIC- and PDFTB:ITIC-based PSC devices are shown in Fig. 4a. The photovoltaic parameters are summarized in Table 2. The enhancement resulted from the improvement of VOC and JSC despite the slightly lower FF. The fluorine substituents downshifted the HOMO level of the polymeric donor, which demonstrated higher VOC of the devices. Moreover, fluorine substitution improved the intermolecular interaction, which may lead to better charge mobilities and JSC. EQE spectra were obtained to evaluate the spectral responses of the devices. EQE spectra of the PSC devices are shown in Fig. 4b. Both PDTB- and PDFTB-based PSC devices showed maximum photoresponses in the range 550–700 nm. The photocurrent densities calculated from integrating the EQE spectra were 9.32 and 12.69 mA cm−2, which are consistent with the JSC values obtained from the J–V measurements.
1.2; the optimization details are available in Table S1.† The devices that were processed with 1,8-diiodooctane (DIO) as additive followed by thermal annealing at 100 °C for 10 min exhibited further promotion of PCE compared with the devices processed without additives; the optimization details are available in Table S2.† The optimal PCE of the devices fabricated with PDTB was obtained as 3.81% with photovoltaic parameters VOC = 0.64 V, JSC = 9.91 mA cm−2, FF = 60.1%. The fluorinated polymer PDFTB exhibited a higher PCE of 4.39%. J–V curves of PDTB:ITIC- and PDFTB:ITIC-based PSC devices are shown in Fig. 4a. The photovoltaic parameters are summarized in Table 2. The enhancement resulted from the improvement of VOC and JSC despite the slightly lower FF. The fluorine substituents downshifted the HOMO level of the polymeric donor, which demonstrated higher VOC of the devices. Moreover, fluorine substitution improved the intermolecular interaction, which may lead to better charge mobilities and JSC. EQE spectra were obtained to evaluate the spectral responses of the devices. EQE spectra of the PSC devices are shown in Fig. 4b. Both PDTB- and PDFTB-based PSC devices showed maximum photoresponses in the range 550–700 nm. The photocurrent densities calculated from integrating the EQE spectra were 9.32 and 12.69 mA cm−2, which are consistent with the JSC values obtained from the J–V measurements.
3.4. Charge transport properties
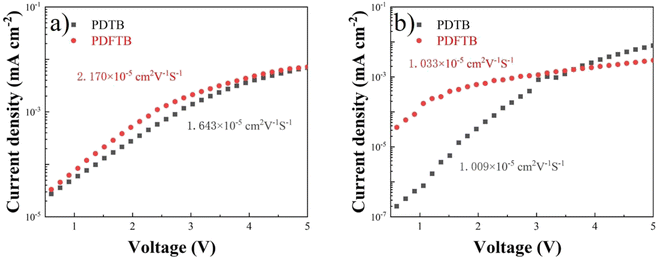
In order to study the charge transport properties of polymer:ITIC blends, the SCLC method was conducted to measure the hole mobility (μh) and electron mobility (μe) of the PSCs. Hole-only devices were fabricated with the device structure of ITO/PEDOT:PSS/active layer/MoO3/Ag, and electron-only devices were fabricated with the configuration of ITO/PFN/active layer/PFN/Al. The J–V curves are shown in Fig. 5. The PDTB:ITIC blend film exhibited μh and μe of 1.643 × 10⁻⁵ cm2 V−1 s−1 and 1.009 × 10⁻⁵ cm2 V−1 s−1, respectively. The PDFTB:ITIC blend film exhibited relatively higher μh and μe of 2.170 × 10⁻⁵ cm2 V−1 s−1 and 1.033 × 10⁻⁶ cm2 V−1 s−1 respectively. Although the PDFTB:ITIC film exhibited higher mobilities, which may lead to a higher JSC, the PDFTB:ITIC blend film showed relatively unbalanced charge transport ability (μh/μe = 2.1) compared with the PDTB:ITIC film (μh/μe = 1.6). The relatively unbalanced hole and electron mobilities may cause bimolecular recombination, which may decrease the FF of PDFTB:ITIC-based devices.263.5. Morphology characteristics
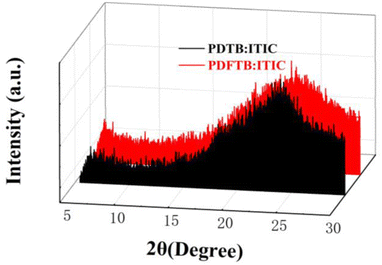
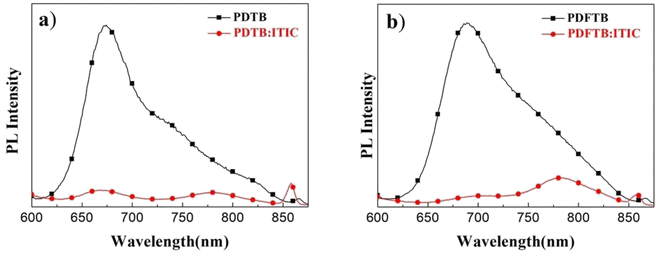
The π-π stacking characteristics of polymer:ITIC blend films were studied by XRD analysis. The curves are shown in Fig. 6. The broad diffraction peak of PDFTB:ITIC film shows a slight increase compared with the PDTB:ITIC film at around 2θ = 23.5°, indicating the enhancement of the π–π stacking, which is consistent with UV-visible spectra and DFT calculations. According to a previous report, the enhancement can reduce the distance of polymer chains and facilitate charge transport, which may lead to an improvement of photocurrent and JSC of the devices.27PL spectra of neat polymer films and polymer:ITIC blend films were obtained to investigate the exciton dissociation characteristics. All films were excited at 525 nm and PL spectra are shown in Fig. 7. PDTB and PDFTB neat films show PL emission from about 620 to 850 nm. For the blend films, PL emissions are greatly suppressed in the emission wavelength, which indicates that the excitons generated in the donor phase can effectively dissociate in the BHJ.
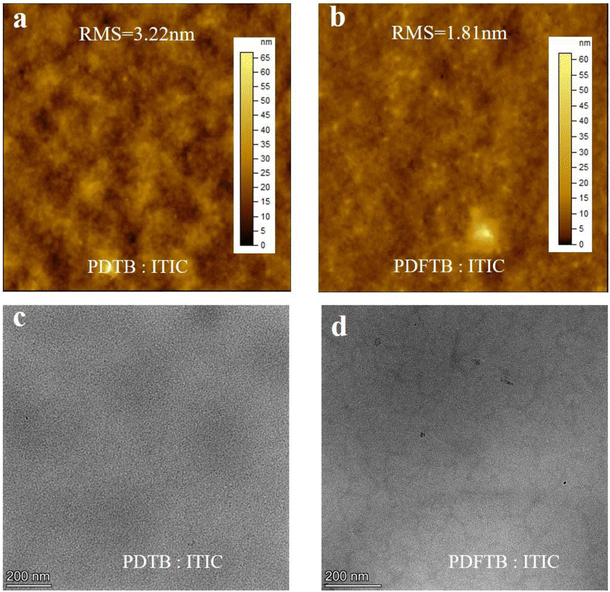
Surface morphologies of the polymer:ITIC blend films were investigated by AFM in tapping mode and TEM. The blend films were prepared with donor and acceptor according to the best performance devices. The images are shown in Fig. 8. The PDTB:ITIC blend film exhibits a relatively rough surface with a root mean square (RMS) roughness of 3.32 nm (Fig. 8a). The light and dark regions in the TEM images are normally assigned as donor-rich and acceptor-rich domains.28 A large-scale phase separation can be observed in Fig. 8c, which may hinder the charge transport from donor to acceptor.11 The PDFTB:ITIC blend film presented a smoother surface with a much lower RMS of 1.81 nm compared with the PDTB:ITIC film (Fig. 8b). The domain size was reduced and a suitable phase separation with nanoscale interpenetrating network structure can be found in the PDFTB:ITIC blend film (Fig. 8d) which provide channels for charge transportation.29 The homogeneous phase separation indicates good miscibility between PDFTB and ITIC, which contributes to exciton dissociation, charge separation and transport and promotes JSC of the devices.18,30 The AFM and TEM images reveal that fluorination on the polymer backbone can effectively promote the surface morphology and the miscibility between donor and acceptor simultaneously, which may be favorable for higher JSC.
4. Conclusion
In conclusion, two polymers based on BDT and tetrathiophene units have been synthesized with or without fluorine atoms on the backbone. When blended with ITIC, the fluorinated polymer PDFTB-based device exhibited dramatically enhanced VOC and JSC. The resulting device shows a PCE of 4.39% despite the decrease of FF, which is 15% higher than that of the device based on non-fluorinated polymer PDTB. The enhancement of VOC may be attributed to the deepened HOMO level through the fluorination strategy. Moreover, due to the substitution of fluorine atoms, the light-harvesting, π–π stacking and charge transport of the active layer were enhanced. Together with the optimal surface morphology of the PDFTB:ITIC film, these properties explained the boost of JSC. However, the unbalanced charge transport ability may result in a lower FF. Our results demonstrated that the fluorination strategy is a promising way to fine-tune the absorption range, band gap and charge transport behavior of conjugated polymers, which is crucial for the enhancement of PSC performance.Conflicts of interest
There are no conflicts of interests to declare.Acknowledgements
This work was financially supported by the Natural Science Foundation of Fujian Province (2020J05171), the Education and Scientific Research Foundation of Fujian Province (JAT190601), Social Development Project of Fuzhou (2021-S-233), and Scientific Research Projects of Introduced Talents of Minjiang University (MJY21044).References
- M. Zhang, Y. Gu, X. Guo, F. Liu, S. Zhang, L. Huo, T. P. Russell and J. Hou, Adv. Mater., 2013, 25, 4944–4949 CrossRef CAS PubMed.
- C. Cui, W.-Y. Wong and Y. Li, Energy Environ. Sci., 2014, 7, 2276–2284 RSC.
- T.-H. Lai, I. Constantinou, C. M. Grand, E. D. Klump, S. Baek, H.-Y. Hsu, S.-W. Tsang, K. S. Schanze, J. R. Reynolds and F. So, Chem. Mater., 2016, 28, 2433–2440 CrossRef CAS.
- S. Yang, Z. Lin, J. Wang, Y. Chen, Z. Liu, E. Yang, J. Zhang and Q. Ling, ACS Appl. Mater. Interfaces, 2018, 10, 15980–15987 CrossRef CAS PubMed.
- L. Hong, H. Yao, Z. Wu, Y. Cui, T. Zhang, Y. Xu, R. Yu, Q. Liao, B. Gao, K. Xian, H. Y. Woo, Z. Ge and J. Hou, Adv. Mater., 2019, 31, e1903441 CrossRef PubMed.
- J. Yang, P. Cong, L. Chen, X. Wang, J. Li, A. Tang, B. Zhang, Y. Geng and E. Zhou, ACS Macro Lett., 2019, 8, 743–748 CrossRef PubMed.
- H. Liu, J. Wu, Y. Fu, B. Wang, Q. Yang, G. D. Sharma, M. L. Keshtov and Z. Xie, Thin Solid Films, 2021, 718, 138486 CrossRef CAS.
- X. Li, X. Liu, P. Sun, Y. Feng, H. Shan, X. Wu, J. Xu, C. Huang, Z.-K. Chen and Z.-X. Xu, RSC Adv., 2017, 7, 17076–17084 RSC.
- D. Baran, R. S. Ashraf, D. A. Hanifi, M. Abdelsamie, N. Gasparini, J. A. Rohr, S. Holliday, A. Wadsworth, S. Lockett, M. Neophytou, C. J. M. Emmott, J. Nelson, C. J. Brabec, A. Amassian, A. Salleo, T. Kirchartz, J. R. Durrant and I. McCulloch, Nat. Mater., 2017, 16, 363–369 CrossRef CAS PubMed.
- S. Dai, F. Zhao, Q. Zhang, T.-K. Lau, T. Li, K. Liu, Q. Ling, C. Wang, X. Lu, W. You and X. Zhan, J. Am. Chem. Soc., 2017, 139, 1336–1343 CrossRef CAS PubMed.
- W. Chen, H. Jiang, G. Huang, J. Zhang, M. Cai, X. Wan and R. Yang, Sol. RRL, 2018, 2, 1800101 CrossRef.
- Z. Wang, G. Han, L. Zhu, Y. Guo, Y. Yi, Z. Shuai and Z. Wei, Phys. Chem. Chem. Phys., 2018, 20, 24570–24576 RSC.
- Z. Zhou, S. Xu, J. Song, Y. Jin, Q. Yue, Y. Qian, F. Liu, F. Zhang and X. Zhu, Nat. Energy, 2018, 3, 952–959 CrossRef CAS.
- Y. J. Kim, E. S. Ahn, M. C. Hwang, C. E. Park and Y.-H. Kim, Thin Solid Films, 2016, 603, 165–172 CrossRef CAS.
- K. Wang, S. Dong, X. Chen, P. Zhou, K. Zhang, J. Huang and M. Wang, RSC Adv., 2020, 10, 38344–38350 RSC.
- M. Jeong, S. Chen, S. M. Lee, Z. Wang, Y. Yang, Z.-G. Zhang, C. Zhang, M. Xiao, Y. Li and C. Yang, Adv. Energy Mater., 2018, 8, 1702166 CrossRef.
- X. Bao, Y. Zhang, J. Wang, D. Zhu, C. Yang, Y. Li, C. Yang, J. Xu and R. Yang, Chem. Mater., 2017, 29, 6766–6771 CrossRef CAS.
- B. A. Abdulahi, X. Li, M. Mone, B. Kiros, Z. Genene, S. Qiao, R. Yang, E. Wang and W. Mammo, J. Mater. Chem. A, 2019, 7, 19522–19530 RSC.
- S. Oh, D. H. Kim, T. Ahn and S. K. Lee, J. Nanosci. Nanotechnol., 2018, 18, 7221–7224 CrossRef CAS PubMed.
- N. Wang, Z. Chen, W. Wei and Z. Jiang, J. Am. Chem. Soc., 2013, 135, 17060–17068 CrossRef CAS PubMed.
- G. P. Kini, J. Y. Choi, S. J. Jeon, I. S. Suh and D. K. Moon, Polymer, 2018, 148, 330–338 CrossRef CAS.
- D. Tu, X. Liu, J. Zhang, Q. Yang, S. Yu, X. Guo and C. Li, ACS Sustainable Chem. Eng., 2018, 6, 16005–16010 CrossRef CAS.
- J. W. Jo, J. W. Jung, E. H. Jung, H. Ahn, T. J. Shin and W. H. Jo, Energy Environ. Sci., 2015, 8, 2427–2434 RSC.
- W. T. Neo, K. H. Ong, T. T. Lin, S.-J. Chua and J. Xu, J. Mater. Chem. C, 2015, 3, 5589–5597 RSC.
- D. Liu, J. Wang, C. Gu, Y. Li, X. Bao and R. Yang, Adv. Mater., 2018, 30, 1705870 CrossRef PubMed.
- G. Li, V. Shrotriya, J. Huang, Y. Yao, T. Moriarty, K. Emery and Y. Yang, Nat. Mater., 2005, 4, 864–868 CrossRef CAS.
- Y. Li, L. Duan, D. Liu, W. Chen, X. Bao, H. Zhen, H. Liu and R. Yang, J. Mater. Chem. C, 2018, 6, 2806–2813 RSC.
- X. Ma, W. Gao, J. Yu, Q. An, M. Zhang, Z. Hu, J. Wang, W. Tang, C. Yang and F. Zhang, Energy Environ. Sci., 2018, 11, 2134–2141 RSC.
- Y. Chen, G. You, D. Zou, Q. Zhuang, H. Zhen and Q. Ling, Sol. Energy, 2019, 183, 350–355 CrossRef CAS.
- R. Peng, H. Guo, J. Xiao, G. Wang, S. Tan, B. Zhao, X. Guo and Y. Li, ACS Appl. Energy Mater., 2018, 1, 2192–2199 CrossRef CAS.
Footnote |
| † Electronic supplementary information (ESI) available. See DOI: https://doi.org/10.1039/d2ra05925h |
| This journal is © The Royal Society of Chemistry 2022 |

