 Open Access Article
Synthesis of a Ag/rGO nanocomposite using Bos taurus indicus urine for nitroarene reduction and biological activity†
Gouri S. Kumbhar‡
a,
Shubham V. Patil‡a,
Prashant D. Sarvalkara,
Apurva S. Vadanagekara,
Omkar S. Karvekara,
Sharadchandra S. Patilb,
Manali R. Ranec,
Kiran kumar K. Sharmaa,
Deepti N. Kurhe*d and
Neeraj R. Prasad *ae
*ae
aSchool of Nanoscience and Technology, Shivaji University, Kolhapur-416004, MH, India
bDepartment of Physics, Shivaji University, Kolhapur-416004, MH, India
cDepartment of Biotechnology, Shivaji University, Kolhapur-416004, MH, India
dDepartment of Biochemistry, Shivaji University, Kolhapur-416004, MH, India. E-mail: deeptidagade@yahoo.com
eJaysingpur College, Jaysingpur, Affiliated to Shivaji University, Kolhapur 416234, MH, India. E-mail: neeraj_prasad21@rediffmail.com
First published on 13th December 2022
Abstract
The present study develops a unique in situ synthesis of a catalytically and biologically active Ag/reduced graphene oxide (rGO) nanocomposite. Herein, we employed Bos taurus indicus urine to synthesize a Ag/rGO nanocomposite in an environmentally benign, facile, economical, and sustainable manner. The elemental composition analysis reveals the presence of Ag, O and C elements. The scanning electron micrograph shows the formation of spherical silver in nanoform whereas rGO is found to be flake shaped with a wrinkled nature. The synthesized nanomaterial and its composite shows a positive catalytic effect in simple organic transformation for the reduction of nitroarene compounds. Investigations were conducted into the catalytic effectiveness of the prepared nanomaterials for diverse nitroarene reduction. Then, using NaBH4 at 25 °C, the catalytic roles of Ag and the Ag/rGO nano-catalyst were assessed towards the catalytic reduction of several environmental pollutants such as 2-, 3- and 4-nitroaniline and 4-nitrophenol into their respective amino compounds. To test their catalytic performance, bio-mimetically synthesized Ag NPs were thermally treated at 200 °C and compared with the Ag/rGO nanocomposite. Furthermore, biomedical applications such as the antibacterial and antioxidant properties of the as-prepared nanomaterials were investigated in this study.
1 Introduction
After the discovery and development of semiconducting materials the research into the synthesis of materials at the nanoscale has become a hot topic in the mind of researchers. In the earlier attempts the nanomaterials were synthesized by physical and chemical synthesis routes. The physical synthesis route needs expensive instruments like ball milling. The nanomaterials synthesized by the physical synthesis route suffers from defects. The chemical synthesis route uses potentially environmentally hazardous chemical compounds. Therefore, scientists were in search of some alternative synthesis route which could produce defect free and eco-friendly materials at the nanoscale. The synthesized nanomaterials could be successfully used as nano-catalysts for wastewater treatment (adsorption,1 photocatalysis,2–4 organic transformation reaction,5,6 chromium reduction,7 etc.). Biotechnology and nanotechnology integrate together to develop low-cost, eco-friendly ways of fabricating nanomaterials using microbes like fungi, bacteria, plant part extracts, metabolic waste from vertebrate animals like Bos taurus indicus etc. The metabolites from plant or animal sources can be implemented to develop low-cost and environmentally benign ways to fabricate materials at the nanoscale.8 Here the concept of biotechnology and nanotechnology integrates for the production of nanoscale materials. The earlier attempts were with micro-organisms like bacteria, and fungi, and further research developed plant based methods for the production of materials at the nanoscale in an ecologically friendly manner.9 In particular, silver nanoparticles (Ag NPs) have a long history of use among the many metal-based nanoparticles, principally due to their antimicrobial characteristics.9–11 Because of their small size and large surface area, Ag NPs may interact efficiently with microbe surfaces and are consequently employed as effective and potential antimicrobial agents.12 Silver's antibacterial properties have been known for millennia. Ag NPs have been found to exhibit antibacterial effects.Ag NPs can be synthesized by simple reduction reaction process. Ex situ hybridization involves preparing the metal NPs separately and allowing them to adsorb on the surface of rGO nano-sheet. However, for an easy one-pot in situ synthesis approach, the metal precursors are put right into the reaction solution that already contains rGO. The liquid metabolic waste of Indian cow urine acts as potential reducing agent for formation of metal NPs. The liquid metabolic discharge of Indian cow urine accommodates a variety of minerals, including iron, copper, nitrogen, manganese, silicone, magnesium, calcium salts, mineral salts, enzymes, and vitamins such as A, B, C, D, E, uric acid, and other hormones. According to ancient Ayurvedic literature Sushruta Samhita and Ashtanga Sangraha Indian cow urine can treat leprosy, peptic ulcer, liver disease, renal disease, asthma, psoriasis, anemia, allergies, and cancer. The authors have firsthand experience with Bos taurus indicus urine's laxative qualities.13 As a result, we attempted to synthesize nanomaterials from Bos taurus indicus urine-assisted Ag NPs and in situ synthesized Ag/rGO nanocomposites.
Industrial wastewater which contains nitro-phenol derivatives are problematic to human health.14 The industrial effluents containing nitro-phenols can enter the body via skin, digestive or respiratory tract and harm the internal organs of body. Another key point to remember, 4-nitrophenol (4-NP) is a toxic and bio-refractory compound i.e., it opposes the natural decomposition processes of biological mechanism. Moreover, it also damages the central nervous system, liver, blood and kidney of humans as well as animals. Nonetheless, nitro-phenol derivatives such as 2-nitroaniline (2-NA), 3-nitroaniline (3-NA), and 4-nitroaniline (4-NA) were widely used in industries, contributing to wide range of pollution. This is due to the fact that the degradation of nitroarenes and organic dyes has become a necessary topic of interest for scientists in recent decades. In this study, we synthesize Ag NPs from Bos taurus indicus urine and an in situ approach for Ag/rGO nanocomposites synthesis and investigate their comparative effects against various bacteria and antioxidant studies.
2 Experimental
2.1 Materials
For synthesis of nanomaterials and nanocomposites, cetyl-trimethyl ammonium bromide (CTAB, 99%), ethanol (99%), graphite flakes (size 100 micron, 99.5%), hydrochloric acid (HCl, 36.5%), hydrogen peroxide (H2O2, 30% w/v), potassium permanganate (KMnO4, 99.5%), phosphoric acid (H3PO4, 85%), sulfuric acid (H2SO4, 98%), silver nitrate (AgNO3, 99.9%) were used. The acetate buffer (pH 3.6), 2,4,6-tripyridyl-s-triazine (TPTZ) and FeCl3·6H2O (97%) are used for preparing FRAP (ferric reducing/antioxidant power) reagent. All other chemicals required for the experiments were of analytical grades and procured from Sigma (St. Louis MO, USA). The following chemicals are purchased from Sigma-Aldrich, Milwaukee (USA): 4-nitrophenol (4-NP) (C6H5NO3, 99%), 2-nitroaniline (2-NA) (C6H6N2O2, 98%), 3-nitroaniline (3-NA) (C6H6N2O2, 98%), 4-nitroaniline (4-NA) (C6H6N2O2, 99%), and sodium borohydride (NaBH4, 98%). Microbes namely Escherichia coli (NCLM2832) and Staphylococcus aureus (NCLM2602) procured from National Chemical Laboratory Pune were used for this study. The stock cultures were maintained on nutrient agar slants at 37 °C. The freshly discharged liquid metabolic waste (urine) of healthy and fully vaccinated Gir (Bos taurus indicus) (A-2) cow. The cow urine was donated from the owner of the cattle, Mr Dhanaji parasharam sarvalkar, A/P kaneriwadi, Dist. Kolhapur, Maharashtra, India 416234.2.2 Bio-mimetic thermally treated Ag NPs synthesis
We follow the procedure developed by Sarvalkar et al.4 for the synthesis of Ag NPs using Indian cow urine. The silver nitrate was used as a precursor for the production of Ag NPs. To begin, 100 ml solution of 0.1 M AgNO3 was prepared, and 25 ml of freshly discharged Bos taurus indicus urine was added drop-wise to the above solution under constant stirring. When Bos taurus indicus urine was added to the mixture, a brownish-coloured precipitate was observed. After 1 hour, CTAB solution was progressively added in the solution, which is made up of 0.1 W/V%, and acts as an efficient capping agent. The temperature of 25–30 °C was maintained during the course of reaction. Then the precipitate was collected using a centrifuge and washed with deionized water several times. The cationic surfactant is removed from the solution by using ethanol. The sample was transferred to a Petri dish and dried at 60 °C. Then, the synthesized precipitate was annealed for 1 hour at 200 °C with constant rate 5 °C min−1. The TGA analysis reveals a slight drop in temperature at about 200 °C. This suggests that impurities are decanted at that temperature, in the form of moisture and hydroxide, etc. Here, we improve the procedure by thermally treating Ag NPs. The final product was scraped off with a metal spatula and crushed mechanically into a fine powder using mortar and pestle. Finally, the synthesised Ag NPs were stored for further characterization.2.3 Possible mechanism of action
The possible reaction pathways to describe the likely mechanism for the synthesis of transition metallic nanomaterials utilizing Bos taurus indicus urine is as below:The literature survey reveals that liquid metabolic waste of Bos taurus indicus contains magnesium, phenol, aurum hydroxide, creatinine, carbolic acid, urea and calcium. Several biogenic volatile inorganic and organic chemicals, such as ammonia, acetone, and certain secondary nitrogenous products, are generated during light activation. The following is an illustration of a hypothetical reaction process for Ag NPs and Ag/rGO nanocomposite:
The chemical formula for urea is CO(NH2)2. The carbonyl group, C![[double bond, length as m-dash]](https://www.rsc.org/images/entities/char_e001.gif) O, is directly bonded to two NH2 groups in this structure. Urea seems to be a base due to the presence of a lone pair of electrons on the nitrogen atom. However, due to the carbonyl group's electronegative nature, it acts as a neutral molecule. Urea is transformed to ammonia by hydrolysis when it is treated with the enzyme urease or heated to high temperature. Urea is degraded into ammonia and isocyanate ions as a by-product in the first phase of the process. This reaction is reversible at pH levels between 5 and 12. Isocyanate is hydrolysed to form ammonia in the second step, with carbon dioxide as a by-product. At 35 °C, urea hydrolysis is faster than at 15 °C.4
O, is directly bonded to two NH2 groups in this structure. Urea seems to be a base due to the presence of a lone pair of electrons on the nitrogen atom. However, due to the carbonyl group's electronegative nature, it acts as a neutral molecule. Urea is transformed to ammonia by hydrolysis when it is treated with the enzyme urease or heated to high temperature. Urea is degraded into ammonia and isocyanate ions as a by-product in the first phase of the process. This reaction is reversible at pH levels between 5 and 12. Isocyanate is hydrolysed to form ammonia in the second step, with carbon dioxide as a by-product. At 35 °C, urea hydrolysis is faster than at 15 °C.4
According to another theory, uric acids (7,9-dihydro-1H-purine-2,6,8(3H)-trione), creatinine (2-amino-1-methyl-5H-imidazole-4-one), and all antoin (2,5-dioxo-4-imidazolidinyl) are present in Bos taurus indicus urine. Bos taurus indicus metabolic waste contains a variety of components that come into contact with metal ions, which results in the bio-inspired production of Ag NPs and Ag/rGO nanocomposite using Bos taurus indicus urine.15
2.4 Synthesis of nanocomposite
Tour et al.16 established an improved approach for the synthesis of graphene oxide (GO), which we use. We also use the procedure described by S. De et al.17 for the synthesis of rGO with hydrazine hydrate as a reducing agent. The synthesis procedure of GO and rGO (gives the conformation by using XRD in Fig. S1† and Raman in Fig. S2† given in ESI†) use for composite formation.Silver nitrate and rGO were employed in the synthesis of the Ag/rGO nanocomposite. Firstly, 100 ml of 0.1 M AgNO3 solution was prepared by dissolving it into D. W. The next step was to 0.1 g of rGO dispersed in AgNO3 solution using bath sonicator. Then, with constant stirring, CTAB was gradually added to the solution by dissolving it in 15 ml distilled water. As a capping agent, the CTAB is utilized. After that, 25 ml of Bos taurus indicus urine was added to the above solution in a dropwise manner. The reaction took place between 25–30 °C. When Bos taurus indicus urine is added to a mixture, a brownish-colored precipitate is formed. Further, the resulting precipitate was centrifuged (6000 rpm) and washed with water and ethanol. The sample was then transferred to a Petri plate and dried in oven at 60 °C. Then the final product was crushed into fine powder and stored for further characterization as well as used to study catalytic and biological efficiency.4
2.5 Antimicrobial activity assay
Antimicrobial activity of synthesized Ag NPs and Ag/rGO nanocomposites was performed against the Gram-positive Staphylococcus aureus and Gram-negative E. coli bacteria by well diffusion technique. In this technique all the glassware and nutrient agar media was sterilized completely before use. Firstly, 3 g of nutrient agar and 1 g of agar powder was added in 100 ml of distilled water. Then after sterilization, 20 to 25 ml media was poured in Petri plates in an aseptic condition and allowed to solidify. The bacterial cultures were maintained on nutrient agar slants after which the pure cultures of organisms were sub-cultured in nutrient broth at 35 ± 2 °C on a rotary shaker at 160 rpm overnight. For bacterial growth, a lawn of culture was prepared by spreading the 200 μl fresh culture of each test organism on nutrient agar plates with the help of a sterile glass-rod spreader. Plates were left standing for 10 min to let the culture get adsorbed in laminar air flow. Then 0.8 cm wells were punched in nutrient agar plate for testing the antimicrobial activity of synthesized nanoparticle. 100 μl of the test sample of Ag and Ag/rGO of different concentration (0.5 mg ml−1, 1.0 mg ml−1, 1.5 mg ml−1 and 2 mg ml−1) were sonicated at 20 kHz for 12 min and then poured in respective wells on all plates along with the control sample lacking NPs (i.e., distilled water) was loaded in a separate well. After this the plates were incubated for 24 h in incubator at 37 °C and zone of inhibition was measured.2.6 FRAP (ferric reducing/antioxidant power) assay
The reducing capability of the Ag and Ag/rGO were evaluated using Benzie et al.18 To make the working FRAP reagent acetate buffer (300 mM; pH 3.6) and 2,4,6-tripyridyl-s-triazine (TPTZ) (10 mM) in HCl (40 mM) were added in 20 mM FeCl3·6H2O in a 10![[thin space (1/6-em)]](https://www.rsc.org/images/entities/char_2009.gif) :
:![[thin space (1/6-em)]](https://www.rsc.org/images/entities/char_2009.gif) 1
1![[thin space (1/6-em)]](https://www.rsc.org/images/entities/char_2009.gif) :
:![[thin space (1/6-em)]](https://www.rsc.org/images/entities/char_2009.gif) 1 ratio and warmed to 37 °C in water bath for 10 minutes. Ag and Ag/rGO solutions of different concentrations were prepared separately in water, after which they were sonicated for making suspension. Different solutions of NPs were subjected to reaction using 2.7 ml of FRAP solution at differing concentrations (5 μg ml−1, 10 μg ml−1, 15 μg ml−1, 20 μg ml−1, 25 μg ml−1 and 30 μg ml−1). The final volume of reaction mixture was adjusted to 3 ml by adding distilled water. After that reaction mixture was kept in dark for 30 minutes at room temperature. Further the absorbance of the colored product was recorded at 593 nm using spectrophotometer.
1 ratio and warmed to 37 °C in water bath for 10 minutes. Ag and Ag/rGO solutions of different concentrations were prepared separately in water, after which they were sonicated for making suspension. Different solutions of NPs were subjected to reaction using 2.7 ml of FRAP solution at differing concentrations (5 μg ml−1, 10 μg ml−1, 15 μg ml−1, 20 μg ml−1, 25 μg ml−1 and 30 μg ml−1). The final volume of reaction mixture was adjusted to 3 ml by adding distilled water. After that reaction mixture was kept in dark for 30 minutes at room temperature. Further the absorbance of the colored product was recorded at 593 nm using spectrophotometer.
2.7 Catalytic reduction reaction assay
The catalytic reduction of nitroarenes were carried out using NaBH4 in presence of synthesized materials which as nano-catalyst. The procedure of reaction of catalytic reduction is as follows; the 12 mM NaBH4 ice cold solution, 0.15 mM nitro-group containing compounds and 0.05 mg ml−1 nanomaterial aqueous solution were prepared.Out of these solutions, first 1 ml of NaBH4 was taken into the 3.0 ml Eppendorf tube then 1 ml of nitro-group containing compound is added. Lastly, 200 μl of nanomaterial solution was added. Further, the mixture was transferred in to the 3 ml quartz cell with the path length of 1 cm. The UV-Vis spectrophotometric analysis was performed at 200 to 800 nm range. After every 30 s time interval the absorption spectra was recorded to analyze the catalytic reduction.
2.8 Characterization study
In the synthesis of nanomaterials, it is critical to assure their size, shape, surface charge, and morphology, among other things. Using this characterization instrumentation, thermal analysis, X-ray diffraction, Fourier transform infrared (FTIR), and other techniques were used to describe the product characterization. To demonstrate the crystalline structure of Ag NPs and Ag/rGO nanocomposites, an X-ray diffractometer (Bruker D8 advanced, Germany) was used to record the XRD spectrum, and the associated size was determined using the Sherer equation. Moreover, a TESCAN MIRA-3 field emission-scanning electron microscope (FESEM) coupled with an Energy Dispersive X-ray (EDX) Spectroscopy detector was utilised to analyse Ag NPs and Ag/rGO nanocomposites for the investigation of the surface morphology of nanomaterials. FT-IR was used to investigate the interface in situ, revealing a variety of functional groups adsorbed on the produced nanomaterials. We utilised an ALPHA Bruker FT-IR spectrometer to measure the substance on KBr pellets. The Raman analysis spans from 100 to 3200 cm−1 when using a Renishaw Raman spectroscope. Particle size analyser with zeta potential, Malvern (UK) was used to examine particle size and surface charge.3 Results and discussion
3.1 XRD study of Ag NPs and Ag/rGO nanocomposites
XRD patterns are used to investigate the crystalline structure of Ag NPs and Ag/rGO nanocomposites. Fig. 1 shows the XRD pattern for Ag NPs and Ag/rGO nanocomposites. It has a broad peak at 22.81° that corresponds to an average interplanar distance of 0.78 nm and is assigned to the (002) plane of rGO. The XRD patterns of Ag NPs and Ag/rGO nanocomposite show crisp diffraction patterns at 36.3°, 44.2°, 64.4°, and 77.4° which may be indexed as (111), (200), (220), and (311) facets with a face-centered cubic (FCC) structure, and are in good agreement with the standard Ag NPs JCPDS le (JCPDS 87-0597).4,19The Debye–Scherer's formula (eqn (1)) was used to calculate crystalline size of the nanomaterials from the Full Width at Half Maxima (FWHM) denoted by β and diffraction angle (θ),
 | (1) |
Table no. S1† for Ag NPs and in Table no. S2† for Ag/rGO nanocomposites represent the crystalline size for various samples is calculated using the above formula.20,21
3.2 Morphology index (MI)
The interrelation between crystalline size and morphology determines the specific surface area of a nanoparticle. FWHM is used to determine MI.13 MI is calculated using the following,
 | (2) |
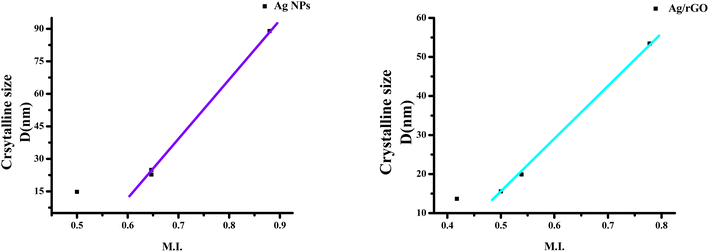
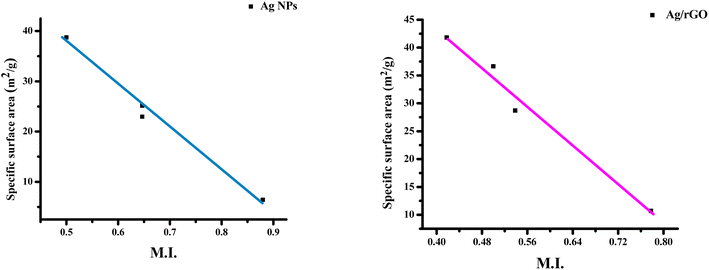
The estimated values of Ag/rGO nanocomposites likewise vary from 0.53844 to 0.777804, whereas the morphological index value of Ag NPs spans from 0.5 to 0.879749 (Table no. S1†). It is related to the specific surface area (SSA) and the size of the crystalline particles. Ag/rGO nanocomposites have an SSA value of 10.69–28.71 m2 g−1 (Table no. S2†), whereas Ag NPs have an SSA value of 6.41803–38.74925 m2 g−1 (Table no. S1†).22 SSA is calculated using the following formula,
 | (3) |
The calculated results show that, given a little variation, morphological index is directly proportional to crystalline size and inversely proportional to specific surface area. The outcomes are shown in Fig. 2 and 3. The deviations and connections between the figures are shown by the linear fit.
3.3 TEM, FE-SEM and elemental mapping of Ag NPs and Ag/rGO nanocomposites
The nanoparticles morphology and size were determine using TEM. Fig. 4 shows the TEM characterization of thermally treated Ag NPs and Ag/rGO nanocomposite. FESEM (field emission scanning electron microscopy) analysis was used to study the morphology of Ag NPs and Ag/rGO nanocomposite. Fig. S3(a–h) and S4(a–e)† illustrates the FESEM image and elemental mapping of these nanomaterials. The TEM (Fig. 4a–d) and FE-SEM images (Fig. S3a and b†) of Ag NPs revels that, it has size 15 to 400 nm with the relatively spherical shape. As compared to previously reported Ag NPs using cow urine,4 our Ag NPs show a smaller particle size due to the thermal treatment. Furthermore, rGO minor wrinkles on the surface with flake like shape. In the TEM (Fig. 4e–h) and FE-SEM images of Ag/rGO nanocomposites dot were observed, which are Ag NPs densely covered on the nanosheet surface, as well as deposited randomly as seen in Fig. S3(e–h).†Fig. S4a† gives the information about elemental mapping of Ag NPs which reveals that it coexist the elements like Ag map (Fig. S4b†). In addition to that, it is observed from elemental mapping of Ag/rGO (Fig. S4c†), elements Ag map (Fig. S4d†) and carbon map (Fig. S4e†) were dispersed uniformly over the length of rGO. Resulted into, Ag NPs were distributed well over the surface of nanosheet and provides the conformation of nanocomposite structure formation.
3.4 EDX analysis of NPs and Ag/rGO nanocomposites
The EDX spectrum and the quantitative elemental composition of Ag NPs and Ag/rGO is summarized in the Fig. S5a and b.† The EDX spectrum Fig. S5a† gives the confirmation of only silver were presented in the sample of Ag NPs. Fig. S5b† illustrate the EDX analysis of in situ synthesized Ag/rGO nanocomposite. Moreover, it is clearly observed that Ag/rGO nanocomposite were successfully synthesized without any impurity element and it also verifies the Ag were present. The absorbance peak at 3 keV is referred to Ag metallic. Ag/rGO contains Ag and C according to the Fig. 6b. In Ag NPs the Ag% is 100 as shown in Fig. S5a.† However, Ag/rGO nanocomposite consist of 33.70% Ag, and 66.30% carbon (in Fig. S5b†). It is confirmed that, Ag NPs were successfully fabricated on the surface of rGO, according to FESEM, elemental mapping and EDX analysis.3.5 FTIR of Ag NPs and Ag/rGO nanocomposites
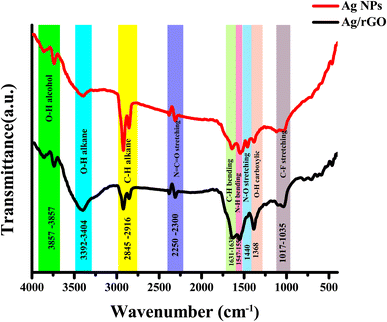
The functional groups were identified using FTIR spectroscopy with a wavelength range of 4000 to 400 cm−1. In Fig. 5 the bands obtained from the characterization include 3857 and 3731 cm−1, which are caused by O–H stretching of alcohol, and 3404 cm−1 due to O–H stretching of alkane, and 2916 cm−1 is because of C–H stretching of alkane.23 The C–H stretching of aldehyde, resulted by a band at 2845 cm−1. N![[double bond, length as m-dash]](https://www.rsc.org/images/entities/char_e001.gif) C
C![[double bond, length as m-dash]](https://www.rsc.org/images/entities/char_e001.gif) O stretching isocyanate bands seen at 2250–2300 cm−1. The bands at 1638 cm−1 are mild C–H bending aromatic compounds, whereas the bands at 1631 cm−1 are conjugated alkane C
O stretching isocyanate bands seen at 2250–2300 cm−1. The bands at 1638 cm−1 are mild C–H bending aromatic compounds, whereas the bands at 1631 cm−1 are conjugated alkane C![[double bond, length as m-dash]](https://www.rsc.org/images/entities/char_e001.gif) C stretching. The bands at 1547 and 1553 cm−1 are caused by amine N–H bending, whereas 1535 cm−1 is due to by nitro compound N–O stretching. O–H bending from carboxylic acid is represented by the band at 1440 cm−1.24 The S
C stretching. The bands at 1547 and 1553 cm−1 are caused by amine N–H bending, whereas 1535 cm−1 is due to by nitro compound N–O stretching. O–H bending from carboxylic acid is represented by the band at 1440 cm−1.24 The S![[double bond, length as m-dash]](https://www.rsc.org/images/entities/char_e001.gif) O stretching of the sulfonamide group is shown by the band at 1368 cm−1. The C–C stretching band at 1035 cm−1.25,26
O stretching of the sulfonamide group is shown by the band at 1368 cm−1. The C–C stretching band at 1035 cm−1.25,26
3.6 Raman spectra of Ag NPs and Ag/rGO nanocomposites
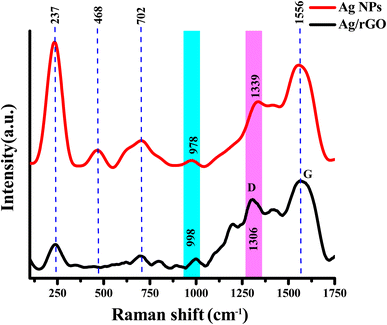
The characterization for Ag NPs and Ag/rGO nanocomposite, Raman spectroscopy in the range of 100–1750 cm−1 gave the following findings (in Fig. 6). In the Ag–N and Ag–O stretching mode, the spectra exhibited significant peaks with peak values of 237 cm−1.27 Furthermore, the peaks at 468 cm−1 may have occurred due to (N–C–S) and ν(C–N–C) vibrational stretching peaks are from 702–706 cm−1, respectively; however, the, ν(C–O–C) vibrational plane stretching peak is at 801–978 cm−1.28,29 Furthermore, the peak at 1306 cm−1 (D band) and 1556 cm−1 (G band) in the Ag/rGO nanocomposites with vibrational stretching of correspond to symmetric and asymmetric C![[double bond, length as m-dash]](https://www.rsc.org/images/entities/char_e001.gif) O stretching vibrations of carboxylate group, ν(N
O stretching vibrations of carboxylate group, ν(N![[double bond, length as m-dash]](https://www.rsc.org/images/entities/char_e001.gif) N) aliphatic respectively.30 The intensity ratio of ID/IG for rGO (in Fig. S2†) and Ag/rGO nanocomposites is 1.077 and 0.78, respectively. However, ID/IG ratio of Ag/rGO is <1 (comparatively less pure than rGO) because surrounding the rGO nanosheets the growth of Ag NPs were observed.31
N) aliphatic respectively.30 The intensity ratio of ID/IG for rGO (in Fig. S2†) and Ag/rGO nanocomposites is 1.077 and 0.78, respectively. However, ID/IG ratio of Ag/rGO is <1 (comparatively less pure than rGO) because surrounding the rGO nanosheets the growth of Ag NPs were observed.31
3.7 TG-DSC graph study of Ag NPs and Ag/rGO nanocomposites
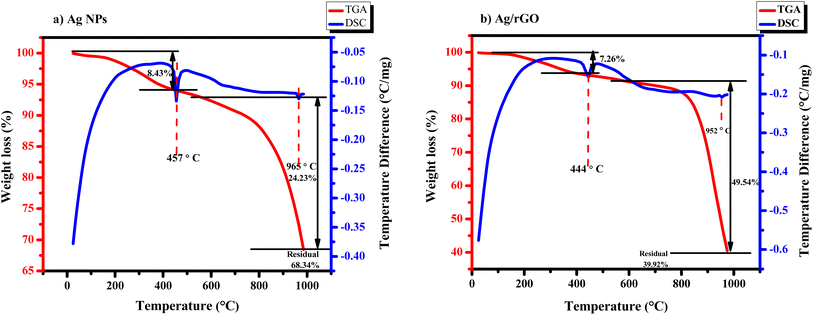
In order to investigate why the nanoparticles used showed strong sintering behaviour, the thermal properties of the particles were studied. TGA was used to monitor weight loss during heating, as shown in Fig. 7(a and b). However, Fig. 7a illustrates the TGA and DSC curve of Ag NPs.32 In which the degradation takes place in two steps. In the first stage, where degradation is from 25 to 400 °C, there was a small weight loss of 8.43% due to moisture adsorbed on the particle surface. The first endothermic peak appeared at 457 °C. It is also postulated that oxygen or other material was bonded or adsorbed to the surface of the Ag NPs and deboned at this stage. The second decomposition step that started at about 450 °C and we analysed up to 1000 °C almost degrades 24.23 wt% of Ag NPs out of the total weight. Lastly, the 68.34 wt% residual has remained. Moreover, the second exothermic peaks are observed clearly in the DSC curve of Ag NPs, which are at 965 °C.33Fig. 7b shows the thermal stability of the Ag/rGO nanocomposite, which is stable around 200 °C, and the thermal stability started decreasing as the temperature increased, but that might be due to the breakdown of carboxylic groups. Thermal stability analysis demonstrated an aggregate weight reduction of 7.27% up to 400 °C. Here the first endothermic peak appeared at 444 °C. Weight losses below this temperature could be an effect of adsorbed water. Next, it is observed that apparent weight loss occurred in the territory at 600–1000 °C. The 2nd endothermic peak is observed at 952 °C, which degrades 49.54 wt% of material. Compared with Ag NPs, Ag/rGO nanocomposites exhibit better thermal stability.34
3.8 DLS and zeta potential analysis
The most popular method for analyzing size and particle distribution is DLS. Fig. 8 demonstrated that the nano-synthesized Ag NPs had hydrodynamic diameter 258.4 nm and a polydisperse particle distribution. In addition to that, the size range of Ag NPs was 102–426 nm. However, the Ag/rGO shows hydrodynamic diameter 833.7 nm. From 1222–19![[thin space (1/6-em)]](https://www.rsc.org/images/entities/char_2009.gif) 069 nm Ag/rGO show size distribution because of rGO nanosheets. Compared to the findings of the FE-SEM pictures, the observed size of Ag NPs and Ag/rGO in DLS is same. This outcomes may explain by the fact that DLS characterizes Brownian motion, and the size distribution that results from a collection of NPs or nanocomposite in aqueous solution then yields an estimate of average hydrodynamic size.35
069 nm Ag/rGO show size distribution because of rGO nanosheets. Compared to the findings of the FE-SEM pictures, the observed size of Ag NPs and Ag/rGO in DLS is same. This outcomes may explain by the fact that DLS characterizes Brownian motion, and the size distribution that results from a collection of NPs or nanocomposite in aqueous solution then yields an estimate of average hydrodynamic size.35
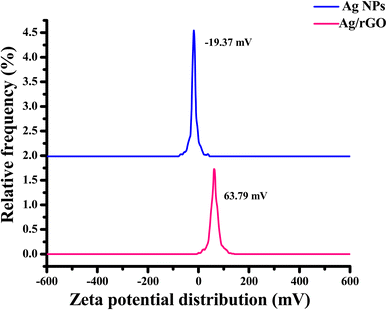
Aqueous colloidal solutions of Ag NPs reduced and stabilized by Bos taurus indicus urine exhibit long-term stability, according to the literature, because of the presence of carbolic acid, calcium, creatinine, phenol, urea, and arsenic hydroxide.36 Zeta potential assists in determining the stability and surface charge of nanomaterials. In the current study, the biogenically synthesized Ag NPs and nanocomposites zeta potential was discovered to be at −19.07 and 63.79 mV, respectively (in Fig. 9). This result suggests that there existed repulsion between the particles to preserve the particles' stable existence in a colloidal condition. The maximal electric charge on the surface of the particles is a result of the larger zeta potential value. Higher positive or negative values suggested that nanomaterial was more stable. Due to the capping of biomolecules, the produced Ag NPs in the current study demonstrated long-term stability.37
3.9 Catalytic performance of the Ag NPs and Ag/rGO nanocomposite: nitroarene reduction
Nitroarenes are toxic, so methods for transforming them must be developed. The direct reduction of 4-nitrophenol to 4-aminophenol (4-AP) was carried out using noble metals. Without any catalyst, reaction will not proceed positively. On the other hand, noble metals are harmful to environment and costly. Therefore, there is need of cost effective and alternative catalyst must develop. Our study is the first to show that morphologically variable Ag NPs and rGO, and their nanocomposite can be used to effectively reduce nitroarenes. In this study, we done the comparative study of Ag NPs and Ag/rGO nanocomposite for catalytic reduction of 4-NP to 4-AP using the reducing agent NaBH4.38Substrate adsorption and product desorption are the two steps involved in the catalysis of the 4-NP, as mentioned in the previous works.39 Furthermore, size, shape and surface area play important key role in determining the efficiency of the nanocatalyst. Key thing to remember that, particle size and surface area are inversely proportional. It is undeniable that, particle having high surface area and low cost are extremely helpful in reduction of the nitroarenes. For the further comparison we choose the three more nitroarenes with structural difference. In these compounds the position of the nitro group on the aromatic ring is different and the condition of the reaction is same for all. The reduction occurs rapidly within 3–12 min as given in Fig. 10–17.
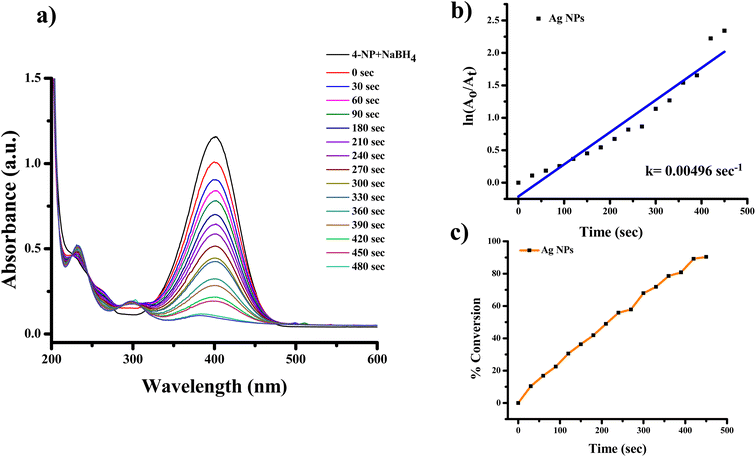 | ||
| Fig. 10 UV-visible spectra indicating (a) reduction of 4-nitrophenol to 4-aminophenol with Ag NPs, (b) kinetics of catalytic reduction and (c) percentage conversion of 4-nitrophenol. | ||
To start with, we employed Ag and Ag/rGO into reaction; as a result, we obtained the absorption spectra. Moreover, this spectrum is further modified into the ln(A0/At) versus time graph. This graph shows the positive slope with the straight line. We took 12 mM NaBH4 and the reaction was carried out at room temperature. The reducing agent i.e. NaBH4 is almost 80 times higher than the substrate in terms of concentration. Here reaction follows the pseudo-first-order reaction kinetics.40
Fig. 10 and 11 shows the 4-NP reduction spectra in the presence of Ag and Ag/rGO nanocomposite, respectively. 4-NP gives the highest adsorption at ∼317 nm (Fig. 10a and 11a) in aqueous medium which is pale yellow in colour. After the addition of nanocatalyst the reaction proceeds and the band at 400 nm start to diminish. This is due to nitrophenolate anions and the solution has lime green colour. Due to the clean conversion of reactant in to the single product there are two isosbestic peaks observed at ∼232 and ∼298 nm for both nanocatalysts. For these reactions the rate constant were found to be 0.00496 s−1 for Ag NPs and 0.00626 s−1 for the Ag/rGO nanocomposite. However, the rate constant was found from the plot of ln(A0/At) versus time [Fig. 10b and 11b]. Where A0 is the initial absorbance and At is the absorbance of the nitrophenolate during the reaction at time “t”. The order of efficiency is Ag/rGO > Ag NPs for reduction of 4-NP. In the synthetic organic chemistry, there are many nitro containing chemicals which were widely used. For further study we choose 3 more nitro-group containing chemicals and these chemicals are 2-NA, 3-NA and 4-NA. The reaction conditions are unaltered for these chemicals also.
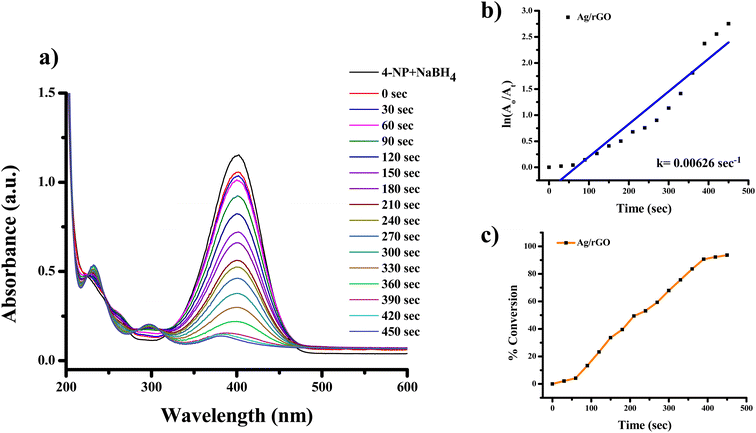 | ||
| Fig. 11 UV-visible spectra indicating (a) reduction of 4-nitrophenol to 4-aminophenol with Ag/rGO nanocomposite, (b) kinetics of catalytic reduction and (c) percentage conversion of 4-nitrophenol. | ||
The highest absorbance for 2-NA, 3-NA and 4-NA are 410, 359 and 381 nm, respectively (Fig. 12–17). The reducing peak intensity indicates the conversion of 2-NA to 2-aminoaniline (2-AA), 3-NA to 3-aminoaniline (3-AA) and 4-NA to 4-aminoaniline (4-AA) and it takes 3.5, 4 and 7.5 minute, respectively to complete the reaction using Ag NPs [Fig. 12a, 14a, and 16a]. Fig. 12b, 14b, and 16b demonstrate the plot of ln(A0/At) with time (min) which gives the k values 0.00507, 0.00547, and 0.00538 s−1 for 2-NA, 3-NA and 4-NA using the catalyst Ag NPs. Talking about Ag/rGO nanocomposite, to complete the reaction it takes the 5.5, 4.5 and 12.5 minute for conversion of 2-NA to 2-AA, 3-NA to 3-AA and 4-NA to 4-AA [Fig. 13, 15 and 17]. However, the rate constant of the reaction was 0.00301, 0.00373, and 0.00211 s−1, respectively.
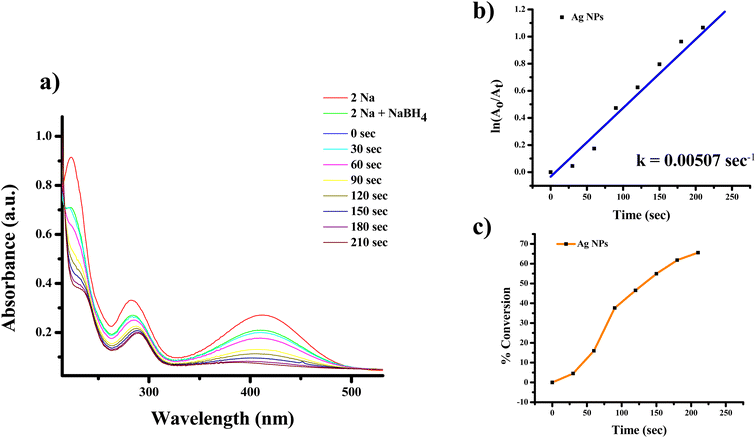 | ||
| Fig. 12 UV-Vis absorption spectra of (a) reduction of 2-nitroaniline to 2-aminoaniline with Ag NPs, (b) kinetics of catalytic reduction and (c) percentage conversion of 2-nitroaniline. | ||
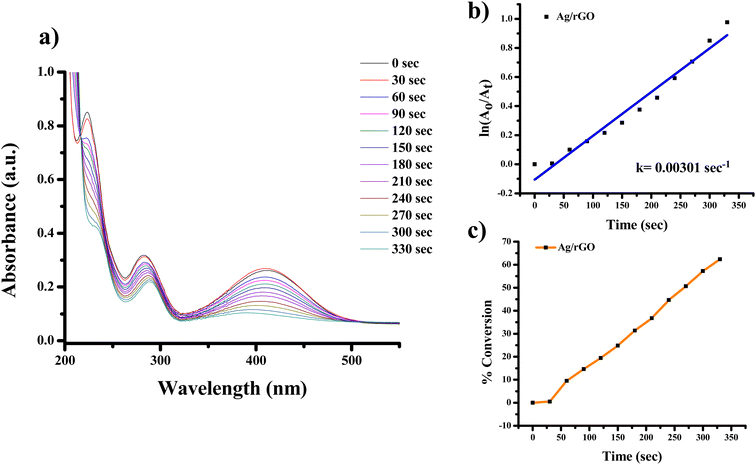 | ||
| Fig. 13 UV-Vis absorption spectra of (a) reduction of 2-nitroaniline to 2-aminoaniline with Ag/rGO nanocomposite, (b) kinetics of catalytic reduction and (c) percentage conversion of 2-nitroaniline. | ||
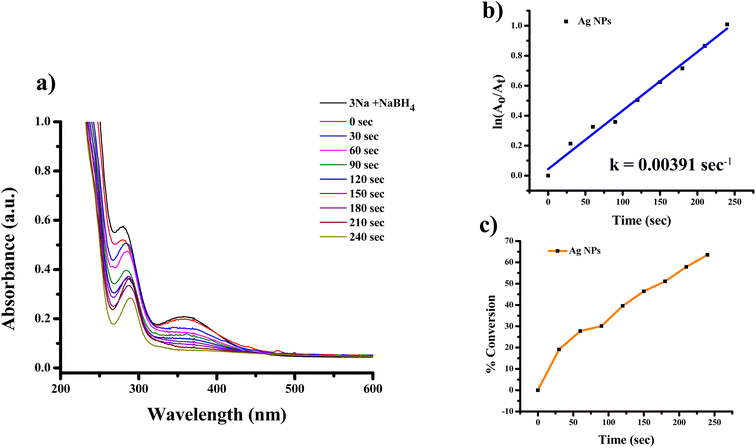 | ||
| Fig. 14 UV-Vis absorption spectra of (a) reduction of 3-nitroaniline to 3-aminoaniline with Ag NPs, (b) kinetics of catalytic reduction and (c) percentage conversion of 3-nitroaniline. | ||
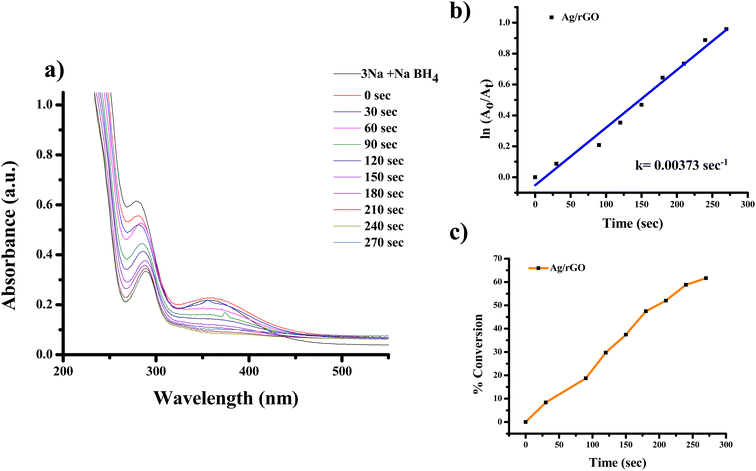 | ||
| Fig. 15 UV-Vis absorption spectra of (a) reduction of 3-nitroaniline to 3-aminoaniline with Ag/rGO nanocomposite, (b) kinetics of catalytic reduction and (c) percentage conversion of 3-nitroaniline. | ||
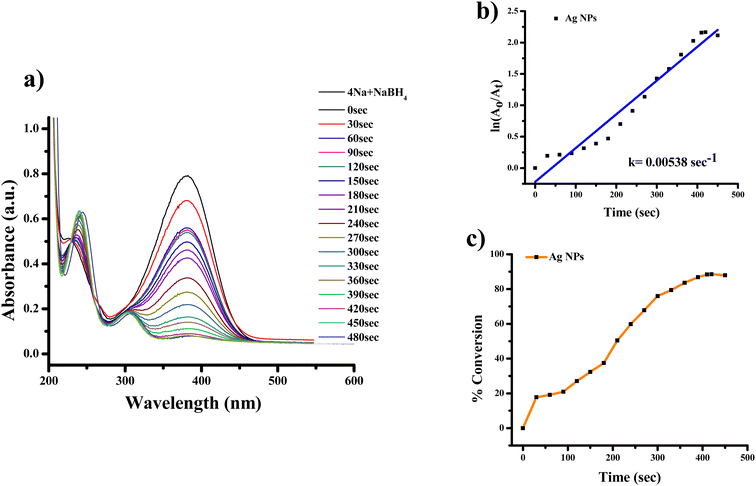 | ||
| Fig. 16 UV-Vis absorption spectra of (a) reduction of 4-nitroaniline to 4-aminoaniline with Ag NPs, (b) kinetics of catalytic reduction and (c) percentage conversion of 4-nitroaniline. | ||
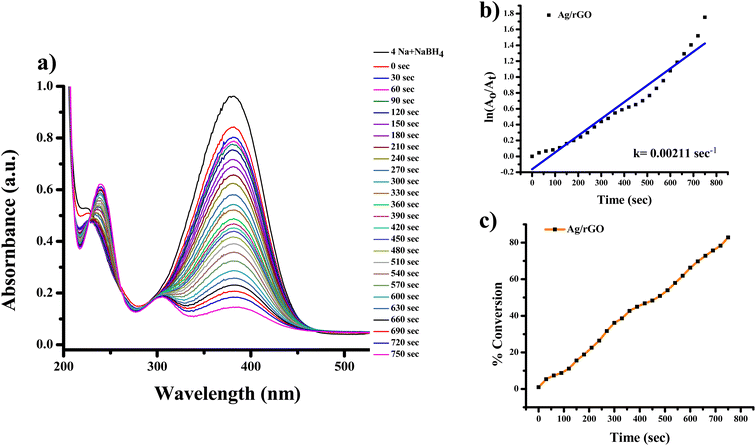 | ||
| Fig. 17 UV-Vis absorption spectra of (a) reduction of 4-nitroaniline to 4-aminoaniline with Ag/rGO nanocomposite, (b) kinetics of catalytic reduction and (c) percentage conversion of 4-nitroaniline. | ||
Herewith, Table 1 represents the comparative study of catalytic reduction of nitroarenes using different nanocatalyst. Furthermore, we study the comparison of the parameters such as concentration, volume, and amount of reactant/nanocatalyst and their molar ratio.4,41–43 Another important consideration is thermal treatment; in previous work,4 we treated the Ag NPs at 495 °C for 1 hour. When compared to previous studies, the as-prepared Ag NPs exhibit a greater reduction of nitroarenes when thermally treated at 200 °C for 1 hour.
| S. no. | Nano-catalyst | Aromatic nitroarene chemical | Nitroarene conc. in mM (vol. in ml) | NaBH4 conc. in mM (vol. in ml) | Catalyst conc. in mg ml−1 (vol. in μl) | Molar ratio | Rate constant (s−1) | Reference |
|---|---|---|---|---|---|---|---|---|
| 1 | Ag | 4-NP | 0.1 (1) | 50 (1.5) | 1 (200) | 1![[thin space (1/6-em)]](https://www.rsc.org/images/entities/char_2009.gif) : :![[thin space (1/6-em)]](https://www.rsc.org/images/entities/char_2009.gif) 750 750 |
0.0051 | 4 |
| 2 | Pd | 4-NP | 15 (20 μl) | 7500 (0.02) | 0.1 (30) | 1![[thin space (1/6-em)]](https://www.rsc.org/images/entities/char_2009.gif) : :![[thin space (1/6-em)]](https://www.rsc.org/images/entities/char_2009.gif) 500 500 |
0.0056 | 34 |
| 3 | Ag–Au-rGO | 4-NP | 5 (2.8) | 10 (0.2) | 0.1 | 7![[thin space (1/6-em)]](https://www.rsc.org/images/entities/char_2009.gif) : :![[thin space (1/6-em)]](https://www.rsc.org/images/entities/char_2009.gif) 1 1 |
0.00347 | 35 |
| 4 | Ag/3D-rGO | 4-NP | 0.1 (50) | 300 (5) | 0.1 (30) | 1![[thin space (1/6-em)]](https://www.rsc.org/images/entities/char_2009.gif) : :![[thin space (1/6-em)]](https://www.rsc.org/images/entities/char_2009.gif) 1500 1500 |
0.0197 | 36 |
| 5 | Ag (thermally treated 200 °C) | 4-NP | 0.15 (1) | 12 (1) | 0.05 (200) | 1![[thin space (1/6-em)]](https://www.rsc.org/images/entities/char_2009.gif) : :![[thin space (1/6-em)]](https://www.rsc.org/images/entities/char_2009.gif) 80 80 |
0.00496 | This work |
| 6 | Ag/rGO | 2-NA | 0.15 (1) | 12 (1) | 0.05 (200) | 0.00507 | ||
| 3-NA | 0.15 (1) | 12 (1) | 0.05 (200) | 0.00547 | ||||
| 4-NA | 0.15 (1) | 12 (1) | 0.05 (200) | 0.00538 | ||||
| 4-NP | 0.15 (1) | 12 (1) | 0.05 (200) | 0.00626 | This work | |||
| 2-NA | 0.15 (1) | 12 (1) | 0.05 (200) | 0.00301 | ||||
| 3-NA | 0.15 (1) | 12 (1) | 0.05 (200) | 0.00373 | ||||
| 4-NA | 0.15 (1) | 12 (1) | 0.05 (200) | 0.00211 |
3.10 Antimicrobial activity of Ag and Ag/rGO nanocomposite
The photograph showing antimicrobial activity is shown in Fig. 18 and value (in mm) of zone of inhibition is shown in Table 2. If we observe the zone of inhibition for both microbes then we notice that zone of inhibition is more for E. coli as compared to S. aureus and this may be because of the thickness of cell wall.44,45 E. coli bacteria is a Gram-negative and its peptidoglycan layer is thin having thickness of 5 to 10 nm. But S. aureus is Gram positive bacteria having the dense homogeneous peptidoglycan layer of thickness 20 to 40 nm, that may be the exact reason why zone of inhibition is more for E. coli as compared to S. aureus.46,47 Furthermore, the sonication time and the agar concentration also influence the zone of inhibition. Although the inhibition zones for Ag NPs and Ag/rGO nanocomposites are of comparable sizes, the significant finding after taking into consideration Ag concentration in Ag NPs and Ag/rGO nanocomposites is that the inhibition zones for Ag/rGO are more promising as Ag concentration in Ag/rGO is negligibly small as compared to Ag in Ag NPs. The antimicrobial activity was also checked for the fungal species namely Aspergillus niger and Candida but they did not show any antifungal activity.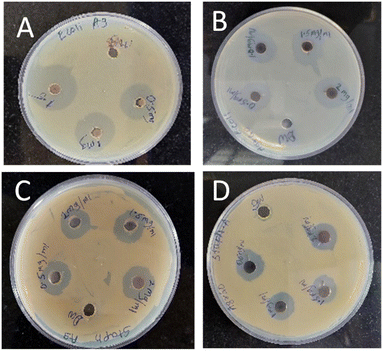 | ||
| Fig. 18 Antimicrobial activity of NPs (A) Ag NPs on E. coli, (B) Ag/rGO NPs on E. coli, (C) Ag NPs on S. aureus, (D) Ag/rGO on S. aureus. Distilled water was used a control. | ||
| (a) Effect of Ag NPs on growth of bacterial species | |||
|---|---|---|---|
| S. no | Concentration of Ag nanoparticle (mg ml−1) | Zone of inhibition for E. coli (mm) | Zone of inhibition for Staphylococcus aureus (mm) |
| 1 | 0.5 | 25 | 20 |
| 2 | 1.0 | 27 | 22 |
| 3 | 1.5 | 32 | 22 |
| 4 | 2.0 | 35 | 22 |
| (b) Effect of Ag/rGO nanocomposite on growth of bacterial species | |||
|---|---|---|---|
| S. no | Concentration of Ag/rGO (mg ml−1) | Zone of inhibition for E. coli (mm) | Zone of inhibition for Staphylococcus aureus (mm) |
| 1 | 0.5 | 20 | 18 |
| 2 | 1.0 | 22 | 20 |
| 3 | 1.5 | 25 | 21 |
| 4 | 2.0 | 26 | 21 |
3.11 FRAP activity of Ag and Ag/rGO nanoparticles
Fig. 19 depicts the magnitude of reduction concerning absorbances. In the case of ascorbic acid, the absorbance increased from 0.454 (5 μg ml−1) to 1.830 (30 μg ml−1).48 Both Ag NPs and Ag/rGO NPs showed similar findings. In case of Ag NPs the absorbance changed from 0.258 (5 μg ml−1) to 1.001 (30 μg ml−1). Ag/rGO NPs showed change in absorbance 0.266 (5 μg ml−1) to 0.803 (30 μg ml−1). According to the finding, Ag NPs and Ag/rGO NPs both have activity for ferric reduction. However, the comparison between Ag NPs and Ag/rGO nanocomposites can only be made if the silver concentrations in both the materials are taken into consideration. Fig. 20 shows the antioxidant effect of Ag/rGO nanocomposites as a function of Ag concentration in the Ag/rGO composite. On comparing the plot of Ag NPs in Fig. 19 with Fig. 20, we observe that the antioxidant activity is enhanced almost 50 times (these findings are found when we calculate the amount of Ag in the Ag/rGO nanocomposites) for Ag/rGO nanocomposites as compared to Ag NPs. Furthermore, it is around 30 times more than ascorbic acid, which is used here as a standard. Fig. 20 a diagram depicting the concentration of Ag in an Ag/rGO nanocomposite that enhances antioxidant activity. This unbelievable finding, along with the antimicrobial studies noted above, signifies the importance of such nanocomposites in medicinal chemistry for treating bacterial infections and hence can act as a potential candidate in the formulation of antibacterial creams for external use. | ||
| Fig. 20 Plot showing enhancement of antioxidant activity as a function of Ag in an Ag/rGO nanocomposite. | ||
4 Conclusions
This research study was designed to demonstrate that in situ synthesis of Ag/rGO nanocomposite using Bos taurus indicus urine, where this metabolic waste acts as a great reducing agent according to earlier reports. Ag NPs were successfully biogenically in situ formed on the surface of rGO nanosheets using cow urine. The Ag/rGO nanocomposite revealed that the synergetic interactions between supported Ag NPs and rGO sheets led to a significant improvement in the catalytic performance of Ag/rGO, including improved catalytic ability.The use of advanced characterization techniques confirms and studies the properties of Ag/rGO nanocomposites. Without any specific agglomeration, TEM and FE-SEM images reveal the formation of Ag NPs (due to the thermal treatment) and Ag/rGO (due to rGO nanosheets support) nanocomposites. DLS as well as FESEM suggest the particle size of Ag NPs (both thermally treated and Ag/rGO nanocomposite) is around 100–500 nm. Analysis of both nanomaterials by using TGA and zeta potential graphs revealed that the material showed thermal stability of Ag NPs > Ag/rGO and potential stability of Ag NPs < Ag/rGO.
The results demonstrated a simple, affordable, and green method for producing Ag NPs and Ag/rGO nanocomposites with beneficial antioxidant and antibacterial properties. Polydispersed Ag NPs provided a lot of surface area for catalytic reaction active sites. Additionally, at room temperature, the Ag/rGO nanocomposite showed strong catalytic activity for the reduction of nitroarenes. The antibacterial and antioxidant properties of as-prepared nanomaterials were observed to be excellent in this study, implying that they may be useful for drug administration in the future. This incredible finding signifies the importance of such nanocomposites in medicinal chemistry for treating the bacterial infections and hence can act as a potential candidate in formulation of antibacterial creams for external use.
Data availability
The data that support the findings of this study are available from the corresponding author upon reasonable request.Conflicts of interest
There is no conflict of interest for the publication of article.Acknowledgements
We all the authors hereby declare that this research work is never financially supported by any organization. The authors are thankful to Miss Ankita Dhukate, Miss Sarita Jadhav, Mr Rupesh S. Pendanekar and Miss Richa Singhan for possible help during the progress of research work.References
- L. Wang, H. Xu, Y. Qiu, X. Liu, W. Huang, N. Yan and Z. Qu, J. Hazard. Mater., 2019, 121824 Search PubMed.
- S. Joseph and B. Mathew, Mater. Sci. Eng., B, 2015, 195, 90–97 CrossRef CAS.
- W. Qing, K. Chen, Y. Wang, X. Liu and M. Lu, Appl. Surf. Sci., 2017, 423, 1019–1024 CrossRef CAS.
- P. D. Sarvalkar, R. R. Mandavkar, M. S. Nimbalkar, K. K. Sharma, P. S. Patil, G. S. Kamble and N. R. Prasad, Sci. Rep., 2021, 11, 1–17 CrossRef PubMed.
- X. Liang, X. Chen, Z. Xiang, R. Yan, H. Xi, T. Bian, J. Zhang, J. Zhao, Q. Cai and H. Wang, Appl. Surf. Sci., 2018, 459, 716–722 CrossRef CAS.
- J. R. Chiou, B. H. Lai, K. C. Hsu and D. H. Chen, J. Hazard. Mater., 2013, 248–249, 394–400 CrossRef CAS PubMed.
- M. Nasrollahzadeh, M. Sajjadi, M. Maham, S. M. Sajadi and A. A. Barzinjy, Mater. Res. Bull., 2018, 102, 24–35 CrossRef CAS.
- P. D. Sarvalkar, S. D. Barawkar, O. S. Karvekar, P. D. Patil, S. R. Prasad, K. K. Sharma, R. Neeraj and R. S. Vhatkar, J. Text. Inst., 2022, 1–18 Search PubMed.
- N. Z. Srećković, Z. P. Nedić, D. Liberti, D. M. Monti, N. R. Mihailović, J. S. Katanić Stanković, S. Dimitrijević and V. B. Mihailović, RSC Adv., 2021, 11, 35585–35599 RSC.
- A. Ebrahimi, E. K. Goharshadi and M. Mohammadi, Mater. Chem. Phys., 2022, 275, 125258 CrossRef CAS.
- E. K. Goharshadi, K. Goharshadi and M. Moghayedi, Coord. Chem. Rev., 2022, 464, 214559 CrossRef CAS.
- R. S. Hamida, M. A. Ali, A. Redhwan and M. M. Bin-Meferij, Int. J. Nanomedicine, 2020, 15, 6033–6066 CrossRef CAS PubMed.
- O. S. Karvekar, A. S. Vadanagekar, P. D. Sarvalkar, S. S. Suryawanshi, S. M. Jadhav, R. D. Singhan, J. P. Jadhav, K. K. K. Sharma and N. R. Prasad, Sci. Rep., 2022, 1–17 Search PubMed.
- O. S. Karvekar, P. D. Sarvalkar, A. S. Vadanagekar, R. D. Singhan, S. M. Jadhav, M. S. Nimbalkar and N. R. Prasad, Appl. Nanosci., 2022, 12, 2207–2226 CrossRef CAS PubMed.
- H. Dabhane, S. Ghotekar, P. Tambade, S. Pansambal, H. C. Ananda Murthy, R. Oza and V. Medhane, J. Water Environ. Nanotechnol., 2021, 6, 81–91 CAS.
- D. C. Marcano, D. V. Kosynkin, J. M. Berlin, A. Sinitskii, Z. Sun, A. Slesarev, L. B. Alemany, W. Lu and J. M. Tour, ACS Nano, 2010, 4, 4806–4814 CrossRef CAS PubMed.
- S. Adarsh Rag, M. Selvakumar, S. Bhat, S. Chidangil and S. De, J. Electron. Mater., 2020, 49, 985–994 CrossRef CAS.
- I. F. F. Benzie and J. J. Strain, Anal. Biochem., 1996, 239, 70–76 CrossRef CAS PubMed.
- N. Belachew, D. S. Meshesha and K. Basavaiah, RSC Adv., 2019, 9, 39264–39271 RSC.
- Y. Guo, X. Yang, K. Ruan, J. Kong, M. Dong, J. Zhang, J. Gu and Z. Guo, ACS Appl. Mater. Interfaces, 2019, 11, 25465–25473 CrossRef CAS PubMed.
- Y. Li, Q. Song, B. Fan and R. Zhang, Mater. Res. Express, 2017, 4, 015014 CrossRef.
- J. Y. Park, Y. J. Lee, K. W. Jun, J. O. Baeg and D. J. Yim, J. Ind. Eng. Chem., 2006, 12, 882–887 CAS.
- M. Moghayedi, E. K. Goharshadi, K. Ghazvini, H. Ahmadzadeh, L. Ranjbaran, R. Masoudi and R. Ludwig, Colloids Surf., B, 2017, 159, 366–374 CrossRef CAS PubMed.
- M. Zhang, Y. Zhao, L. Yan, R. Peltier, W. Hui, X. Yao, Y. Cui, X. Chen, H. Sun and Z. Wang, ACS Appl. Mater. Interfaces, 2016, 8, 8834–8840 CrossRef CAS PubMed.
- B. M. Patil and A. A. Hooli, J. Nanosci., NanoEng. Appl., 2013, 1–8 CAS.
- K. Saoud, R. Alsoubaihi, N. Bensalah, T. Bora, M. Bertino and J. Dutta, Mater. Res. Bull., 2015, 63, 134–140 CrossRef CAS.
- L. D. Vuong, N. D. T. Luan, D. D. H. Ngoc, P. T. Anh and V. V. Q. Bao, Int. J. Nanosci., 2017, 16, 1–8 CrossRef.
- K. C. Hsu and D. H. Chen, Nanoscale Res. Lett., 2014, 9, 1–9 CrossRef PubMed.
- R. Xiong, K. Hu, S. Zhang, C. Lu and V. V. Tsukruk, ACS Nano, 2016, 10, 6702–6715 CrossRef CAS PubMed.
- S. Samiee and E. K. Goharshadi, J. Nanopart. Res., 2014, 16, 1–16 CrossRef CAS.
- X. Zhang, S. Chen, Z. Ling, X. Zhou, D. Y. Ding, Y. S. Kim and F. Xu, Sci. Rep., 2017, 7, 1–10 CrossRef PubMed.
- J. Shen, M. Shi, B. Yan, H. Ma, N. Li and M. Ye, J. Mater. Chem., 2011, 21, 7795–7801 RSC.
- L. He and S. C. Tjong, RSC Adv., 2015, 5, 15070–15076 RSC.
- R. Geetha Bai, K. Muthoosamy, F. N. Shipton, A. Pandikumar, P. Rameshkumar, N. M. Huang and S. Manickam, RSC Adv., 2016, 6, 36576–36587 RSC.
- N. Noor, S. Mutalik, M. W. Younas, C. Y. Chan, S. Thakur, F. Wang, M. Z. Yao, Q. Mou and P. H. M. Leung, Polymers, 2019, 11, 1–21 CrossRef PubMed.
- R. Krishnamoorthi, P. U. Mahalingam and B. Malaikozhundan, Inorg. Chem. Commun., 2022, 139, 109362 CrossRef CAS.
- M. Ahamed, M. J. Akhtar, M. A. Majeed Khan and H. A. Alhadlaq, Polymers, 2021, 13, 1–14 CrossRef PubMed.
- S. Wageh, L. He, A. A. Al-Ghamdi, Y. A. Al-Turki and S. C. Tjong, RSC Adv., 2014, 4, 28426–28431 RSC.
- M. A. Ali, C. Singh, S. Srivastava, P. Admane, V. V. Agrawal, G. Sumana, R. John, A. Panda, L. Dong and B. D. Malhotra, RSC Adv., 2017, 7, 35982–35991 RSC.
- M. Chen, L. Wei, W. Zhang, C. Wang and C. Xiao, RSC Adv., 2021, 11, 22287–22296 RSC.
- M. N. Padvi, S. R. Prasad, Y. I. Shaikh, S. S. Suryawanshi, A. P. Samant, L. S. Chaudhary and N. R. Prasad, SN Appl. Sci., 2020, 2, 1–12 Search PubMed.
- H. K. Hareesh, R. P. Joshi, D. V. Sunitha, V. N. Bhoraskar and S. D. Dhole, Appl. Surf. Sci., 2016, 389, 1050–1055 CrossRef.
- X.-W. Han, S. Guo, T. Li, J. Peng and H. Pan, Colloids Surf., A, 2022, 650, 128688 CrossRef CAS.
- Y. Liu, L. He, A. Mustapha, H. Li, Z. Q. Hu and M. Lin, J. Appl. Microbiol., 2009, 107, 1193–1201 CrossRef CAS PubMed.
- Y. Xie, Y. He, P. L. Irwin, T. Jin and X. Shi, Appl. Environ. Microbiol., 2011, 77, 2325–2331 CrossRef CAS PubMed.
- N. Cioffi, N. Ditaranto, L. Torsi and L. Sabbatini, in Nanotechnologies for the Life Sciences, Wiley Online Library, 2007, vol. 1, pp. 3–70 Search PubMed.
- R. G. Bailey, R. D. Turner, N. Mullin, N. Clarke, S. J. Foster and J. K. Hobbs, Biophys. J., 2014, 107, 2538–2545 CrossRef CAS PubMed.
- F. Ijaz, S. Shahid, S. A. Khan, W. Ahmad and S. Zaman, Trop. J. Pharm. Res., 2017, 16, 743–753 CrossRef CAS.
Footnotes |
| † Electronic supplementary information (ESI) available. See DOI: https://doi.org/10.1039/d2ra06280a |
| ‡ Gouri S. Kumbhar and Shubham V. Patil both authors equally contributed. |
| This journal is © The Royal Society of Chemistry 2022 |


