 Open Access Article
Palladium nanoparticles on chitin-derived nitrogen-doped carbon materials for carbon dioxide hydrogenation into formic acid†
Jingyu Wang‡
a,
Lei Zhang‡a,
Fangming Jin *ab and
Xi Chen
 *a
*a
aChina-UK Low Carbon College, Shanghai Jiao Tong University, 3 Yinlian Rd, 201306, Shanghai, China. E-mail: chenxi-lcc@sjtu.edu.cn; fmjin@sjtu.edu.cn
bSchool of Environmental Science and Engineering, Shanghai Jiao Tong University, 201306, Shanghai, China
First published on 25th November 2022
Abstract
Utilizing waste carbon resources to produce chemicals and materials is beneficial to mitigate the fossil fuel consumption and the global warming. In this study, ocean-based chitin biomass and waste shrimp shell powders were employed as the feedstock to prepare Pd loaded nitrogen-doped carbon materials as the catalysts for carbon dioxide (CO2)/bicarbonate hydrogenation into formic acid, which simultaneously converts waste biomass into useful materials and CO2 into a valuable chemical. Three different preparation methods were examined, and the two-stage calcination was the most efficient one to obtain N-doped carbon material with good physicochemical properties as the best Pd support. The highest formic acid yield was achieved of ∼77% at 100 °C in water with KHCO3 substrate under optimal condition with a TON of 610. The nitrogen content and N functionalities of the as-synthesized carbon materials were crucial which could serve as anchor sites for the Pd precursor and assist the formation of well-dispersed and small-sized Pd NPs for boosted catalytic activity. The study puts forward a facile, inexpensive and environmentally benign way for simultaneous valorization of oceanic waste biomass and carbon dioxide into valuable products.
1. Introduction
Owing to the overuse of fossil fuels, a huge amount of anthropogenic carbon dioxide (CO2) has been emitted into the atmosphere, which has caused several serious environmental problems, such as global warming, air pollution and so on.1,2 To tackle with these problems, scientists have explored along different directions, such as the valorization of renewable feedstock alternatives to fossil fuels,3–6 CO2 capture and storage,1 and CO2 refinery and utilization.7–10 As a non-toxic, cheap, and abundant C1 renewable carbon resource, CO2 utilization for value-added compounds and energy products furnishes as a promising approach to not only alleviating the greenhouse effect but also bringing about extra environmental and economic values.11 So far, great achievements have been made in the chemical transformation of CO2 into diverse chemicals, fuels, and materials.12–15 Among them, the CO2 hydrogenation into formic acid (FA) has gained extensive attentions. FA is a useful chemical commodity with wide applications in agricultures, foods, textiles, road deicing, medicals, leather, and tanning industries, etc.16,17 It is also a precursor for the synthesis of diverse compounds such as organic alcohols, esters, acids, and so on.12 Besides, FA holds the great potential in global energy transition as a promising energy carrier for H2.18–22 Considering the low density and high explosion risk of hydrogen, the hydrogenation of bicarbonate to FA has been widely explored,21,23–25 which can not only improve the volumetric hydrogen density of the hydrogen storage system,22 but also is much safer and easier for hydrogen storage and transportation, enabling the construction of mobile energy storage devices. For FA production from CO2, people usually add nonaqueous electrolytes like KOH/methanol (i.e. KOH/CH3OH), Na2CO3, CaCO3, etc., to enhance the CO2 solubility and suppress hydrogen evolution reaction in order to promote the hydrogenation of CO2 to FA,19,26 under which condition HCO3− is thought to be the real substrate,2,17,27 and the solubility of bicarbonate was found to have a significant impact on the yield of FA.22,28 Thus, it will be more efficient to use alkali metal bicarbonate with high solubility, like KHCO3, as the substrate for hydrogenation to produce FA.2,21,27,28Homogeneous catalysts have exhibited excellent catalytic performance for CO2/bicarbonate hydrogenation into FA,2,18 however, the difficulty of the separation and recovery of catalysts as well as the expensive cost of the ligands adopted significantly limit their practical applications. By comparison, the development of efficient heterogeneous routes for this reaction is relatively challenging but also quite attractive due to the simple recycling and separation of heterogeneous catalysts, and the rational design of heterogeneous catalysts is important to achieve high catalytic activity under relatively mild conditions.4,23,29–36 Carbon-supported Pd NPs materials are the most employed heterogeneous catalysts for CO2/bicarbonate hydrogenation into FA.19,27,28,37 Notably, many studies have demonstrated that the incorporation of nitrogen into the carbon supports could beneficially improve the catalytic performance and reaction efficiency.19,28,38 The nitrogen functionalities on the support surface enable stronger metal–support interaction to facilitate the formation of small-sized Pd NPs and serve as basic sites to stimulate CO2 adsorption and activation.28,39 For example, Pd/g-C3N4 catalyst was much superior to the nitrogen-free Pd/CNT catalyst for CO2 hydrogenation into FA,40 and Pd on N-doped mesoporous carbon (NMC) showed excellent performance for KHCO3 hydrogenation into FA.28 However, the conventional methods for the preparation of N-doped carbon support usually need to add acetonitrile, cyanamide, aniline, ammonia, etc., as the nitrogen additives, and mesoporous silica, zeolite, molecular sieve, etc., as the hard templates, and corrosive chemicals like HF are also required to remove the templates subsequently, which not only suffered from the complicated procedures, but also high capital cost and high operation risk.21,27,28,38,41–54
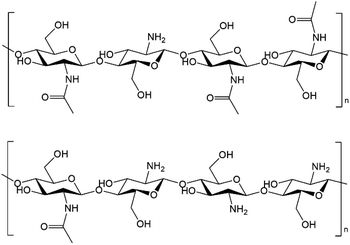
In recent years, the concept of “Shell Biorefinery” has been proposed by Yan's group, pointing out the huge prospect of utilizing chitin biomass and corresponding derivatives as the platform resources to produce chemicals and materials.17,55–61 Chitin is an abundant, low-cost and widely available polymer from shell wastes like crab, lobster, and shrimp in the seafood processing industry (about 8 million tons every year around the world). Crustacean shells contain 15–40% chitin, 20–40% protein and 20–50% calcium carbonate, while waste shells are often just dumped in landfill or the sea, which have caused high treatment cost and environmental pollution.55 Chitin naturally contains nitrogen element in the structure in the form of acetyl amide/amine functionality, and chitosan, the main derivative of chitin, is produced by the alkaline deacetylation of chitin. There is actually no clear nomenclature border between chitin and chitosan, but the polymer is denoted as chitin when the degree of deacetylation (DD) is smaller than 40%. The molecular structures of chitin and chitosan are shown in Fig. 1. People have explored novel transformation routes to synthesize diverse valuable platform chemicals and a variety of complex molecules from chitin and its derivatives.17,62–69 Using chitin as the feedstock to fabricate N-doped carbon materials offers a simple, sustainable, environmentally benign and inexpensive way, bypassing the engagement of external nitrogen additives/templates.70–81 To the best of our knowledge, Pd on N-doped carbon materials directly derived from chitin/shrimp shell waste has not yet been attempted for CO2/bicarbonate hydrogenation into FA.
In the study, three methods including hydrothermal calcination, direct calcination, and two-stage calcination were attempted to prepare chitin into a series of N-doped carbon materials, after which the original structure of chitin all lost and formed mesoporous carbon with large surface area, high nitrogen content and various N functionalities. The N-doped carbon materials were applied as Pd supports to catalyse the hydrogenation of bicarbonate salts into FA. From the catalytic test results, Pd NPs on carbon prepared by two-stage calcination method (Pd/C-TC) exhibited the best performance to convert KHCO3 into FA in water with the highest yield of ∼77% at 100 °C under optimal condition (TON 610). Based on various characterizations, the C-TC materials boasted the largest surface area and pore volume, and the highest nitrogen content compared with those by the other two methods. The rich N functionalities on the surface of C-TC serve as anchor sites that promoting the formation of small-sized Pd NPs (∼1.5 nm) with good dispersion, which is probably responsible for the superior hydrogenation ability, and the pyridinic N in the support would be particularly helpful to improve the performance of catalysts. Besides chitin, the waste shrimp shell powders were also used as the feedstock for the synthesis of carbon materials (denoted as S-750 and S-TC), and Pd/S-TC efficiently catalysed the KHCO3 hydrogenation into FA with satisfactory yields under relatively mild condition. This work exemplified a simple, green and effective approach for catalyst preparation from waste oceanic biomass for FA production from CO2/bicarbonates, contributing to the management of waste carbon and the sustainable development of the society.
2. Experimental
2.1 Chemicals and materials
Chitin was supplied by Wako Pure Chemical Industry. Potassium bicarbonate (KHCO3, >99%) and sodium bicarbonate (NaHCO3, ≥99%) were purchased from Accela ChemBio Co., Ltd. Ammonium bicarbonate (NH4HCO3, AR), FA (≥98%, AR) and sodium hydroxide (NaOH, 96%, AR) were obtained from Aladdin Reagent Company. Palladium(II) chloride (PdCl2, >99%, Pd: 59%, RG), acetic acid glacial (99%, AR) and sodium borohydride (NaBH4, 98%) were provided by Adamas Reagent Co., Ltd. Sulfuric acid (H2SO4, 98%) and hydrochloric acid (HCl, 37%) were supplied by Shanghai Hushi Co., Ltd. Hydrogen (H2, 99.999%) and nitrogen (N2, 99.999%) were provided by Wendong (Shanghai) Chemical Co., Ltd. Microcrystalline cellulose (100–200 mesh) was provided by Meryer (Shanghai) Chemical Technology Co., Ltd. Ethanol (75%) was bought from Sinopharm Chemical Reagent Co., Ltd. Deionized (DI) water was prepared on site by a Millipore-Q System. All chemicals in the study were used as received without further treatment.The Greasyback Shrimps used in the study were purchased from local supermarket (Shanghai, China). Prior to lab use, the shrimps were cooked in boiling water for 1 h to peeled off the shrimp shell with the shrimp meat consumed, and only the shells on the back were collected. Three simple and cheap steps were applied to process the shells for future use: washed thoroughly with DI water, dried in an oven at 60 °C overnight, and finally ground into powder with a kitchen blender.
2.2 Preparation of chitin-derived N-doped carbon materials
Three different methods (hydrothermal calcination, direct calcination and two-stage calcination) were attempted to prepare the N-doped carbon materials from chitin, and all calcination processes were conducted in a tubular furnace equipped with a quartz tube under N2 atmosphere (flow rate: 50 mL min−1). For the hydrothermal calcination, 0.5 g chitin, a magnetic stirrer bar and 5 mL DI water were added into a 20 mL stainless-steel reactor, then the reactor was sealed and put into a heating mantle, followed by hydrothermal treatment at 180 °C for 12 h. After the reaction, the reactor was cooled down to room temperature by running water, and the resulting brown to brownish-red material was filtered thoroughly with DI water for several times, then dried in the vacuum oven at 80 °C overnight. The final calcination stage was performed at 750 °C for 2 h at a heating rate of 5 °C min−1, and the product in the quartz tube was collected after the tubular furnace cooled down by air, and ground into powder with an agate mortar. The as-prepared product was denoted as C-HC. For the direct calcination of chitin, a certain amount of chitin was calcinated at desired temperature (e.g., 500 °C, 600 °C and 700 °C), holding for 4 h at a heating rate of 10 °C min−1. The samples were denoted as C-X (where X refers to the target calcination temperature). For the two-stage calcination, the furnace with chitin loaded into the quartz tube was first preheated from room temperature to 300 °C at a heating rate of 2 °C min−1, holding for 1.5 h, then the sample was further calcinated at 600 °C for 2 h at a heating rate of 5 °C min−1. The as-prepared product was denoted as C-TC. For comparison, microcrystalline cellulose was used as the feedstock to prepare non-N-doped carbon material with the same two-stage calcination procedure (denoted as MC-TC).2.3 Preparation of N-doped carbon materials from shrimp shell waste
The fresh Greasyback Shrimps were bought from the local supermarket and boiled with DI water, and only the shrimp shells on the back were collected for future analysis and lab use. The moisture content of the shrimp shell was determined by the change of mass after drying overnight in the oven at 80 °C. The protein content of dried shrimp shell was determined by the change of mass after stirring the dried shrimp shell powder in 5 wt% NaOH solution at 90 °C for 2 h, then filtered and thoroughly washed with DI water, and finally dried in the oven at 80 °C overnight. The protein-removed shell powder was further treated with 5 wt% HCl solution at 30 °C for 2 h to determine the content of CaCO3. The final solid residue was the chitin contained in the shrimp shell. Two preparation methods (the direct and two-stage calcination) were employed to prepare the N-doped carbon materials from shrimp shell powders, which were denoted as S-750 and S-TC. After calcination, an acid treatment step was used to remove the residual CaCO3. The calcinated samples were immersed in 2 mol L−1 acetic acid solution for 36 h. Then, the solid residue was washed with DI water thoroughly and dried in the oven at 80 °C overnight.2.4 Preparation of Pd/chitin-derived N-doped carbon catalysts
The Pd NPs on chitin-derived N-doped carbon catalysts (Pd/C-HC, Pd/C-600, Pd/C-TC, etc.) were synthesized by using a simple wet chemical reduction method. The desired amount of Pd precursor (PdCl2 solution) and the prepared N-doped carbon material were added into ethanol and stirred for 30 min at 30 °C with a magnetic stirrer bar. Next, 1 mol L−1 NaOH solution was added to adjust the pH to ∼11 and continued stirring for 1 h. Then, excessive NaBH4 (n(NaBH4)/n(Pd) = 15/1) was added into the mixture and stirred. After that, the formed catalyst was filtered and thoroughly washed with DI water, and finally dried in the vacuum oven at 80 °C overnight.2.5 General reaction procedures
The hydrogenation of bicarbonates into FA was carried out in a 20 mL stainless-steel reactor. In a typical experiment, a magnetic stirrer bar, 5 mmol substrate, the calculated amount of catalyst and 5 mL DI water were added into the reactor, then the reactor was sealed. Following that, the reactor was purged with H2 for three times to expel the air and then charged to the desired pressure with H2. The reactor was placed into the preheated mantle at the target temperature for a desired period of time with a stirring speed of 600 rpm. After the reaction, the reactor was quickly cooled down to room temperature by running water. Next, the reaction mixture was filtered with a 0.45 μm polyethersulfone (PES) syringe filter. 1 mL of the filtered solution was collected and the pH was adjusted to ∼3 using 1 mol L−1 HCl solution, and then analyzed on HPLC. In the recycling test, the spent catalysts were collected by centrifugation, treated with NaBH4 in ethanol at room temperature, and then washed with ethanol for 3 times, followed by drying in the vacuum oven at 80 °C overnight.2.6 HPLC analysis
The FA product was analyzed on a HPLC (Shimadzu LC-20A) system equipped with the PDA and RID detectors. A Shodex SUGAR SH-G column and a Shodex SUGAR SH1011 column were used in series. The mobile phase was 2.5 mmol L−1 H2SO4 aqueous solution at a flow rate of 0.6 mL min−1 with a run time of 35 min. The quantification of FA was undertaken using the external standard curve plotted with authentic samples. The peak intensity at 210 nm on the UV spectrum was employed for the quantification. The FA yield was based on the molar yield calculated with respect to the substrate using the following formula:| FA yield% = nFA/nsubstrate × 100% | (1) |
2.7 Characterizations
All of the samples were sent out for various characterizations. Scanning electron microscopy (SEM) analysis was taken using a NOVA NanoSEM 230 to observe the micro morphologies of N-doped carbon materials. Transmission electron microscopy (TEM) images were taken on a Talos F200X G2 microscope to observe the size and morphology of Pd NPs on the supports. The BET specific surface areas of the samples were obtained with an Autosorb-IQ3 equipment by adsorption–desorption of nitrogen at liquid nitrogen temperature, and the sample degassing was carried out at 150 °C for at least 17 h. The pore-size distribution was calculated based on the Barrett–Joyner–Halenda (BJH) model. X-ray diffraction (XRD) patterns of the samples were recorded with a D8 ADVANCE Da Vinci using CuKα radiation (λ = 1.5406 Å, 40 kV, 40 mA) in the range 2θ = 5–80°. The patterns were analyzed with MDI Jade 6 software. Elemental analysis (EA) of nitrogen, carbon, and hydrogen in carbon materials was performed with a Vario EL Cube elemental analyzer. Fourier transform infrared spectroscopy (FTIR) measurement was achieved on a Nicolet 6700 infrared spectrophotometer, and the samples were pretreated with KBr before measurement. X-ray photoelectron spectra (XPS) were obtained with an AXIS UltraDLD spectrometer. The spectra were referenced to the C 1s binding energy of 284.8 eV and analyzed using Casa-XPS software. The Pd content of the catalysts and the concentration of Pd in the reaction solution were detected by inductively coupled plasma mass spectrometry (ICP-MS) on an iCAP Q spectrometer. The leaching degree of the Pd catalysts were calculated based on the loss of Pd in the reaction solution with respect to the actual Pd content on the catalysts.2.8 Calculation of TON
TON is the turnover number and it was calculated by the following formula:| TON = nFA/(nPd × D) | (2) |
| D = 1.12/d | (3) |
3. Results and discussion
3.1 Hydrogenation of bicarbonate into FA with Pd/chitin-derived N-doped carbon catalysts
The Pd/chitin-derived N-doped carbon catalysts prepared by the three different methods were tested in the hydrogenation of bicarbonates into FA in water at a mild temperature of 60 °C (see Fig. 2). The Pd on carbon supports prepared by the three methods exhibited distinct catalytic performances on the hydrogenation reaction, showing a noticeable support effect. It indicates that the various preparation methods resulted in N-doped carbon materials with different performance. The FA yield was inclined in this order: Pd/C-HC (14.9%) < Pd/C-600 (42.5%) < Pd/C-TC (50.5%). The hydrothermal treatment in the preparation method of the carbon material displayed negative effect on the catalytic performance for FA production. The two-stage calcination is superior to the direct one-stage calcination, possibly because the relatively low temperature (300 °C) and slow heating rate (2 °C min−1) in the preheating stage are beneficial to the stability of C-TC nanostructure and the formation of porous structure.77 Besides, the calcination temperature for the direct calcination method was increased from 500 °C to 700 °C. The hydrogenation results suggest that 600 °C was an optimal calcination temperature, and further increase in the calcination temperature to 700 °C had led to a considerable decrease in the catalytic activity. Since the N-doping of the carbon materials was reckoned to be important to promote the catalytic activity, a contrast experiment using microcrystalline cellulose as the feedstock to prepare non-N-doped carbon material by the two-stage calcination method was conducted (denoted as MC-TC), and the material was also used as the support for Pd NPs. A fairly low FA yield of only 5.7% was obtained with Pd/MC-TC as the catalyst, which was about only one tenth of the result obtained by using Pd/C-TC. This manifests that the N-doping of the carbon supports is remarkably beneficial to improve the catalytic activity of the Pd catalysts.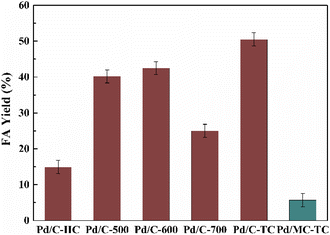 | ||
Fig. 2 Hydrogenation of bicarbonates into FA with different Pd NPs catalysts. Reaction conditions: 5 mmol KHCO3, 5 mL water, 3 MPa H2, 60 °C, 2 h, Pd/C catalyst (6 wt%), n(substrate)/n(Pd) = 400![[thin space (1/6-em)]](https://www.rsc.org/images/entities/char_2009.gif) : :![[thin space (1/6-em)]](https://www.rsc.org/images/entities/char_2009.gif) 1. 1. | ||
3.2 Parameter optimizations of the hydrogenation of bicarbonates into FA
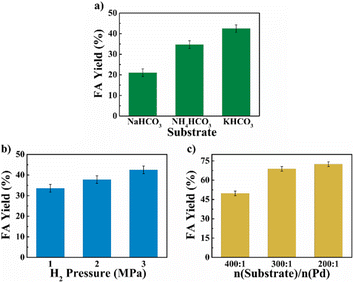
The reaction parameters including the substrate type, H2 pressure, substrate to catalyst ratio (S/R ratio) (see Fig. 3), temperature and time (see Fig. 4) were optimized. Three common bicarbonate salts including NaHCO3, NH4HCO3 and KHCO3 were attempted as the substrates, and KHCO3 as the substrate afforded higher FA yield than the rest two (Fig. 3a). It has been demonstrated that HCO3− was the actual substrate for the hydrogenation of bicarbonates,27 and KHCO3 has higher solubility than NaHCO3 in water.21 Besides, the HCO3− of NH4HCO3 is more likely to convert to CO32− than the other two at 60 °C in water.22 The FA yield steadily increased with the elevated H2 pressure (Fig. 3b), which is in agreement with previous studies that higher H2 pressure favoured the formation of FA.27 The S/R ratio was examined from the range of 400![[thin space (1/6-em)]](https://www.rsc.org/images/entities/char_2009.gif) :
:![[thin space (1/6-em)]](https://www.rsc.org/images/entities/char_2009.gif) 1 to 200
1 to 200![[thin space (1/6-em)]](https://www.rsc.org/images/entities/char_2009.gif) :
:![[thin space (1/6-em)]](https://www.rsc.org/images/entities/char_2009.gif) 1 and a S/R ratio of 200
1 and a S/R ratio of 200![[thin space (1/6-em)]](https://www.rsc.org/images/entities/char_2009.gif) :
:![[thin space (1/6-em)]](https://www.rsc.org/images/entities/char_2009.gif) 1 is desirable to achieve a higher FA yield under employed conditions (Fig. 3c). Apart from these, the reaction temperature and time may have a significant impact on the yield of FA. The hydrogenation reactions were performed at four different temperatures of 40 °C, 60 °C, 80 °C, and 100 °C with the reaction time ranged from 0.5 h to 4 h (see Fig. 4). A general trend was observed from the results that the FA yield grew with the increase in reaction temperature as well as time, and the highest FA yield of 76.8% was achieved at 100 °C for a reaction time of 3 h. The results suggest that the Pd NPs on chitin-derived carbon catalysts could efficiently promote the hydrogenation of bicarbonates under relatively mild conditions.
1 is desirable to achieve a higher FA yield under employed conditions (Fig. 3c). Apart from these, the reaction temperature and time may have a significant impact on the yield of FA. The hydrogenation reactions were performed at four different temperatures of 40 °C, 60 °C, 80 °C, and 100 °C with the reaction time ranged from 0.5 h to 4 h (see Fig. 4). A general trend was observed from the results that the FA yield grew with the increase in reaction temperature as well as time, and the highest FA yield of 76.8% was achieved at 100 °C for a reaction time of 3 h. The results suggest that the Pd NPs on chitin-derived carbon catalysts could efficiently promote the hydrogenation of bicarbonates under relatively mild conditions.
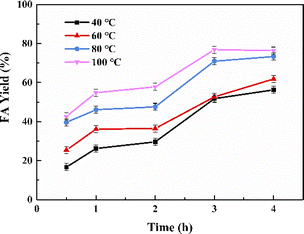 | ||
Fig. 4 The effect of reaction temperature and time on FA yield. Reaction conditions: 5 mmol KHCO3, 5 mL water, 3 MPa H2, Pd/C-TC (6 wt%), n(substrate)/n (Pd) = 400![[thin space (1/6-em)]](https://www.rsc.org/images/entities/char_2009.gif) : :![[thin space (1/6-em)]](https://www.rsc.org/images/entities/char_2009.gif) 1. 1. | ||
The recycling test of the catalyst was conducted under the optimal reaction condition (see Fig. S1†). Three catalytic cycles were performed (due to the considerable mass loss during recycling, enough catalysts were collected from several parallel experiments and used for recycling), and only slight decrease in yield was observed. According to the results of ICP-MS characterization (Table S2†), Pd/C-TC (Pd loading 6 wt% in theory) has a satisfactory actual Pd loading of 5.2 wt%, and the palladium concentration in the reaction solution was only 0.45 μg L−1, which means there was almost no palladium leaching in the reaction solution, and the interaction between Pd NPs and C-TC support is strong. Considering the inevitable mass loss in the process of separation and recovery and the almost negligible leaching degree of palladium (less than 0.0002%), the catalyst has maintained relatively stable activity in the recycling test, which indicates that our catalyst can be reused.
3.3 Characterizations of the chitin-derived N-doped materials
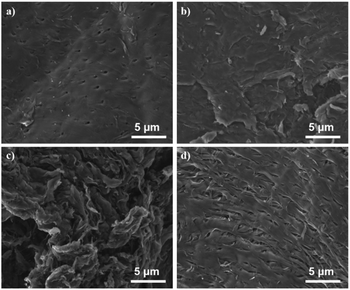
The N-doped carbon materials were characterized by SEM, BET, XRD, FTIR, EA and XPS to analyze their physicochemical properties. The morphological structure of C-HC, C-600, C-700 and C-TC were examined by SEM (see Fig. 5). Note that the sample C-700 was also studied as a comparison since when the calcination temperature increased to 700 °C, the catalytic performance of corresponding Pd catalysts dropped remarkably, presumably indicating some structural changes in the N-doped carbon materials. Unlike the nanofibrous structure of chitin,17 the prepared N-doping carbon materials manifest obvious layered structures (graphitic structure). For C-600 and C-700, layered carbon sheets without pores can be observed in Fig. 5b and c. The surface of C-600 is relatively smooth, while C-700 has rougher surface and is decorated with many folds, which may be the consequence of calcination at a high temperature.For C-HC and C-TC (Fig. 5a and d), both of them feature a highly ordered and regular carbon sheets structure with identifiable pores. Comparing the porous characteristics of C-TC and C-HC, the pores of C-TC are less uniform in shape, more numerous, and more densely distributed than those of C-HC.
The Brunauer–Emmett–Teller (BET) characterization results further illustrate that these N-doped carbon supports display high surface area and mesoporous structure (see Fig. 6). The N2 adsorption–desorption isotherm curves of N-doped carbon materials are shown in Fig. 6a, c, e and g. All isotherms of N-doped carbon materials display the type IV isotherm, indicating that these N-doped carbon materials have mesoporous structure. Moreover, all the isotherms exhibit a type-H3 hysteresis loop, demonstrating that those carbon materials are composed of nanosheets with cracks or pores whose size and shape are uniform, which is in accordance with the SEM images. Compared with the specific surface area of chitin (7.4 m2 g−1),75 the BET specific surface areas of these N-doped carbon materials are much larger after calcination, and were increased to 428.1, 430.6 and 495.5 m2 g−1 for C-HC, C-600 and C-TC, respectively. C-700 possesses a smaller surface area of 346.4 m2 g−1 compared with the other N-doped carbon materials, inferring that a higher calcination temperature may cause the partial collapses of the porous structure. The pore volumes of C-HC and C-TC are the same (0.41 cm3 g−1), and higher than those of C-600 and C-700 with the values of 0.34 and 0.28 cm3 g−1, respectively, which are in good agreement with the SEM images. The pore-size distribution of all N-doped carbon materials ranged from 3 to 7 nm and centered at approximately 3.8 nm (Fig. 6b, d, f and h). Overall, the C-TC sample boasts the largest surface area and pore volume. In our view, the chitin decomposition during the two-stage calcination process might produce more volatile gas, which is favourable to the creation of porous structure, consequently increasing the specific surface area, which may facilitate the gas–liquid mass transfer in the hydrogenation of bicarbonates and provide anchoring sites for Pd NPs.19,27,73,75,81,82
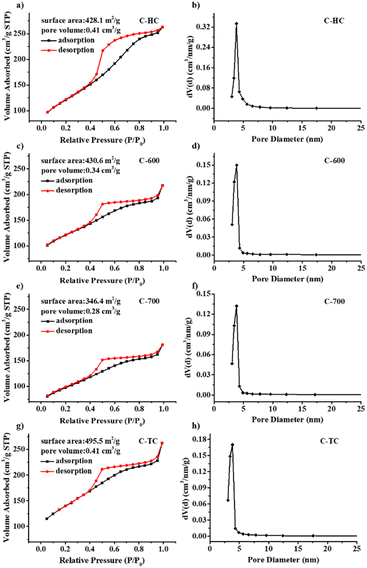 | ||
| Fig. 6 N2 absorption/desorption isotherms, specific surface area, pore volume, and pore size distribution of C-HC (a and b), C-600 (c and d), C-700 (e and f) and C-TC (g and h). | ||
XRD (see Fig. S2†) and FTIR (see Fig. S3†) were also performed on the prepared N-doped mesoporous carbon materials. As shown in Fig. S2,† the characteristic peaks of chitin are absent in the spectra of the N-doped materials, which demonstrated that chitin treated by the three methods was effectively carbonized and lost its crystalline structure.75 All the calcined N-doped carbon supports exhibit similar XRD diffraction peaks. The two broad peaks located at 2θ = 24.4° and 44.8° reveal the disordered and amorphous structure of the carbon material.72,79,81,83 The broad peak at 2θ = 24.4° likely relates to the (002) plane's diffraction, indicating that the materials comprise interlayer structures, which accords with the SEM images (see Fig. 5). The peak at 2θ = 44.8° is attributed to (100) or (101) reflection of graphitic carbon, which indicates the graphitization of carbon supports. The weak peak at 2θ = 10.8° may correspond to the peak of (001) graphitic carbon nitride. From FTIR spectra (see Fig. S3†), the characteristic peaks of chitin located at around 3450, 1650 and 1080 cm−1 could be attributed to the stretching vibration of vOH, vC![[double bond, length as m-dash]](https://www.rsc.org/images/entities/char_e001.gif) O and vC–O, and after chitin was prepared into carbon materials,75,83 the peaks of these oxygen-containing functional groups disappeared, which further shows that the original structure of chitin has lost and carbonization happened efficiently to generate N-doped carbon materials, which is consistent with the results of XRD. For N-doped carbon samples, the peaks at 3410, 1570 and 1120 cm−1 may correspond to the vibration of vN–H, vC
O and vC–O, and after chitin was prepared into carbon materials,75,83 the peaks of these oxygen-containing functional groups disappeared, which further shows that the original structure of chitin has lost and carbonization happened efficiently to generate N-doped carbon materials, which is consistent with the results of XRD. For N-doped carbon samples, the peaks at 3410, 1570 and 1120 cm−1 may correspond to the vibration of vN–H, vC![[double bond, length as m-dash]](https://www.rsc.org/images/entities/char_e001.gif) C or vC
C or vC![[double bond, length as m-dash]](https://www.rsc.org/images/entities/char_e001.gif) N, and vC–N, which display the presence of N functional groups in the prepared N-doped carbon materials. For C-TC, two weak peaks located at about 870 and 800 cm−1 could be observed, which may correspond to the vibration of vC–N and the deformation of δC–N–O, and the peak of vC–N shifted to lower wavenumber due to the influence of strong electron withdrawing groups such as aromatic nitro group,84 indicating that C-TC may contain more N functional groups.
N, and vC–N, which display the presence of N functional groups in the prepared N-doped carbon materials. For C-TC, two weak peaks located at about 870 and 800 cm−1 could be observed, which may correspond to the vibration of vC–N and the deformation of δC–N–O, and the peak of vC–N shifted to lower wavenumber due to the influence of strong electron withdrawing groups such as aromatic nitro group,84 indicating that C-TC may contain more N functional groups.
The nitrogen element in the carbon materials was proved critical to the improvement of the catalytic performance.85–87 The EA technique was adopted to analyze the N-doped samples and the MC-TC was detected as a control sample (Table 1). The nitrogen contents in these samples are in this order: C-TC (7.38%) > C-600 (7.13%) > C-700 (6.39%) > C-HC (6.30%) > MC- TC (0.17%). The trend is in good relationship with the catalytic activity of corresponding Pd catalysts, which shows that higher nitrogen content (corresponded to more N functional groups) could enhance the catalytic performance. Over-high calcination temperature and the hydrothermal treatment may cause the breakdown of N functional groups in chitin and carbon materials, leading to the decreased nitrogen content.75 We believe that the two-stage calcination procedure allows for a relatively gradual degradation of chitin, which inhibits the decomposition of N functional groups and aids in the retention of elemental nitrogen in C-TC. The high nitrogen content and rich N functional groups of C-TC are possibly part of the reasons responsible for the superior catalytic activity of Pd/C-TC.
XPS has been employed to explore the electronic states of the C and N elements in the C-HC, C-600 and C-TC samples (see Fig. 7). Based on the XPS fitting results, relative contents of C and N species on C-HC, C-600 and C-TC surface have been calculated and the detailed values were shown in Table S1.† The C 1s spectra of the three carbon materials are composed of five peaks with the binding energy of 284.8, 285.7, 286.8, 288.4 and 291.0 eV, corresponding to sp2 C, C–N, C–O, C![[double bond, length as m-dash]](https://www.rsc.org/images/entities/char_e001.gif) O and C(O)OH, respectively.72,75,88,89 The peak at 284.8 eV is predominant and C-HC has the highest area of peak relating to sp2 C, indicating that the graphitization degree of C-HC is higher than that of C-600 and C-TC. The peak at 285.7 eV attributed to C–N emphasizes the existence of N in all the samples. The C–N relative content of C-HC is the lowest and the values of C-600 and C-TC are similar. Combined with the nitrogen content of carbon materials from the EA results, the nitrogen content of carbon materials has the same trend in bulk and surface, which reflects that N element is highly dispersed in all prepared carbon materials.
O and C(O)OH, respectively.72,75,88,89 The peak at 284.8 eV is predominant and C-HC has the highest area of peak relating to sp2 C, indicating that the graphitization degree of C-HC is higher than that of C-600 and C-TC. The peak at 285.7 eV attributed to C–N emphasizes the existence of N in all the samples. The C–N relative content of C-HC is the lowest and the values of C-600 and C-TC are similar. Combined with the nitrogen content of carbon materials from the EA results, the nitrogen content of carbon materials has the same trend in bulk and surface, which reflects that N element is highly dispersed in all prepared carbon materials.
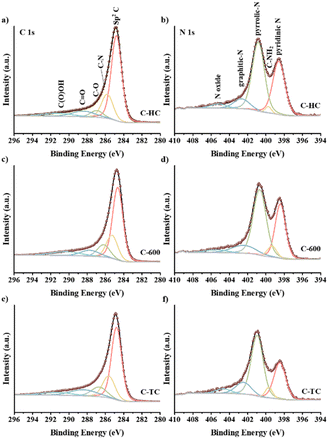 | ||
| Fig. 7 XPS C 1s spectra of C-HC (a), C-600 (c), C-TC (e), and XPS N 1s spectra of C-HC (b), C-600 (d), C-TC (f). | ||
The N 1s spectra exhibit that N species of the three carbon materials are consisted of five components: pyridinic N (398.5 eV), amino group (399.6 eV), pyrrolic N (400.8 eV), graphitic N (402.5 eV) and nitrogen oxides (405 eV), which is consistent with previous research.75,79,84,88,90 The two main peaks are attributed to pyridinic N and pyrrolic N, which are directly coupled to the carbon skeleton as the structural N in the carbon materials. The amino content of C-HC is significantly less than that of C-TC and C-600. According to the general consensus in relevant literature,72,75,84 after calcination, the nitrogen groups could exist in the form of surface functional groups like nitrogen oxides and amides, i.e., NH, NH2 or NH4+ species, while when the calcination temperature is around 600 °C, these surface groups may decompose and some nitrogen would be converted to aromatic nitrogen species and integrated within the framework of carbon materials in the form of pyridine nitrogen, pyrrole nitrogen or graphite nitrogen. The hydrothermal treatment will also lead to the loss of some N elements as amino groups, consequently the fewer amine groups on the surface of C-HC could be detected.
3.4 Characterizations of Pd/chitin-derived N-doped materials
Afterwards, the Pd loaded materials were characterized in order to figure out the interactions between the Pd metal and the support and the correlations with the catalytic activity. Pd/HC, Pd/C-600 and Pd/C-TC were studied. The actual Pd loading on the samples were examined by ICP-MS (Table S2†). Pd/C-600 and Pd/C-TC have comparable Pd loadings (5.1 wt% vs. 5.2 wt%), which are obviously higher than that of Pd/C-HC (3.3 wt%). The loading of Pd on C-HC was not as efficient as the rest two possibly because of a lower nitrogen content and less N functional groups of C-HC (as anchoring sites for Pd precursors). The TEM images and the corresponding Pd NPs size distributions were shown in Fig. 8. The Pd/C-TC possessed the smallest average diameter of the Pd NPs (∼1.45 nm), compared with the Pd/C-HC (∼2.35 nm) and Pd/C-600 (∼2.06 nm). The EDS mapping diagram of Pd/C-TC (see Fig. S4†) can further clearly verify the truth that C, N and Pd elements are highly dispersed on the Pd/C-TC catalyst. This further indicates that the high activity of Pd/C-TC may be the result of the good dispersion and small particle size of Pd NPs attributed to the interactions between nitrogen functional groups and palladium.19,27,28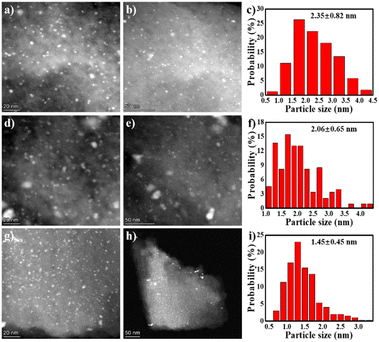 | ||
| Fig. 8 The TEM images and particle size distribution diagrams of catalysts Pd/C-HC (a–c), Pd/C-600 (d–f) and Pd/C-TC (g–i). | ||
XPS analysis of the N and Pd species on the surface has been conducted and the peak fittings were performed (see Fig. 9 and Table S3†). The N 1s spectra could be deconvoluted to five peaks of 398.4 eV, 399.5 eV, 400.9 eV, 402 eV and 405.7 eV that belong to pyridinic N, amino group, pyrrolic N, graphitic N and nitrogen oxides, respectively.21,27,28 The pyridinic N contents of Pd/C-TC (24.9%) and Pd/C-600 (23.0%) catalysts are comparable, and both are much higher than that of Pd/C-HC (16.6%), which is in good agreement with the results of the actual Pd loading in these three catalysts. And the binding energy of pyridinic N increased from 398.2 eV in Pd/C-HC to 398.4 eV in Pd/C-600 and 398.5 eV in Pd/C-TC, which implied the electron transfer from pyridinic N. Combined with previous characterizations and experimental data, the N functionalities particularly in the form of pyridinic N was reckoned to play an important role in boosting the catalytic activity.28,73 The content of graphitic N in Pd/C-HC is significantly higher than that of the other two catalysts (see Table S3†), which is consistent with the characterization results of carbon support that the graphitization degree of C-HC is the highest. High graphitization degree possibly hindered the loading and dispersion of Pd NPs, resulting in poor catalytic activity.75 From the Pd 3d spectra, Pd manifests two chemical states, namely Pd0 and Pd2+, corresponding to the peaks placed at about 335.6 eV and 341 eV. One of the reasons for the occurrence of Pd2+ may be the inevitable partial oxidation of the catalysts when our samples were sent out for XPS characterization. The relative content ratios of Pd2+ and Pd0 are similar in Pd/C-600 and Pd/C-HC, while in Pd/C-TC the relative content of Pd2+ is significantly higher than that of Pd0, and the Pd2+ binding energy of Pd/C-TC (337.2 eV) is also higher than that of Pd/C-600 and Pd/C-HC (337 eV) (see Fig. 9). Considering that the actual Pd loading and the nitrogen content in the support of Pd/C-TC are all the highest among the three catalysts, it may be due to the possibility that the Pd2+ precursor is of high affinity to heteroatoms like nitrogen or oxygen doped in the carbon support to form covalent bonds, just as demonstrated in previous research,19,28 which means Pd2+ may interact strongly with the nitrogen sites on the support, thus improving the distribution of palladium on the support but also affecting the reducibility of the catalyst reduction method applied to a certain extent. It is worth noting that the binding energy of Pd0 in Pd/C-TC and Pd/C-600 (335.6 eV) is lower than that in Pd/C-HC (335.7 eV), and all of them are lower than that of normal metallic Pd (335.9 eV) in Pd/AC.27 It is reasonable to ascribe the change in the binding energy to the interaction between the Pd0 and pyridinic N specie on the N-doped carbon support, as when the Pd loading increased, the Pd0 binding energy decreased while the pyridinic N binding energy increased, indicating that the electrons transferred from pyridinic N to Pd.27,28 It has been demonstrated that the pyridinic N has a high electron density which probably serve as anchoring sites and contribute to the electron transfer between nitrogen with Pd NPs on the support,73 which could lead to well-dispersed and small-sized Pd NPs with enriched electron density, enhancing the catalytic activity.27,28,82 Based on our findings and earlier work,17,27,28 the reaction mechanism of the HCO3− hydrogenation catalysed by Pd/chitin-derived N-doped carbon is shown in Fig. 10. The nitrogen species on the surface of catalyst support could adsorb HCO3−, then the active H produced by the cleavage of H2 over Pd NPs is inserted into the C–OH bond and replaces the –OH, finally the HCO2− and H2O are formed and released.
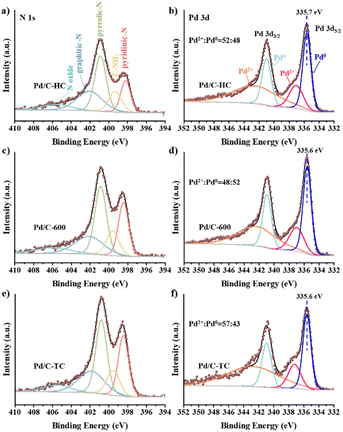 | ||
| Fig. 9 XPS N 1s spectra of Pd/C-HC (a), Pd/C-600 (c), Pd/C-TC (e), and XPS Pd 3d spectra of Pd/C-HC (b), Pd/C-600 (d), Pd/C-TC (f). | ||
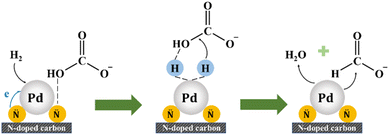 | ||
| Fig. 10 Scheme of plausible reaction mechanism of the hydrogenation of bicarbonate catalysed by Pd/chitin-derived N-doped carbon. | ||
3.5 Waste shrimp shell as the feedstock to prepare the N-doped carbon support
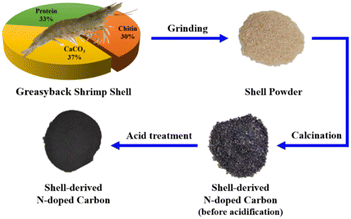
The preparation of the N-doped carbon materials directly from waste shrimp shell powders has also been conducted (see Fig. 11). The composition of the waste shrimp shell powders was analyzed (chitin ∼30%, proteins ∼33%, CaCO3 ∼37%), and both direct and two-stage calcination methods were employed to transform the waste shell into N-doped carbon materials. The Pd loaded on the two carbon materials were examined for the bicarbonate hydrogenation into FA (see Table 2). In consistence with previous results using chitin-derived carbon materials as the catalyst supports, the Pd/S-TC catalyst exhibited much better catalytic performance than the Pd/S-750 catalyst. The highest FA yield of 48.2% was achieved by using Pd/S-TC under employed conditions (see entry 4, Table 2). From SEM image (see Fig. S5c†), the waste shell-derived carbon material S-TC has showed obvious porous structure and the BET surface area was 411 m2 g−1. In addition, there were some circular structures with diameter larger than 1 μm in S-TC, which was probably formed due to the acetic acid acidification treatment during the preparation process to remove the residual CaCO3, which may cause the exposure or even collapse of the porous structure of S-TC, thus affecting the specific surface area of S-TC. The EA results (see entry 6, Table 1) reveal that the S-TC has a higher nitrogen content and lower carbon content compared with chitin-derived carbon materials. This may be attributed to the presence of proteins in the shrimp shell which has a higher nitrogen content while is easy to decompose and lose carbon.| Entry | Support | t (h) | T (°C) | n(sub)/n(Pd) | FA yield (%) |
|---|---|---|---|---|---|
| a Reaction conditions: 5 mmol KHCO3, 5 mL water, 3 MPa H2, Pd/C catalysts (6 wt%). | |||||
| 1 | S-750 | 3 | 60 | 300 | 11.9 |
| 2 | S-TC | 3 | 60 | 300 | 47.2 |
| 3 | S-TC | 3 | 80 | 400 | 19.1 |
| 4 | S-TC | 3 | 100 | 400 | 48.2 |
| 5 | S-TC | 4 | 80 | 400 | 21.3 |
| 6 | S-TC | 4 | 100 | 400 | 43.9 |
The XRD and FTIR patterns of S-TC are relatively similar with those of C-TC (see Fig. S5a and b†). Overall, the waste shell-derived N-doped carbon materials can be used as the Pd supports for FA production with satisfactory yields under mild conditions.
4. Conclusions
In this work, we have prepared N-doped carbon materials from chitin and waste shrimp shell powders as Pd support to catalyze the hydrogenation of bicarbonates into FA. Among the three preparation methods of hydrothermal calcination, direct calcination and two-stage calcination, the two-stage method could result in the most suitable N-doped carbon materials as the Pd support. The Pd/C-TC and Pd/S-TC could efficiently transform KHCO3 into FA in water at 100 °C with good yields of ∼77% and ∼48%, respectively. A variety of characterizations have been conducted on the as-synthesized carbon materials and the Pd loaded materials. The two-stage calcination can help generate large surface area and pore volume, and enriched nitrogen functional groups on the surface of carbon materials, which leads to the synthesis of Pd NPs with smaller size and better dispersion, and thus afforded the most outstanding catalytic activity. Compared with previous research, we prepared N-doped carbon support of satisfactory performance from naturally nitrogen-containing oceanic waste with no extra artificial nitrogen source or template added and no corrosive hazardous chemicals used through simple calcination method, and achieved competitive FA yield under relatively mild conditions, which is of much lower cost, safer, and more environmentally friendly. The work demonstrates the simultaneous upgrading of abundant waste chitin biomass and CO2 into value-added FA product, which contributes to the substitution of non-renewable fossil feedstock and the sustainable development of the chemical industry.Conflicts of interest
There are no conflicts to declare.Acknowledgements
This work was financially supported by the Young Scientists Fund of the National Natural Science Foundation of China (No. 21908145) and the Shanghai Sailing Program (19YF1422100).Notes and references
- J. Cheng and K. Cen, Carbon Neutrality, 2022, 1, 11 CrossRef.
- F. Joó, L. Nádasdi, J. Elek and G. Laurenczy, Chem. Commun., 1999, 11, 971–972 RSC.
- X. Chen, Y. Liu and J. Wang, Ind. Eng. Chem. Res., 2020, 59, 17008–17025 CrossRef CAS.
- C. Mondelli, G. Gzaydn, N. Yan and J. Prez-Ramrez, Chem. Soc. Rev., 2020, 49, 3764–3782 RSC.
- X. Chen, Y. Liu and J. Wu, Mol. Catal., 2020, 483, 110716 CrossRef CAS.
- L. Zhang, T.-H. Tsui, J. Fu, Y. Dai and Y. W. Tong, Carbon Neutrality, 2022, 1, 8 CrossRef.
- Y. Yang, H. Zhong, R. He, X. Wang, J. Cheng, G. Yao and F. Jin, Green Chem., 2019, 21, 1247–1252 RSC.
- Y. Pei, Z. Pi, H. Zhong, J. Cheng and F. Jin, J. Mater. Chem. A, 2022, 10, 1309–1319 RSC.
- L. Lu, H. Zhong, T. Wang, J. Wu, F. Jin and T. Yoshioka, Green Chem., 2020, 22, 352–358 RSC.
- X. Wang, Y. Yang, T. Wang, H. Zhong, J. Cheng and F. Jin, ACS Sustainable Chem. Eng., 2021, 9, 1203–1212 CrossRef CAS.
- J. Deng, L. Wang, F. Jin and Y. Hu, J. Mater. Chem. A, 2021, 9, 10081–10087 RSC.
- D. Xu, Y. Wang, M. Ding, X. Hong, G. Liu and S. C. E. Tsang, Chem, 2021, 7, 849–881 CAS.
- X. Chen and F. Jin, Front. Energy, 2019, 13, 207–220 CrossRef.
- X. Liu, H. Zhong, C. Wang, D. He and F. Jin, Energy Sci. Eng., 2022, 10, 1601–1613 CrossRef CAS.
- Y. Le, H. Zhong, Y. Yang, R. He, G. Yao and F. Jin, J. Energy Chem., 2017, 26, 936–941 CrossRef.
- C. Wang, X. Chen, M. Qi, J. Wu, G. Gözaydın, N. Yan, H. Zhong and F. Jin, Green Chem., 2019, 21, 6089–6096 RSC.
- H. Song, N. Zhang, C. Zhong, Z. Liu, M. Xiao and H. Gai, New J. Chem., 2017, 41, 9170–9177 RSC.
- G. A. Filonenko, R. van Putten, E. N. Schulpen, E. J. M. Hensen and E. A. Pidko, ChemCatChem, 2014, 6, 1526–1530 CrossRef CAS.
- J. H. Lee, J. Ryu, J. Y. Kim, S. W. Nam, J. H. Han, T. H. Lim, S. Gautam, K. H. Chae and C. W. Yoon, J. Mater. Chem. A, 2014, 2, 9490–9495 RSC.
- J. Wang, C. Zhou, Z. Gao, X. Feng, Y. Yamamoto and M. Bao, ChemCatChem, 2021, 13, 2702–2708 CrossRef CAS.
- Q. Y. Bi, J. D. Lin, Y. M. Liu, X. L. Du, J. Q. Wang, H. Y. He and Y. Cao, Angew. Chem., Int. Ed., 2014, 53, 13583–13587 CrossRef CAS PubMed.
- J. Su, L. Yang, M. Lu and H. Lin, ChemSusChem, 2015, 8, 813–816 CrossRef CAS PubMed.
- C. J. Stalder, S. Chao, D. P. Summers and M. S. Wrighton, J. Am. Chem. Soc., 1983, 105, 6318–6320 CrossRef CAS.
- B. Zaidman, H. Wiener and Y. Sasson, Int. J. Hydrogen Energy, 1986, 11, 341–347 CrossRef CAS.
- H. Wiener, B. Zaidman and Y. Sasson, Sol. Energy, 1989, 43, 291–296 CrossRef CAS.
- X. Lu, D. Y. C. Leung, H. Wang, M. K. H. Leung and J. Xuan, ChemElectroChem, 2014, 1, 836–849 CrossRef CAS.
- X. Shao, J. Xu, Y. Huang, X. Su, H. Duan, X. Wang and T. Zhang, AIChE J., 2016, 62, 2410–2418 CrossRef CAS.
- F. Wang, J. Xu, X. Shao, X. Su, Y. Huang and T. Zhang, ChemSusChem, 2016, 9, 246–251 CrossRef CAS PubMed.
- Q. Sun, B. W. J. Chen, N. Wang, Q. He, A. Chang, C. M. Yang, H. Asakura, T. Tanaka, M. J. Hülsey, C. H. Wang, J. Yu and N. Yan, Angew. Chem., 2020, 132, 20358–20366 CrossRef.
- D. Preti, C. Resta, S. Squarcialupi and G. Fachinetti, Angew. Chem., Int. Ed., 2011, 50, 12551–12554 CrossRef CAS.
- Q. Liu, X. Yang, L. Li, S. Miao, Y. Li, Y. Li, X. Wang, Y. Huang and T. Zhang, Nat. Commun., 2017, 8, 1407 CrossRef.
- G. A. Filonenko, W. L. Vrijburg, E. J. M. Hensen and E. A. Pidko, J. Catal., 2016, 343, 97–105 CrossRef CAS.
- C. Hao, S. Wang, M. Li, L. Kang and X. Ma, Catal. Today, 2011, 160, 184–190 CrossRef CAS.
- P. R. Upadhyay and V. Srivastava, RSC Adv., 2016, 6, 42297–42306 RSC.
- Z. Zhang, L. Zhang, S. Yao, X. Song, W. Huang, M. J. Hülsey and N. Yan, J. Catal., 2019, 376, 57–67 CrossRef CAS.
- Q. Sun, X. Fu, R. Si, C. H. Wang and N. Yan, ChemCatChem, 2019, 11, 5093–5097 CrossRef CAS.
- Y. Wu, Y. Zhao, H. Wang, B. Yu, X. Yu, H. Zhang and Z. Liu, Ind. Eng. Chem. Res., 2019, 58, 6333–6339 CrossRef CAS.
- C. Mondelli, B. Puértolas, M. Ackermann, Z. Chen and J. Pérez-Ramírez, ChemSusChem, 2018, 11, 2859–2869 CrossRef CAS.
- L. Liu, Q. Deng, T. Ma, X. Lin, X. Hou, Y. Liu and Z. Yuan, J. Mater. Chem., 2011, 21, 16001–16009 RSC.
- H. Park, J. H. Lee, E. H. Kim, K. Y. Kim, Y. H. Choi, D. H. Youn and J. S. Lee, Chem. Commun., 2016, 52, 14302–14305 RSC.
- M. Hu, J. Reboul, S. Furukawa, L. Radhakrishnan, Y. Zhang, P. Srinivasu, H. Iwai, H. Wang, Y. Nemoto, N. Suzuki, S. Kitagawa and Y. Yamauchi, Chem. Commun., 2011, 47, 8124–8126 RSC.
- Y. Xia, Z. Yang and R. Mokaya, J. Phys. Chem. B, 2004, 108, 19293–19298 CrossRef CAS.
- Y. Xia and R. Mokaya, Adv. Mater., 2004, 16, 1553–1558 CrossRef CAS.
- T. Horikawa, N. Sakao, T. Sekida, J. i. Hayashi, D. D. Do and M. Katoh, Carbon, 2012, 50, 1833–1842 CrossRef CAS.
- L. Wang and R. T. Yang, J. Phys. Chem. C, 2009, 113, 21883–21888 CrossRef CAS.
- Z. Yang, Y. Xia, X. Sun and R. Mokaya, J. Phys. Chem. B, 2006, 110, 18424–18431 CrossRef CAS PubMed.
- Y. Shao, X. Wang, M. Engelhard, C. Wang, S. Dai, J. Liu, Z. Yang and Y. Lin, J. Power Sources, 2010, 195, 4375–4379 CrossRef CAS.
- H. Jin, H. Zhang, H. Zhong and J. Zhang, Energy Environ. Sci., 2011, 4, 3389–3394 RSC.
- L. Liu, Q. Deng, T. Ma, X. Lin, X. Hou, Y. Liu and Z. Yuan, J. Mater. Chem., 2011, 21, 16001–16009 RSC.
- A. Vinu, S. Anandan, C. Anand, P. Srinivasu, K. Ariga and T. Mori, Microporous Mesoporous Mater., 2008, 109, 398–404 CrossRef CAS.
- Y. Xia and R. Mokaya, Chem. Mater., 2005, 17, 1553–1560 CrossRef CAS.
- P.-X. Hou, H. Orikasa, T. Yamazaki, K. Matsuoka, A. Tomita, N. Setoyama, Y. Fukushima and T. Kyotani, Chem. Mater., 2005, 17, 5187–5193 CrossRef CAS.
- J. Zhou, W. Li, Z. Zhang, W. Xing and S. Zhuo, RSC Adv., 2012, 2, 161–167 RSC.
- N. D. Kim, W. Kim, J. B. Joo, S. Oh, P. Kim, Y. Kim and J. Yi, J. Power Sources, 2008, 180, 671–675 CrossRef CAS.
- N. Yan and X. Chen, Nature, 2015, 524, 155–157 CrossRef CAS PubMed.
- X. Chen, H. Yang and N. Yan, Chem.–Eur. J., 2016, 22, 13402–13421 CrossRef CAS PubMed.
- X. Chen, H. Yang, Z. Zhong and N. Yan, Green Chem., 2017, 19, 2783–2792 RSC.
- X. Gao, X. Chen, J. Zhang, W. Guo, F. Jin and N. Yan, ACS Sustainable Chem. Eng., 2016, 4, 3912–3920 CrossRef CAS.
- X. Chen, Y. Liu, F. M. Kerton and N. Yan, RSC Adv., 2015, 5, 20073–20080 RSC.
- F. M. Kerton, Y. Liu, K. W. Omari and K. Hawboldt, Green Chem., 2013, 15, 860–871 RSC.
- J. Wu, M. Qi, G. k. Gözaydın, N. Yan, Y. Gao and X. Chen, Ind. Eng. Chem. Res., 2021, 60, 3239–3248 CrossRef CAS.
- M. Qi, X. Chen, H. Zhong, J. Wu and F. Jin, ACS Sustainable Chem. Eng., 2020, 8, 18661–18670 CrossRef CAS.
- N. V. Veríssimo, C. U. Mussagy, A. A. Oshiro, C. M. N. Mendonça, V. d. C. Santos-Ebinuma, A. Pessoa, R. P. d. S. Oliveira and J. F. B. Pereira, Green Chem., 2021, 23, 9377–9400 RSC.
- M. S. Islam, S. Khan and M. Tanaka, Mar. Pollut. Bull., 2004, 49, 103–110 CrossRef CAS PubMed.
- X. Chen, S. L. Chew, F. M. Kerton and N. Yan, Green Chem., 2014, 16, 2204–2212 RSC.
- Y. Wang, C. M. Pedersen, T. Deng, Y. Qiao and X. Hou, Bioresour. Technol., 2013, 143, 384–390 CrossRef CAS PubMed.
- Y. Pierson, X. Chen, F. D. Bobbink, J. Zhang and N. Yan, ACS Sustainable Chem. Eng., 2014, 2, 2081–2089 CrossRef CAS.
- A. D. Sadiq, X. Chen, N. Yan and J. Sperry, ChemSusChem, 2018, 11, 532–535 CrossRef CAS PubMed.
- T. T. Pham, X. Chen, T. Söhnel, N. Yan and J. Sperry, Green Chem., 2020, 22, 1978–1984 RSC.
- L. Zhao, N. Baccile, S. Gross, Y. Zhang, W. Wei, Y. Sun, M. Antonietti and M.-M. Titirici, Carbon, 2010, 48, 3778–3787 CrossRef CAS.
- H. Yuan, L. Deng, X. Cai, S. Zhou, Y. Chen and Y. Yuan, RSC Adv., 2015, 5, 56121–56129 RSC.
- A. Primo, A. Forneli, A. Corma and H. García, ChemSusChem, 2012, 5, 2207–2214 CrossRef CAS PubMed.
- Q. Bi, J. Lin, Y. Liu, H. He, F. Huang and Y. Cao, Angew. Chem., Int. Ed., 2016, 55, 11849–11853 CrossRef CAS.
- B. Zhang, C. Wang, D. Liu, Y. Liu, X. Yu and L. Wang, ACS Sustainable Chem. Eng., 2018, 6, 13807–13812 CrossRef CAS.
- Y. Gao, X. Chen, J. Zhang and N. Yan, ChemPlusChem, 2015, 80, 1556–1564 CrossRef CAS.
- G. Magnacca, F. Guerretta, A. Vizintin, P. Benzi, M. C. Valsania and R. Nisticò, Appl. Surf. Sci., 2018, 427, 883–893 CrossRef CAS.
- R. Hao, Y. Yang, H. Wang, B. Jia, G. Ma, D. Yu, L. Guo and S. Yang, Nano Energy, 2018, 45, 220–228 CrossRef CAS.
- Y. Zhai, M. Chu, N. Shang, C. Wang, H. Wang and Y. Gao, Appl. Surf. Sci., 2020, 506, 144681 CrossRef CAS.
- R. J. White, M. Antonietti and M.-M. Titirici, J. Mater. Chem., 2009, 19, 8645–8650 RSC.
- K. Preuss, V. K. Kannuchamy, A. Marinovic, M. Isaacs, K. Wilson, I. Abrahams and M. M. Titirici, J. Energy Chem., 2016, 25, 228–235 CrossRef.
- L. Wang, Y. Zheng, X. Wang, S. Chen, F. Xu, L. Zuo, J. Wu, L. Sun, Z. Li, H. Hou and Y. Song, ACS Appl. Mater. Interfaces, 2014, 6, 7117–7125 CrossRef CAS.
- F. Su, Z. Tian, C. K. Poh, Z. Wang, S. H. Lim, Z. Liu and J. Lin, Chem. Mater., 2010, 22, 832–839 CrossRef CAS.
- J. Liu, S. Li, B. Wang, J. Chen and X. Wu, J. Mater. Chem. A, 2016, 4, 11789–11799 RSC.
- A. Arenillas, T. C. Drage, K. Smith and C. E. Snape, J. Anal. Appl. Pyrolysis, 2005, 74, 298–306 CrossRef CAS.
- Y. Zhou, K. Neyerlin, T. S. Olson, S. Pylypenko, J. Bult, H. N. Dinh, T. Gennett, Z. Shao and R. O'Hayre, Energy Environ. Sci., 2010, 3, 1437–1446 RSC.
- X. Wang, K. Maeda, A. Thomas, K. Takanabe, G. Xin, J. M. Carlsson, K. Domen and M. Antonietti, Nat. Mater., 2009, 8, 76–80 CrossRef CAS PubMed.
- A. Thomas, A. Fischer, F. Goettmann, M. Antonietti, J. O. Müller, R. Schlögl and J. M. Carlsson, J. Mater. Chem., 2008, 18, 4893–4908 RSC.
- S. Biniak, G. Szymański, J. Siedlewski and A. Świątkowski, Carbon, 1997, 35, 1799–1810 CrossRef CAS.
- A. Primo, E. Sánchez, J. M. Delgado and H. García, Carbon, 2014, 68, 777–783 CrossRef CAS.
- P. Hao, Z. Zhao, Y. Leng, J. Tian, Y. Sang, R. I. Boughton, C. P. Wong, H. Liu and B. Yang, Nano Energy, 2015, 15, 9–23 CrossRef CAS.
Footnotes |
| † Electronic supplementary information (ESI) available. See DOI: https://doi.org/10.1039/d2ra06462f |
| ‡ These authors contributed equally. |
| This journal is © The Royal Society of Chemistry 2022 |

