 Open Access Article
Balanced change in crystal unit cell volume and strain leads to stable halide perovskite with high guanidinium content†
Patricio Serafini a,
Andrés F. Gualdrón-Reyes
 ab,
Rafael S. Sánchez
 a,
Eva M. Bareaa,
Sofia Masi
 *a and
Iván Mora-Seró
 *a
*a
aInstitute of Advanced Materials (INAM), Universitat Jaume I, 12071 Castelló de la Plana, Spain. E-mail: masi@uji.es; sero@uji.es
bFacultad de Ciencias, Instituto de Ciencias Químicas, Universidad Austral de Chile, Isla Teja, 5090000 Valdivia, Chile
First published on 14th November 2022
Abstract
Up-to-date studies propose that strain in halide perovskites is one of the key factors that determine a device's efficiency and stability. Here, we show a systematic approach to characterize the phenomenon in the standard methylammonium lead iodine (MAPbI3) perovskite system by: (i) the substitution of some MA by guanidinium (Gu); (ii) the incorporation of PbS quantum dot (QD) additives and (iii) addition of both Gu and PbS at the same time. We studied the effect of these incorporations on the film strain and crystal cell unit volume, and on the solar cell device efficiency and stability. Gu cations and PbS QDs affect the strain, the former due to the relatively large dimensions of Gu, and the latter due to the lattice matching parameters. With the control of Gu and PbS QD content, higher performance and longer solar cell stability are obtained. We demonstrated that the presence of Gu and PbS QDs alters the structure of perovskite, in terms of modification of the unit cell volume and strain. The greater size of Gu cations produces a MAPbI3 unit cell volume expansion as Gu is incorporated, modifying the strain from compressive to tensile. PbS QDs aid Gu incorporation, producing a unit cell volume expansion. In the case of 15% mol Gu incorporation, the addition of PbS QDs modifies strain from compressive to tensile, limiting the deleterious effect. At the same time the unit cell volume is less affected, increasing the solar cell stability. Our work shows that the control of compressive strain and the unit cell volume expansion lead to a 50% increase in T80, the time in which the PCE decreases to 80% of its original value, increasing the T80 value from 120 to 187 days under air conditions. Moreover it highlights the importance of exploiting not only the control of the strain induced by internal component, the cation, but also the strain induced by the external component, the QD, associated instead with critical volume variation of metastable perovskite unit cell volume.
Introduction
Perovskite based photovoltaics is a recent area of research with continuous progress and achievements. Since 2009 when the first solar cell appeared, the power conversion efficiency (PCE) has increased from ∼3.8% to ∼25.7%,1 making these devices attractive in competing against silicon solar cells on the market. The most common perovskite used is methylammonium lead iodide (MAPbI3) due to its properties, i.e. bandgap close to the optimal value for a single-junction architecture2,3 and high charge carrier mobility,4,5 which made it possible to achieve high efficiencies6 with a theoretical value of ∼30.5%.7 Despite their theoretical potential, perovskite materials are far from perfection and structural improvements are needed to further enhance the device's performance. Furthermore, the perovskite decomposition is boosted under ambient conditions,8,9 especially under illumination.10–12 Current topics of interest are the use of large cation like formamidinium (FA)13,14 or the use of 2D perovskites.15 The latter are very promising from the thermal stability point of view, but not appropriate as active layer for photovoltaic application, either for the crystal phase instability or for insulating properties, respectively. However, excellent performance have been achieved if extra spin-coated thin layer of bigger organic cation is added in the device architecture16 or if external additives (PbS QDs) are exploited. In case of PbS QDs incorporation, it indirectly tune the tolerance factor (t) and thereby it can stabilize the perovskite black phase of FAPbI3 (refs. 13, 17 and 18) or improve performance as in MAPbI3 based solar cells.19–21 Guanidinium (Gu) based salt is also used with the same purpose as spin-coated passivation layer, as a trade-off between the stability and the conductive properties of the perovskite.22 By spin-coating GuI on top of the perovskite active layer, PCEs of 18.54% have been obtained with an improved stability of 30 days in dry and dark conditions,22 still a low value for practical applications.On the other hand, since pure Gu perovskite is a 2D perovskite with yellow phase, mixed-cation perovskite, with a low amount of Gu, have been exploited.23 It has been demonstrated that, the compositional engineering strategy leads only a slight distortion of 3D structure, which increases the efficiency.24,25 Moreover, it has been reported that with 20 mol% of Gu in the mixed perovskite, Gu interacts with remaining PbI2 forming, in consequence, domains of 2D perovskite that could result in an enhancement of stability.26 On the contrary, at lower amounts than 20 mol% of Gu, the 2D phase is not formed, and a slight but significant red-shift in photoluminescence measurements is detected, thus indicating the absence of low-dimensional features in the film.27 In these conditions, a lattice mismatch, disorder and a more stressed crystal is formed.28,29 Thus, the questions remains whether the control of the compressive strain, conventionally with negative values, could be related to higher formation energy associated to a decrease of non-radiative recombination, and therefore increases the efficiency30 in the perovskite with Gu.
A compressive strain along with material and device stabilization is in fact observed in perovskite with t > 1.31 However, other mechanisms like the surface energy and the chemical bonds are behind the stabilization of the perovskite.13 Thus, the role of the strain is only one of the mechanisms recognized when the stability of a metastable perovskite material is achieved and the correlation with the optical and electrical properties of the perovskite materials is still unclear and controversial. It is worth highlighting that despite a lot of efforts have been dedicated to the FA and cesium perovskites, Gu-based derivatives have received significantly less attention. The interest in studying the correlation between strain and Gu content lies in the improved stability and Voc values compared to bare MA perovskites,32 without using extra layers and 2D perovskite. As commented above, 5–15 mol% of Gu modifies the optoelectronic properties, with a beneficial effect on the photovoltaic conversion, however the crystal mismatch conditions reduce its stability.28 For instance, it is reported that MAPbI3 solar cells using TiO2 compact layer/TiO2 mesoporous as electron transporting layer (ETL) have a PCE of 17%. However, when 14% mol of Gu is used in perovskite a PCE of 19.15% and an improvement in measurements of device stability for ∼250 h in encapsulated devices under argon is reported.32 The key factor is the optimization of the Gu concentration to achieve higher efficiencies due to longer electron lifetime and increased recombination resistance.
Thus, in this work, Gu was employed at low concentrations 2, 5, 7, 10 and 15 mol% to retain 3D structure of the MAPI, with some benefits like the inter-correlation structure distortion-carrier transport,27,32 in order to identify a strategy to improve the stability and to study the correlation between performance, optoelectronic properties and strain.
Firstly, we obtained the best results by using only 7 mol% of Gu, with the highest PL intensity, which results in PCE of 18.3%, in line with the literature32 when direct architecture with SnO2 as ETL is used. It is worth to note that the stability tests were carried out under ambient atmosphere (20 °C at 40% RH) and the samples stored in dark conditions and without encapsulation for ∼1 year. The best efficiency and stability were achieved for samples with 7 mol% of Gu PCE = 18.3% and T80 = 165 days, where T80 is defined as the time in which the photoconversion efficiency reduces to 80% of its original value. Secondly, by adding PbS QDs to MA-Gu perovskite a quantity of 15 mol% of Gu results in lower performance PCEmean = 14.55% but better stability, T80 = 187 days, correlated with structural changes observed.
The strain modification, due to the different variables, indicates that microstrain values close to 0 led to higher efficiency and stability when QDs are not employed. However, the combination of mixed cation perovskite and PbS QDs produce in one side charge transport modification that led to lower PCE. Though, balanced change in strain and volume led to highest stability in the case of Gu 15 mol%, with tenure of PCE up to 67% after 1 year due to transition from positive to a negative and close to zero strain value and controlled volume expansion.
Results and discussion
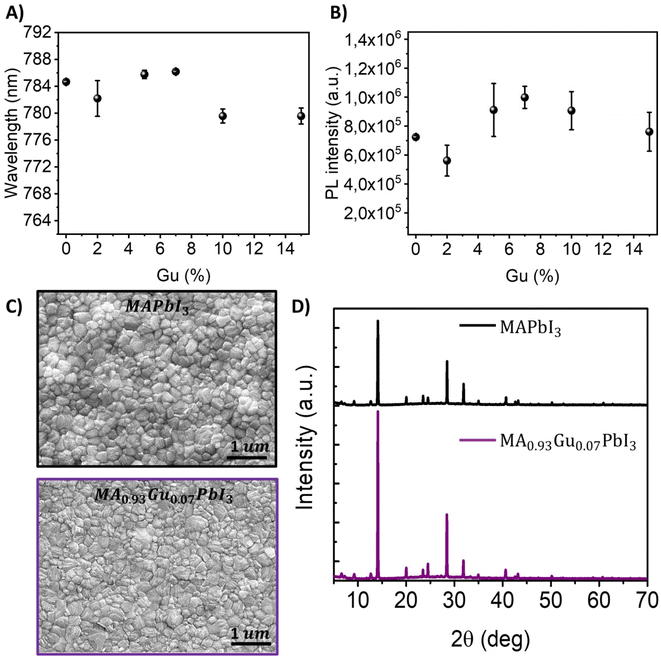
MA perovskite films are prepared by adding to the precursor solution, different amount of GuI (see Experimental section at ESI†) to obtain a mixed cation composition MA1−xGuxPbI3. Hereafter we will refer to the different amount of Gu added to the perovskite as Gux% where x takes values of 0; 2; 5; 7; 10 and 15. The absorption, the Tauc plot and the second derivative to determine the bandgap of ∼1.60 eV are shown in Fig. S1A.† Aslightred-shift in the optical features is observed by increasing the Gu content up to Gu7% while by exceeding this threshold it is detected a blue-shift, see Fig. 1A. In addition, PL intensity is enhanced for Gu7% while by exceeding this threshold the intensity decreases, see Fig. 1B. However, the trend for the PL full width half maximum (FWHM) indicates homogeneity through different quantities of Gu, see Table S1.†27Morphological analysis by SEM measurements, see Fig. S1B,† confirms a smooth and homogeneous grain distribution especially evidenced for the system with Gu7%, see Fig. 1C, in line with the increased PL intensity. This is also in agreement with the grain size statistic of the SEM images, where a bigger mean size is obtained for Gu7%, see Fig. S2.† In addition, the X-ray diffraction patterns (XRD) for x = 0, 2, 5, 7, 10, 15, 20, 40, 60, 80, 100 Gu mol% were performed and shown in Fig. S3.† For the cases of x < 20 mol% the crystal structure is tetragonal 3D, defined by the peaks at 14° (110), 20° (112) and its double values, as shown in Fig. S3.† However for x ≥ 20 mol%, 2D peaks begin to be relevant as it is shown by the presence of a peak below 10°,33–35 which indicates higher distances between planes and it is related to the effect of the big cation that produces a cut of structure separating it in two slabs. According to peak intensity ratio (110)/(220) the sample Gu7% has a higher crystalline order than the reference without Gu, see Fig. 1D. This basic characterization would indicate a better film quality with Gu7%, with less morphological defects accompanied with better crystallinity, more appropriate for high photovoltaic performances.
The architecture used for solar cells fabrication is ITO/SnO2/perovskite/spiro-OMeTAD/Au and the results obtained are summarized in Table S2.† Unlike previous reports, instead of organic n-type material or TiO2 ETL, a compact layer of SnO2![[thin space (1/6-em)]](https://www.rsc.org/images/entities/char_2009.gif) 36 was chosen due to its characteristics of band gap, higher mobility and also due to the easy sintering that requires temperatures <200 °C.37–39 Using the mentioned structure, MAPbI3 reference devices resulted in average PCE values of 15.6 ± 0.3%, with champion value of 16.1%. On the other side, photovoltaic devices have been fabricated with different Gu content producing 3D layers i.e. x = 2, 5, 7, 10 and 15 Gu mol%, see Table S2† for summary of average photovoltaic parameters and Fig. S4A† for J–V curves of champion cells. The highest performance was obtained for Gu7% that has average PCE of 17.4 ± 0.4% with champion value of 18.3%, see Fig. S4B.† The use of SnO2 as ETL at this Gu concentration, leads to successfully reach an efficiency close to the state of art,32 thus indicating that the ITO/SnO2 does not dramatically affect the structural and optical properties of the materials. Photovoltaic parameters of solar cells increased by Gu addition up to 7%. Although, in several reports it has been observed that Voc improves when Gu is used as post treatment over perovskite,22,40,41 in our case Voc present no significant variation with the addition of Gu, see Table S2.† The Jsc calculated from incident photon to current efficiency (IPCE) for reference and Gu7% gives 20.90 mA cm−2 and 21.6 mA cm−2, respectively, which is in good agreement with the Jsc measured, see Fig. S4C.†
36 was chosen due to its characteristics of band gap, higher mobility and also due to the easy sintering that requires temperatures <200 °C.37–39 Using the mentioned structure, MAPbI3 reference devices resulted in average PCE values of 15.6 ± 0.3%, with champion value of 16.1%. On the other side, photovoltaic devices have been fabricated with different Gu content producing 3D layers i.e. x = 2, 5, 7, 10 and 15 Gu mol%, see Table S2† for summary of average photovoltaic parameters and Fig. S4A† for J–V curves of champion cells. The highest performance was obtained for Gu7% that has average PCE of 17.4 ± 0.4% with champion value of 18.3%, see Fig. S4B.† The use of SnO2 as ETL at this Gu concentration, leads to successfully reach an efficiency close to the state of art,32 thus indicating that the ITO/SnO2 does not dramatically affect the structural and optical properties of the materials. Photovoltaic parameters of solar cells increased by Gu addition up to 7%. Although, in several reports it has been observed that Voc improves when Gu is used as post treatment over perovskite,22,40,41 in our case Voc present no significant variation with the addition of Gu, see Table S2.† The Jsc calculated from incident photon to current efficiency (IPCE) for reference and Gu7% gives 20.90 mA cm−2 and 21.6 mA cm−2, respectively, which is in good agreement with the Jsc measured, see Fig. S4C.†
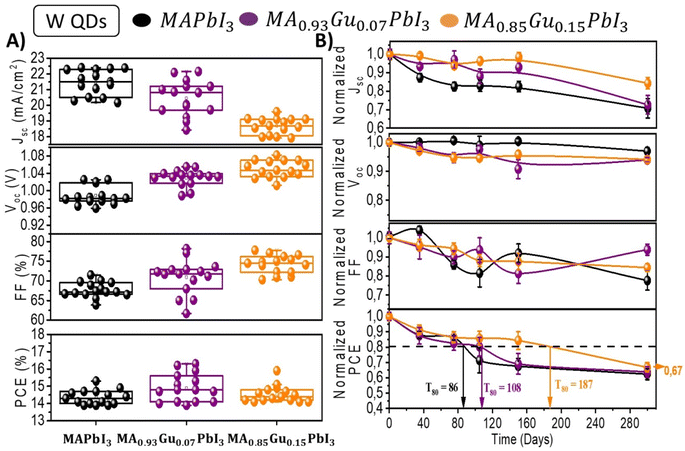
The devices stored at relative humidity (RH) of 40% in dark without encapsulation have been characterized over a period of 300 days; see Fig. S5,† in order to analyze their long term stability. Fig. 2A plots the initial photovoltaic values of devices prepared with x = 0, 7 and 15 Gu mol%. Fig. 2A shows the evolution of these parameters highlighting the average T80 of the different samples. The highest T80 of 165 days was observed for Gu7%. After ∼1 year the PCE is the 64% of the original values as observed in Fig. 2B and S6.†
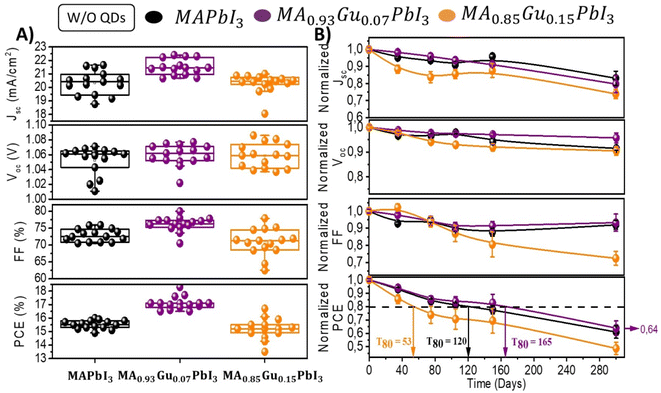 | ||
| Fig. 2 (A) Solar cell parameters of devices fabricated with perovskite active layer with different amount of Gu. (B) Time evolution of non encapsulated devices in (A) measured during 300 days while kept them in ambient at 30–40% RH, dark conditions and 22 °C. Dashed line corresponds to value equivalent to 80% of initial PCE. See Fig. S5 and S6† for a more detailed analysis. | ||
In order to exploit further the effect of strain in the stability of samples containing Gu, PbS QDs have been added. It has been previously reported that addition of PbS QDs and nanoplatelets18 can increase long term stability of perovskite solar cells in a broad range of perovskite materials and fabrication procedures.13,17,18 In order to introduce QDs in perovskite solution, ligand exchange was performed according to previous reports to obtain PbS/MAxGu1−xPbI3 at 1 mg ml−1 concentration of PbS, producing MAxGu1−xPbI3 films with embedded QDs.42 MAPbI3 and Gu7% films show difference in PL intensity after the addition of PbS QDs, see Fig. S7A.† For most of the films a PL quenching is observed, associated to a possible non-radiative recombination pathway at the perovskite/PbS interface. This fact hinders the carrier recombination into the perovskite. Interestingly, the PL intensity for the Gu15%-based perovskite is preserved after the addition of PbS QDs. Both, MAPbI3 and MA1−xGuxPbI3 perovskite, exhibit a blue-shift to higher band gap after PbS incorporation, see Fig. S7B, S8 and Table S3.†
XRD comparative analysis, see Fig. S9A and B† respectively, exhibit same peaks indicating similar crystalline structure, with volume variation as commented in depth below. In addition, same grain size distributions compared to the systems without QDs have been observed by SEM analysis; see Fig. S9B and S10.† The crystal size for each mixture is calculated obtaining maximum value for Gu7%. This indicates that the PbS QDs structural effects are more prominent in the case of Gu7%, see Fig. S10B.†
As reported in Table S4,† similar trend in efficiency is observed with PbS QDs are added. However, QDs cause lower PCE mainly because of lower photocurrents. When QDs are added a slight increase of Voc is observed with the increase of Gu content reaching the maximum average value in Gu15% of 1.05 V, see Table S4.† In particular, the parameters of fresh devices of the selected cases x = 0; 7 and 15% are reported in Fig. 3A, while the remaining mixtures are shown in Fig. S11.† The fresh devices have been stored at 40% RH in dark conditions and measured at different moments over a period of ∼1 year, see Fig. S12.†
Interestingly, unlike the behaviour of devices without QDs the incorporation of them slightly changes the stability of all the devices. The incorporation of QDs produces a decrease of T80 for reference and Gu7% to 86 and 108 days respectively, however, for Gu15% T80 is impressively improved from 53 to 187 days (Fig. 3B). Lastly, Gu15% with QDs showed at 300 days a PCE of 67% of the initial value, which is statistically the highest of all the devices analysed, with or without QDs.
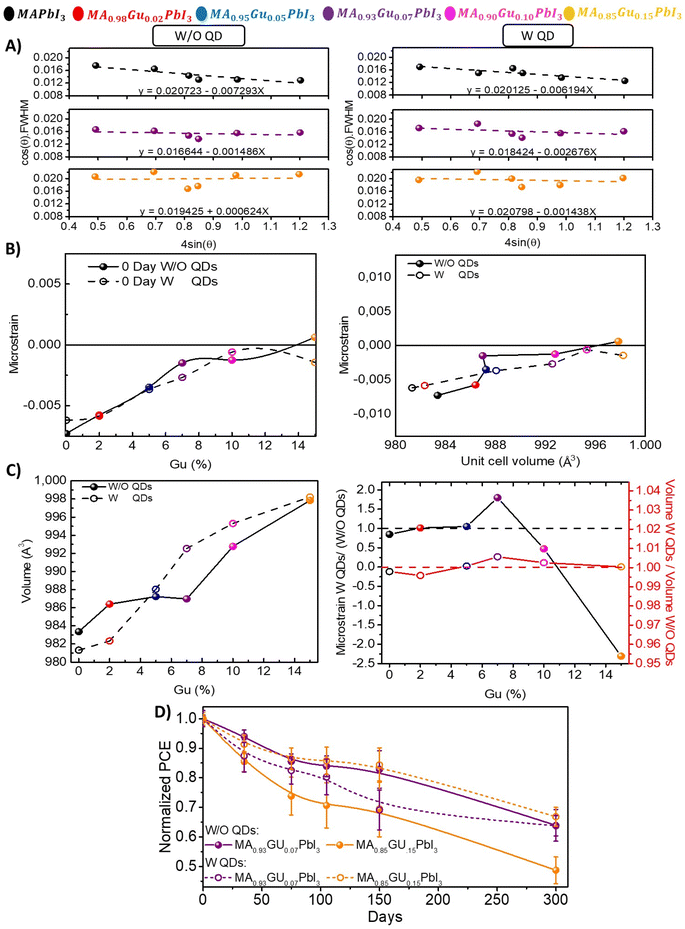
To unveil the role that Gu and QDs addition are taking at structural level and how it influences the stability, the strain was calculated by Williamson–Hall (WH)23 method. The WH slopes of all mixtures without (W/O) QDs and with (W) QDs are shown in Fig. S13A,† while the target cases (reference, Gu7% and Gu15%) are shown in Fig. 4A. It is possible to observe that the slopes have a negative value mostly associated to the anisotropy of the tetragonal system. Moreover, the strain increases with the amount of Gu, due to its bigger dimension than MA, see Fig. 4B. Upon QDs incorporation the slopes change, indicating strain modification.
However, the most remarkable case is the one of Gu15% due to the higher absolute value variation from positive (tensile strain), to negative strain (compressive),30,43 after adding PbS QDs. It is worth to note that Gu15% with QDs have a very similar strain value, ∼−0.0014, than the best performing system without QDs which is Gu7% Fig. S13.† Thus, with higher amount of Gu, the role of the PbS is clear: the expansions seems to predominate, as indicated by the tensile strain >0, but the compressive strain coming from the interaction with the PbS aids in containing the relaxation and increases the stability.
The unit cell volume for each sample with and without QDs, see Fig. 4C and Experimental section calculation details, can be also correlated to the strain. Firstly, for samples without QDs, it was observed a slight increase in the volume up to Gu10% in parallel to an increase of the strain from negative (compressive) close to 0 values, namely a strain free system. At higher Gu concentration (x = 15) the volume increases, and the strain becomes positive (tensile), see Fig. 4B and C.
Again, Gu7% is a remarkable point because of the efficiency and basic structural and optical properties commented above, but also because up to this system the strain value changes, while the unit cell volume is almost constant. This fact indicates that at this concentration the structure is at limit of the stability, with which high performances and stability can be achieved. On the contrary, upon the PbS incorporation, a linear strain-volume relation is observed, see Fig. 4C. Thus, as expected the PbS has effect on the strain and on the unit cell volume.
This point indicates that the PbS aids in the incorporation of Gu in the structure, without losing the 3D crystal phase. In consequence, when QDs are incorporated a compressive strain is observed for reference, Gu2% and Gu5%, along with a reduction of the unit cell volume, as a logical consequence. On the contrary, Gu7% and Gu15% are characterized by a volume expansion, more prominent in the case of Gu7%, along with a compressive strain, causing diminishment in its stability because is not an optimal configuration. In the second case, at Gu15% is observed the highest variation in strain because in the presence of the QDs, although an expansion of the volume is observed, the tensile strain is converted in a compressive strain, see Fig. 4B. This fact highlights the role of the PbS in tuning the t of perovskite with big cation, suffering a normal expansion of their crystal unit cell volume with a relaxation to non-perovskite phases (i.e. yellow hexagonal/orthorhombic phases). Moreover, the mechanisms behind the variation of the strain in the perovskite lattice depend on the kind and quantity of additive/cation considered. According to this, to reach a balance between the volume expansion and a compressive strain to preserve the perovskite crystal phase, external additive like PbS need to be exploited. Then, QDs will contribute with structural and also thermodynamic stabilization, due to the surface energy and chemical bonds in addition to strain.13 Especially for the mixed cation perovskite with t > 1, this strategy is to be considered, in order to improve the properties of the material, like the PL (i.e. here is the highest for the system Gu7% with PbS), the thermal stability or the Voc, along with improved moisture and thermodynamic stability.
In Fig. 4C the weight of QDs perovskite systems relative to those without (W/O) QDs of strain and volume is reported, in which they follow a direct relation. For Gu7% and Gu15% with PbS, there is a maximum and minimum peak related to higher change in the strain than the system without QDs. It is worth to note that a minimum value for Gu15% is obtained due to a more significant variation in the strain (from tensile to compressive) obtained by the incorporation of QDs, see Fig. 4C. When performance of systems was analyzed the corresponding to Gu15% with QDs resulted in an increase of stability, see Fig. 4D. These facts show that the tuning of strain due to QDs could lead to stable and efficient solar cells.
Clearly, the structural changes in strain and volume will affect the PCE, the stability and the photovoltaic parameters,30,43,44 as analysed in Fig. 5. Fresh devices with QDs present lower efficiencies. The sample Gu7%, presents the highest unit cell volume expansion when QDs are added, see Fig. 4C, and it has lower PCE values than Gu15% when QDs are incorporated, see Fig. 5A. After ∼1 year the Gu15% with PbS QDs has the highest efficiency, see Fig. 5B. In fresh devices it is observed that the difference of the Jsc between system with and without PbS is more prominent for Gu7% and Gu15% where Jsc with QDs is lower than the one without QDs, see Fig. S14.† This fact indicates that the introduction of the compressive strain affects the photovoltaic performances. However, the compressive strain without an excessive volume expansion, the case of Gu15%, relatively improves the stability and in turn the photovoltaic parameters, like the Jsc, see Fig. S14B.†
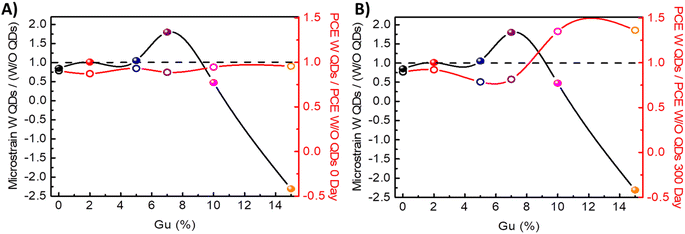 | ||
| Fig. 5 Microstrain of samples W QDs/(W/O QDs) for each Gu% value of PCE W QDs/PCE W/O QDs (A) for fresh samples and (B) and aged 300 days samples. | ||
Lastly the chronoamperometry have been measured at the maximum power point (mpp) for 3.600 s at 40% of R.H. without encapsulation for the main cases, x = 0; 7 and 15, see Fig. S15.† Gu improves the operation stability as the Jmpp decay is slower in comparison to the reference. When QDs were incorporated there is a general improvement in the current stability.
Beyond the relationship between structural properties and device performance, optoelectronic properties were also characterized. In Fig. 6 we plot the Voc of the devices versus light intensity, and we determine the ideality factor (n) that indicates the recombination behaviour of device,45,46 see Experimental section for further details. We can observe that in the samples in which we have different amounts of Gu (without QDs) the recombination mechanism is different, Fig. 6A. The process changes depending on the amount of Gu. It is observed that for the reference sample, without Gu, n has a value of 2.96, so the recombination mechanism is dominated by a multiple trapping process. However, by introducing Gu7%, n presents a value of 1.46; so the electronic behaviour is dominated by bulk recombination and exhibits some interface recombination too. Whereas, if we increase the amount of Gu up to 15%, n = 1.17, recombination at the interface is the main recombination pathway. From latter results it is observed that the change in the recombination mechanism by adding Gu is very significant.
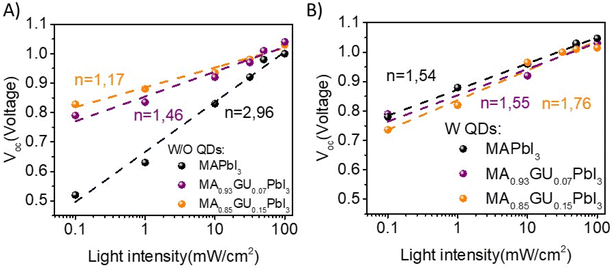 | ||
| Fig. 6 Voc vs. light intensity performed with different filters where the slope (n) indicates the recombination behavior for devices W/O QDs (A) and W QDs (B). | ||
The same study was carried out with QDs in the perovskite matrix, see Fig. 6B. The three devices with QDs and different amount of Gu have a similar recombination mechanism, dominated by a combination of recombination in both the bulk and the interface, showing that QD addition also affects recombination mechanism.
By using impedance spectroscopy (IS) under illumination, the electronic behaviour of the different devices based on their Gu composition, with or without QDs, was pointed out, see Experimental section for details. Impedance spectra was fitted using the equivalent circuit previously reported considering negligible the transport resistance, see Fig. S16A.†47 When Gu is add (W/O QDs), see Fig. S16B,† an increase of recombination resistance, Rrec, i.e. a decrease of recombination rate, cause the increase of Voc observed in Fig. 3A and the change in ideality factor Fig. 6A. However, when introducing QDs in the structure, see Fig. S16C,† recombination resistance is very similar in all structures, especially at higher voltage values when the samples are more conductive. All this indicates that adding a second compound to the structure, such as QDs, does not necessarily imply that the devices are improved by modifying the electronic mechanism or the strain, but only an improvement in stability is produced.
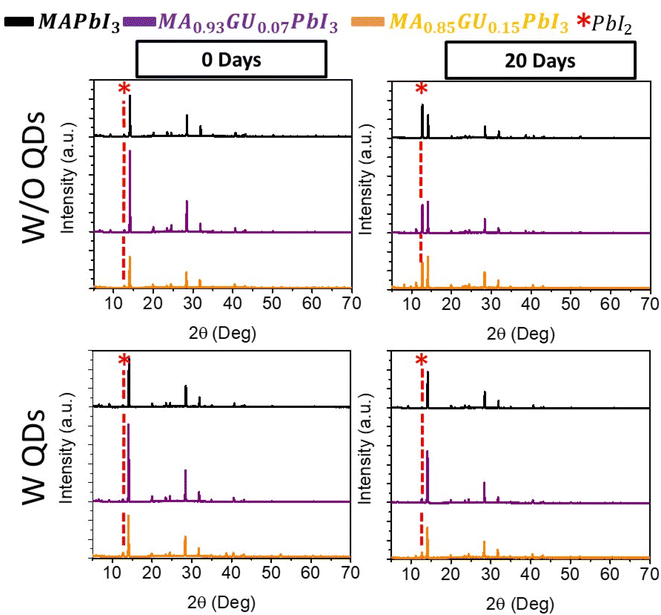
Finally, the PbS QDs has also an effect especially when a structure close to the 2D is forming, while in the case of lower amount of Gu, the incorporation inside the 3D structure is not hindered by the PbS QDs. The use of Gu and QDs stabilizes the perovskite avoiding or significantly reducing the presence of PbI2 peak at 12.6° observed after sample aging, in Fig. 7 and S17.†
Thus, we observed very similar strain in Gu7% and Gu15% with PbS, indicating that other mechanisms different from the strain, like surface energy and chemical bonds between the inorganic perovskite portion and the PbS and the control of the volume expansion confer stability to the system. In fact, in the case of small quantities of Gu with PbS QDs, the devices long-term stability has not benefits, likely due to unbalance between volume and strain. On the other hand, right before the formation of the 2D structure (Gu = 15%) the PbS QDs play a fundamental role and the complete stabilization of the structure is achieved. The slightly lower efficiency obtained, due to introduction of non-radiative recombination path, is then compensated by the long-term stability attained, with the ultimate goal of exploiting the strain and the structural modification for stable and efficient solar cells.
Conclusion
To analyze the effect of strain in the performance of MAPbI3, addition on Gu cation and PbS QDs are employed. As Gu amount increases, a better film morphology with bigger grains, better crystallinity and photoluminescence are obtained peaking for a 7% of Gu and decreasing for higher content. The mentioned Gu7% allow us to obtain a champion device with a PCE = 18.3% with improved stability that result in T80 = 165 days, in comparison with the T80 = 120 days of pure MAPbI3. Addition of PbS QDs results in a slight decrease of efficiency, correlated with PL blue-shift, but at the same time in an improvement of device stability for high Gu content. The unit cell volume as well as strain is affected due to PbS QD incorporation: in the sample with Gu7% a decrease of the strain at expenses of a relevant relaxation in unit cell volume is observed. These changes resulted in a reduction of T80 from 165 to 108 days. On the contrary, for Gu15% the highest variation in strain from tensile to compressive, with slight volume expansion is achieved. Importantly, this latter fact reflects that compressive strain and controlled unit cell volume expansion is associated with a better stability with T80 dramatic increases in Gu15% from 53 days to 187 days. Moreover, this study highlights that with PbS QDs in the system with Gu15%, the same strain value of the best performing Gu7% without QDs system is obtained. The strain is one of the mechanisms correlated with the high PCE, but its effect needs to be clearly addressed, as it can bring to PCE and stability improvement, as it is shown in this work. Specifically in this work we found that the careful control of the unit cell volume along a compressive strain close to zero is the key to obtain stable solar cells.Conflicts of interest
The authors declare no conflicts of interest.Acknowledgements
This work was supported by European Research Council via Consolidator Grant (724424–No-LIMIT), Ministry of Science and Innovation of Spain under Project STABLE (PID2019-107314RB-I00), Generalitat Valenciana under project PrometeoQ-Solutions (CIPROM/2021/078) and the University Jaume I (Project DEPE2D UJI-B2019-09). P. S. acknowledges funding from the Generalitat Valenciana under a Grisolia pre-doctoral contract reference GRISOLIAP/2019/065. The authors are very grateful to the ‘Serveis Centrals d'Instrumentació Científica (SCIC)’ of the Universitat Jaume I.References
- H. Singh, P. Dey, S. Chatterjee, P. Sen and T. Maiti, Sol. Energy, 2021, 220, 258–268 CrossRef
.
- A. M. A. Leguy, P. Azarhoosh, M. I. Alonso, M. Campoy-Quiles, O. J. Weber, J. Yao, D. Bryant, M. T. Weller, J. Nelson, A. Walsh, M. van Schilfgaarde and P. R. F. Barnes, Nanoscale, 2016, 8, 6317–6327 RSC
.
- F. F. Targhi, Y. S. Jalili and F. Kanjouri, Results Phys., 2018, 10, 616–627 CrossRef
.
- L. M. Herz, ACS Energy Lett., 2017, 2, 1539–1548 CrossRef CAS
.
- T. Kirchartz, T. Markvart, U. Rau and D. A. Egger, J. Phys. Chem. Lett., 2018, 9, 939–946 CrossRef CAS PubMed
.
- X. Zhao, J. Dong, D. Wu, J. Zhou, J. Feng, Y. Yao, C. Y. Xu, X. Yang, X. Tang and Q. Song, ACS Appl. Energy Mater., 2021, 4, 3794–3802 CrossRef CAS
.
- L. M. Pazos-Outón, T. P. Xiao and E. Yablonovitch, J. Phys. Chem. Lett., 2018, 9, 1703–1711 CrossRef PubMed
.
- M. I. Asghar, J. Zhang, H. Wang and P. D. Lund, Renew. Sustain. Energy Rev., 2017, 77, 131–146 CrossRef CAS
.
- Q. Wang, B. Chen, Y. Liu, Y. Deng, Y. Bai, Q. Dong and J. Huang, Energy Environ. Sci., 2017, 10, 516–522 RSC
.
- W. Nie, J.-C. Blancon, A. J. Neukirch, K. Appavoo, H. Tsai, M. Chhowalla, M. A. Alam, M. Y. Sfeir, C. Katan, J. Even, S. Tretiak, J. J. Crochet, G. Gupta and A. D. Mohite, Nat. Commun., 2016, 7, 11574 CrossRef CAS PubMed
.
- H. Shahivandi, M. Vaezzadeh and M. Saeidi, Sol. Energy Mater. Sol. Cells, 2020, 208, 110383 CrossRef CAS
.
- X. Zhang, X. Chen, Y. Chen, N. A. Nadege Ouedraogo, J. Li, X. Bao, C. B. Han, Y. Shirai, Y. Zhang and H. Yan, Nanoscale Adv., 2021, 3, 6128–6137 RSC
.
- S. Masi, C. Echeverría-Arrondo, K. M. M. Salim, T. T. Ngo, P. F. Mendez, E. López-Fraguas, D. F. Macias-Pinilla, J. Planelles, J. I. Climente and I. Mora-Seró, ACS Energy Lett., 2020, 5, 418–427 CrossRef CAS
.
- S. Masi, A. F. Gualdrón-Reyes and I. Mora-Seró, ACS Energy Lett., 2020, 5, 1974–1985 CrossRef CAS
.
- J. Rodríguez-Romero, J. Sanchez-Diaz, C. Echeverría-Arrondo, S. Masi, D. Esparza, E. M. Barea and I. Mora-Seró, ACS Energy Lett., 2020, 5, 1013–1021 CrossRef
.
- J.-W. Lee, Z. Dai, T.-H. Han, C. Choi, S.-Y. Chang, S.-J. Lee, N. De Marco, H. Zhao, P. Sun, Y. Huang and Y. Yang, Nat. Commun., 2018, 9, 3021 CrossRef PubMed
.
- K. M. M. Salim, S. Masi, A. F. Gualdrón-Reyes, R. S. Sánchez, E. M. Barea, M. Kreĉmarová, J. F. Sánchez-Royo and I. Mora-Seró, ACS Energy Lett., 2021, 6, 3511–3521 CrossRef CAS PubMed
.
- H. E. Sánchez-Godoy, E. A. Erazo, A. F. Gualdrón-Reyes, A. H. Khan, S. Agouram, E. M. Barea, R. A. Rodriguez, I. Zarazúa, P. Ortiz, M. T. Cortés, V. Muñoz-Sanjosé, I. Moreels, S. Masi and I. Mora-Seró, Adv. Energy Mater., 2020, 10, 2002422 CrossRef
.
- S.-S. Li, C.-H. Chang, Y.-C. Wang, C.-W. Lin, D.-Y. Wang, J.-C. Lin, C.-C. Chen, H.-S. Sheu, H.-C. Chia, W.-R. Wu, U. S. Jeng, C.-T. Liang, R. Sankar, F.-C. Chou and C.-W. Chen, Energy Environ. Sci., 2016, 9, 1282–1289 RSC
.
- T. T. Ngo, S. Masi, P. F. Mendez, M. Kazes, D. Oron and I. M. Seró, Nanoscale Adv., 2019, 1, 4109–4118 RSC
.
- J. Han, S. Luo, X. Yin, Y. Zhou, H. Nan, J. Li, X. Li, D. Oron, H. Shen and H. Lin, Small, 2018, 14, 1801016 CrossRef PubMed
.
- S. Wang, Y. Zhu, W. Sun, X. Miao, Z. Ma, C. Yang, B. Liu, S. Li, R. Ma and C. Wang, Sol. Energy, 2018, 176, 118–125 CrossRef CAS
.
- S. A. Kulkarni, T. Baikie, S. Muduli, R. Potter, S. Chen, F. Yanan, P. Bishop, S. S. Lim, T. C. Sum, N. Mathews and T. J. White, Jpn. J. Appl. Phys., 2017, 56, 08MC05 CrossRef
.
- G. Grancini, C. Roldán-Carmona, I. Zimmermann, E. Mosconi, X. Lee, D. Martineau, S. Narbey, F. Oswald, F. De Angelis, M. Graetzel and M. K. Nazeeruddin, Nat. Commun., 2017, 8, 15684 CrossRef CAS PubMed
.
- F. Ünlü, E. Jung, J. Haddad, A. Kulkarni, S. Öz, H. Choi, T. Fischer, S. Chakraborty, T. Kirchartz and S. Mathur, APL Mater., 2020, 8, 070901 CrossRef
.
- Y. Zhang, P. Wang, M.-C. Tang, D. Barrit, W. Ke, J. Liu, T. Luo, Y. Liu, T. Niu, D.-M. Smilgies, Z. Yang, Z. Liu, S. Jin, M. G. Kanatzidis, A. Amassian, S. F. Liu and K. Zhao, J. Am. Chem. Soc., 2019, 141, 2684–2694 CrossRef CAS PubMed
.
- E. Vega, M. Mollar and B. Marí, J. Alloys Compd., 2018, 739, 1059–1064 CrossRef CAS
.
- D. J. Kubicki, D. Prochowicz, A. Hofstetter, M. Saski, P. Yadav, D. Bi, N. Pellet, J. Lewiński, S. M. Zakeeruddin, M. Grätzel and L. Emsley, J. Am. Chem. Soc., 2018, 140, 3345–3351 CrossRef CAS PubMed
.
- T. Kishimoto, A. Suzuki, N. Ueoka and T. Oku, Mater. Proc., 2021, 4, 55 Search PubMed
.
- D.-J. Xue, Y. Hou, S.-C. Liu, M. Wei, B. Chen, Z. Huang, Z. Li, B. Sun, A. H. Proppe, Y. Dong, M. I. Saidaminov, S. O. Kelley, J.-S. Hu and E. H. Sargent, Nat. Commun., 2020, 11, 1514 CrossRef CAS PubMed
.
- K. Nishimura, D. Hirotani, M. A. Kamarudin, Q. Shen, T. Toyoda, S. Iikubo, T. Minemoto, K. Yoshino and S. Hayase, ACS Appl. Mater. Interfaces, 2019, 11, 31105–31110 CrossRef CAS PubMed
.
- A. D. Jodlowski, C. Roldán-Carmona, G. Grancini, M. Salado, M. Ralaiarisoa, S. Ahmad, N. Koch, L. Camacho, G. de Miguel and M. K. Nazeeruddin, Nat. Energy, 2017, 2, 972–979 CrossRef CAS
.
- N. Cheng, W. Li, M. Zhang, H. Wu, S. Sun, Z. Zhao, Z. Xiao, Z. Sun, W. Zi and L. Fang, Curr. Appl. Phys., 2019, 19, 25–30 CrossRef
.
- X. Hou, Y. Hu, H. Liu, A. Mei, X. Li, M. Duan, G. Zhang, Y. Rong and H. Han, J. Mater. Chem. A, 2017, 5, 73–78 RSC
.
- J. Zou, W. Liu, W. Deng, G. Lei, S. Zeng, J. Xiong, H. Gu, Z. Hu, X. Wang and J. Li, Electrochim. Acta, 2018, 291, 297–303 CrossRef CAS
.
- P. F. Méndez, S. K. M. Muhammed, E. M. Barea, S. Masi and I. Mora-Seró, Solar RRL, 2019, 3, 1900191 CrossRef
.
- Y. Chen, Q. Meng, L. Zhang, C. Han, H. Gao, Y. Zhang and H. Yan, J. Energy Chem., 2019, 35, 144–167 CrossRef
.
- J. A. Smith, O. S. Game, J. E. Bishop, E. L. K. Spooner, R. C. Kilbride, C. Greenland, R. Jayaprakash, T. I. Alanazi, E. J. Cassella, A. Tejada, G. Chistiakova, M. Wong-Stringer, T. J. Routledge, A. J. Parnell, D. B. Hammond and D. G. Lidzey, ACS Appl. Energy Mater., 2020, 3, 5552–5562 CrossRef CAS PubMed
.
- D. Yang, R. Yang, K. Wang, C. Wu, X. Zhu, J. Feng, X. Ren, G. Fang, S. Priya and S. Liu, Nat. Commun., 2018, 9, 3239 CrossRef PubMed
.
- R. D. Chavan, D. Prochowicz, M. M. Tavakoli, P. Yadav and C. K. Hong, Adv. Mater. Interfaces, 2020, 7, 2000105 CrossRef CAS
.
- N. D. Pham, V. T. Tiong, D. Yao, W. Martens, A. Guerrero, J. Bisquert and H. Wang, Nano Energy, 2017, 41, 476–487 CrossRef CAS
.
- T. T. Ngo, I. Suarez, R. S. Sanchez, J. P. Martinez-Pastor and I. Mora-Sero, Nanoscale, 2016, 8, 14379–14383 RSC
.
- J. Wu, S.-C. Liu, Z. Li, S. Wang, D.-J. Xue, Y. Lin and J.-S. Hu, Natl. Sci. Rev., 2021, 8(8), nwab047 CrossRef CAS PubMed
.
- Y. Jiao, S. Yi, H. Wang, B. Li, W. Hao, L. Pan, Y. Shi, X. Li, P. Liu, H. Zhang, C. Gao, J. Zhao and J. Lu, Adv. Funct. Mater., 2021, 31, 2006243 CrossRef CAS
.
- W. Tress, M. Yavari, K. Domanski, P. Yadav, B. Niesen, J. P. Correa Baena, A. Hagfeldt and M. Graetzel, Energy Environ. Sci., 2018, 11, 151–165 RSC
.
- E. Velilla, F. Jaramillo and I. Mora-Seró, Nat. Energy, 2021, 6, 54–62 CrossRef CAS
.
- S.-M. Yoo, S. J. Yoon, J. A. Anta, H. J. Lee, P. P. Boix and I. Mora-Seró, Joule, 2019, 3, 2535–2549 CrossRef CAS
.
Footnote |
| † Electronic supplementary information (ESI) available: Details of experiments and additional supplementary figures. See DOI: https://doi.org/10.1039/d2ra06473a |
| This journal is © The Royal Society of Chemistry 2022 |

