 Open Access Article
The synergism between self-activated and impurity-related emissions of LiCa3ZnV3O12: lattice distortion, energy transfer and temperature sensing effect†
Jie Li,
Ruixia Shi ,
Yongqiang Cao,
Qian Ma
 ,
Ling Chen
 ,
Aiyu Zhang
 * and
Ping Yang
 *
*
School of Material Science and Engineering, University of Jinan, 250022, Jinan, China. E-mail: mse_zhangay@ujn.edu.cn; mse_yangp@ujn.edu.cn
First published on 16th December 2022
Abstract
Some of the metal vanadates have special self-activated luminescence. In order to further enrich its luminous color, luminescent impurity ions can be introduced into its lattice. The interaction between the self-activated emission and the impurity-related emission remains to be studied. In this work, the synergism between the two kinds of emission in LiCa3ZnV3O12 was explored from these three aspects: lattice distortion, energy transfer and temperature effect. Eu3+ ions replace Ca2+ ions in the lattice of LiCa3ZnV3O12, leading to a lattice contraction of the LCZV host, which depresses the self-activating emission around 500 nm. The characteristic linear emissions of Eu3+ ions are also observed benefiting from the energy transfer from [VO4]3− to Eu3+. Since the temperature quenching effect is more sensitive for the self-activated emission than that for the Eu3+-related ones, the phosphor can be applied as a luminescent temperature sensor, with the absolute and relative temperature sensitivities of 0.012 K−1 and 1.56% K−1, respectively.
Introduction
Phosphor-converted white light emitting diodes (WLEDs), known as fourth generation lighting sources, have attracted a lot of attention for their advantages of high efficiency, no mercury pollution, low carbon emissions, long life, small size, energy-saving and so on.1,2 Since human vision is not sensitive to UV light, the search for LED phosphors excited by UV and near-UV light has become a research hotspot.Metal vanadate materials with different crystal structures exhibit various physical and chemical properties and are good phosphor host materials.3,4 Under the excitation of UV light, vanadate can produce a bright self-activation broad emission band in the wavelength range of 400–800 nm originating from the charge transfer (CT) transition of the [VO4] tetrahedron.5–8 The specific emission color/wavelength is mainly determined by certain metal ions and the crystal structure of the vanadates.9–11
Garnet structure-based vanadate phosphors usually exhibit a self-activated blue-green emission. The garnet structure belongs to the cubic crystal system, described by the general formula A3B2C3O12 with a space group Ia![[3 with combining macron]](https://www.rsc.org/images/entities/char_0033_0304.gif) d (230).12,13 So far, several garnet structured vanadates, such as LiCa3ZnV3O12,14 NaCa2Mg2V3O12,15,16 Ca2KZn2(VO4)3,17 and KCa2Mg2V3O12,18 have been reported for the self-activating luminescent emissions. To expand the luminescent property of the garnet-structured vanadate phosphors, various rare earth ions have been introduced into these hosts, resulting in several new luminescent systems, such as NaCa2Mg2V3O12:Sm3+,19 Ca2AgZn2V3O12:Nb5+,20 CaZnV2O7:Eu3+,21 and Ca2KZn2V3O12:Dy3+.22
d (230).12,13 So far, several garnet structured vanadates, such as LiCa3ZnV3O12,14 NaCa2Mg2V3O12,15,16 Ca2KZn2(VO4)3,17 and KCa2Mg2V3O12,18 have been reported for the self-activating luminescent emissions. To expand the luminescent property of the garnet-structured vanadate phosphors, various rare earth ions have been introduced into these hosts, resulting in several new luminescent systems, such as NaCa2Mg2V3O12:Sm3+,19 Ca2AgZn2V3O12:Nb5+,20 CaZnV2O7:Eu3+,21 and Ca2KZn2V3O12:Dy3+.22
Several questions should be discussed as the rare earth ions with characteristic luminescence being doped into hosts with self-activating emissions. First, how does the lattice distortion corresponding to the impurity ions affect the self-activated emission? Second, is there any energy transfer existing between the CT transition of the [VO4] tetrahedron and the energy-level transition of the doping rare earth ions? Third, the temperature effects on the two emissions. All these three questions are still not well solved, although they are so obvious and common in ion-doped self-activated luminescence systems.
In this work, self-activated LCZV:xEu3+ (x = 0–0.155) phosphors were prepared by a solution combustion reaction. Trying to solve the above three questions, we would analyze the crystal structure of pure and Eu3+-doped LCZV, and monitor the photoluminescence of all the samples at room and higher temperatures. The energy transfer pathways of the LCZV host induced by Eu3+ are also investigated in detail. Meanwhile, a series of color-tunable phosphors would be obtained, and the possibility of their application would be evaluated as LED devices and fluorescent temperature sensors.
Experimental section
Synthesis of phosphors
The raw materials include calcium(II) nitrate (Ca(NO3)2·4H2O, 99.0%, Sinopharm), lithium(I) nitrate (LiNO3, 99.9%, Sinopharm), zinc(II) nitrate (Zn(NO3)2·6H2O, 98.0%, Damao Chemical Reagent Factory), europium(III) oxide (Eu2O3, 99.99%, Macklin), ammonium metavanadate (NH4VO3, 99.95%, Aladdin), and citric acid ((C6H8O7·H2O), 99.99%, Aladdin).The chemical eqn (1) of LCZV:xEu3+ phosphors preparation is as follows:23–25
| 3Ca(NO3)2·4H2O + Zn(NO3)2·6H2O + LiNO3 + 3NH4VO3 + 4C6H8O7·H2O → LiCa3ZnV3O12 + 24CO2↑ + 26H2O + 12NH3↑ | (1) |
In a typical synthesis of LCZV phosphor, various nitrates were weighted according to the stoichiometric ratio in eqn (1), dissolved in the deionized water, and then mixed together. Appropriate amounts of NH4VO3 and citric acid were added in sequence to the mixed solution. After stirring for 10 min, an orange solution was obtained, which gradually changed to dark brown and finally to blue when heated to 80 °C. The pH value of the solution was adjusted with HNO3 and NH3·H2O solution. The prepared blue solution was transferred to a crucible, and the solution combustion reaction was carried out in air at 600 °C and kept for 20 min. The products were taken out after heat treatment and ground into fine powder.
For Eu3+-doped LCZV phosphors, the experimental steps are exactly the same except that the raw materials are slightly adjusted according to their respective molecular formula.
Sample characterization
The X-ray powder diffraction (XRD) data of the samples were collected on an Ultima IV X-ray diffractometer (Rigaku, Japan) with Cu Kα radiation (λ = 1.5418 Å) at a scanning rate of 5° min−1 in the range of 2θ from 15° to 80° at room temperature. Temperature-dependent XRD was acquired on a Smartlab X-ray diffractometer (Rigaku, Japan) with a temperature controller. Rietveld refinements of XRD patterns were conducted by general structure analysis programs to obtain the cell parameters and related information. The microstructure and chemical composition of the samples were analyzed by scanning electron microscopy (SEM) (Zeiss Gemini 300, Germany) and energy dispersive spectroscopy (EDS), respectively. The PL excitation (PLE) and PL spectra of the samples were obtained by a fluorescence spectrophotometer (Hitachi F-4600, Japan) with a xenon lamp of 150 W as an excitation source at room temperature. The PL decay curves of the samples were recorded by a steady-state/transient fluorescence spectrometer (Edinburgh Instruments FLS1000, Britain).Fabrication of LED devices and temperature-dependent PL measurement
LED devices were fabricated by coating phosphors on a 310 nm UVB LED chip driven by 3.5 V and 40 mA using high refractive silicone (A![[thin space (1/6-em)]](https://www.rsc.org/images/entities/char_2009.gif) :
:![[thin space (1/6-em)]](https://www.rsc.org/images/entities/char_2009.gif) B = 1
B = 1![[thin space (1/6-em)]](https://www.rsc.org/images/entities/char_2009.gif) :
:![[thin space (1/6-em)]](https://www.rsc.org/images/entities/char_2009.gif) 4) as the binder.
4) as the binder.
The temperature-dependent PL characteristics of the samples were obtained by referring to the strategy in ref. 26 which was evaluated by heating the samples sealed in a metallic box and kept them at a particular temperature, and then rapidly transferring the sample at a specific temperature from the heater to the fluorescence spectrophotometer for measurement.
Results and discussion
Crystal structure and lattice distortion
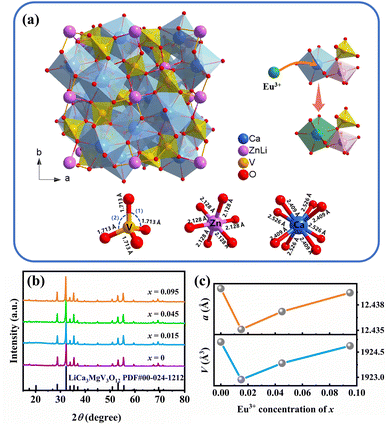
The crystal structure model and coordinate environment of LCZV are shown in Fig. 1(a). LCZV has a garnet structure (space group Ia![[3 with combining macron]](https://www.rsc.org/images/entities/char_0033_0304.gif) d (230)) with the general formula A3B2C3O12,12,27 in which A is Ca2+, B is Li+ or Zn2+, and C is V5+. The whole structure is mainly composed of tetrahedron [VO4], dodecahedron [CaO8] and octahedron [ZnO6], wherein [ZnO6] form a regular octahedron structure are sharing borders and corners with [VO4] and [CaO8]. The unit cell of the LCZV structure can be viewed as a connected network of dodecahedron, octahedron and tetrahedron.
d (230)) with the general formula A3B2C3O12,12,27 in which A is Ca2+, B is Li+ or Zn2+, and C is V5+. The whole structure is mainly composed of tetrahedron [VO4], dodecahedron [CaO8] and octahedron [ZnO6], wherein [ZnO6] form a regular octahedron structure are sharing borders and corners with [VO4] and [CaO8]. The unit cell of the LCZV structure can be viewed as a connected network of dodecahedron, octahedron and tetrahedron.
Fig. 1(b) exhibits the XRD patterns of LCZV:xEu3+ (x = 0, 0.015, 0.045, 0.095) samples. From Fig. 1(b), all the diffraction peaks of pure LCZV and LCZV:xEu3+ samples with different Eu3+-doping concentrations are well correlated with the standard card (JCPDS no. 24-1212),10,28 which indicates the formation of pure phase LCZV host and the absence of second phase related to the doping of Eu3+.
Davolos' research shows that efficient ion substitution can be achieved when the ionic radii difference percentage (Dr) between dopant ions and replaced ions is within 30%. Dr can be estimated by eqn (2):8
 | (2) |
| Host cation (CN) | Doped ion (CN) | Rm (Å) | Rd (Å) | Dr (%) |
|---|---|---|---|---|
| Ca2+ (8) | Eu3+ (8) | 11.20 | 10.66 | 4.82 |
| Zn2+ (6) | Eu3+ (6) | 7.40 | 9.47 | 27.97 |
| Li+ (6) | Eu3+ (6) | 7.60 | 9.47 | 24.61 |
To further verify the phase purity and Eu3+ doping sites of the designed samples, the XRD patterns of LCZV:xEu3+ (x = 0, 0.015, 0.045, 0.095) samples were fitted by the Rietveld refinement method (the results are shown in Fig. S1†) to optimize the initial crystal structure of the samples. The good R-factors and χ values are shown in Table S1,† and the detailed atomic coordinates are listed in Table S2.† Table 2 shows the bond length and angles obtained from XRD refinement. It can be observed that V5+ and Ca2+ ions have complicated bond lengths, and two kinds of angles O–V–O(1) and O–V–O(2) can also be seen in [VO4]. The coordinate environment of metal–oxygen polyhedrons obtained is also exhibited in Fig. 1(a).
| Sample (x) | Bond distances (Å) | Bond angles (°) | ||||
|---|---|---|---|---|---|---|
| Ca–O | Zn–O | V–O | V–V | O–V–O(1) | O–V–O(2) | |
| a O–V–O(1) and O–V–O(2) represent two symmetric vanadium–oxygen bond angles in [VO4] respectively, and the angle variation trend between O–V–O(1) and O–V–O(2) is inversely proportional. | ||||||
| 0 | 2.468 | 2.128 | 1.713 | 3.809 | 114.05 | 100.70 |
| 0.015 | 2.462 | 2.124 | 1.730 | 3.807 | 113.37 | 101.92 |
| 0.045 | 2.462 | 2.126 | 1.724 | 3.808 | 113.77 | 101.18 |
| 0.095 | 2.463 | 2.128 | 1.718 | 3.808 | 113.74 | 101.24 |
By analyzing the cell parameters (a, V) of the samples in Table S1,† it can be found that the introduction of Eu3+ ions led to a shrinkage of the LCZV lattice. This lattice contraction coincides with the inference that partial Ca2+ sites are occupied by Eu3+ ions with smaller ionic radius. From Fig. 1(c) drawn according to Table S1,† it is obvious that the cell parameter of LCZV:xEu3+ (x = 0, 0.015, 0.045, 0.095) samples almost linearly increased with Eu3+ ions concentration which deviated from Vegard's law, although the cell parameter of all the doped samples are smaller than that of pure one. This increasing trend of the cell parameter with Eu3+ concentration can be attributed to the generation of interstitial oxygen for the purpose of charge balance, which has been broken when the trivalent Eu3+ ions occupied the divalent Ca2+ ion sites.
Table 2 summarizes the average interatomic distance and O–V–O bond angle of the LCZV:xEu3+ (x = 0, 0.015, 0.045, 0.095) samples, which show various changes with the increase of Eu3+ concentration. Among them, the decrease of the Ca–O bond length led to the lattice contraction of the [CaO8] dodecahedron; the increase of the V–O bond length and the change of the two kinds of O–V–O bond angles resulted in the lattice expansion of the [VO4] tetrahedron, which squeezes the Zn–O bond length at the adjacent [ZnO6] octahedra to relieve the lattice strain. This lattice expansion with the increase of Eu3+ doping concentration gives another evidence for the existence of interstitial oxygen. These phenomena further prove that Eu3+ successfully replaces Ca2+ and occupies the lattice sites.
It can be seen from Fig. 2(a) and S2† that LCZV samples show similar micromorphology before and after Eu3+ doping, although the particle sizes of the samples decrease with Eu3+ doping concentration. All samples are composed of particles with holes and adhered to each other. Based on this morphology, we deduced the growth mechanism of LCZV. After ignition at 600 °C, the combustion reaction of the precursor will release a lot of heat, instantly generating a very high temperature inside the sample. Under such high temperatures, the precursor decomposes, LCZV nucleates and grows rapidly (according to the reaction eqn (1)). Since the process of nucleation and growth is very fast, the particles stick together and show the morphology of adhesion. At the same time, a large amount of gas is released due to the burning of organic fuel (citric acid) in this process, which explains the appearance of holes in LCZV particles. The elemental composition of LCZV:0.015Eu3+ has been characterized by EDS and the results are shown in Fig. 2(b) and (c). From Fig. 2(b), the elements of Ca, Zn, V, and Eu all exhibit uniform distribution, indicating homogeneous doping of Eu ions. The EDS image (Fig. 2(c)) revealed all elements present in the sample, including small peaks of lower energy due to Eu3+ doping and a carbon peak caused by the use of carbon ribbons in the sample preparation.17
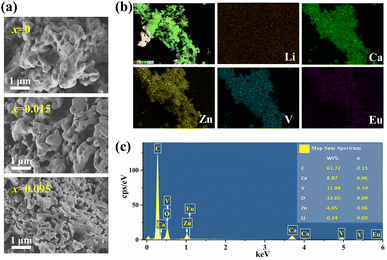 | ||
| Fig. 2 (a) SEM images of LCZV:xEu3+(x = 0, 0.015, 0.095). (b) Elemental mapping images of LCZV:0.015Eu3+. (c) EDS pattern (inset shows the elemental wt% distribution) of LCZV:0.015Eu3+. | ||
The self-activated luminescence and Eu3+-related luminescence
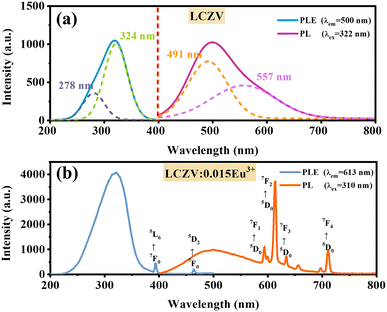
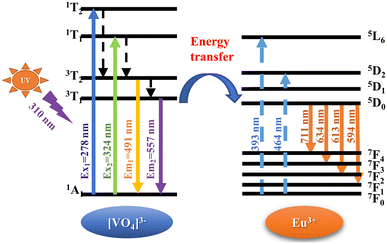
PLE and PL spectra of pure LCZV and LCZV:xEu3+ phosphors are shown in Fig. 3. As shown in Fig. 3(a), the PLE spectrum of pure LCZV measured with an emission wavelength of 500 nm is an excitation band centered at 322 nm. The PL spectrum measured under 322 nm UV-light excitation ranges from 400 to 750 nm, with a peak at 500 nm, and a full width at half maximum (FWHM) close to 121 nm. By using the Gaussian fitting, the emission band can be deconvoluted into two subbands around 491 nm and 557 nm, and the excitation band into two sub-bands around 278 nm and 324 nm. The luminescence of pure LCZV is attributed to the self-activated CT transitions of the [VO4]3− groups,11,29 which is described on the left in Fig. 4. Under the excitation of UV light, the electrons in the ground state 1A1 absorb energy and transition to the excited state 1T1 or 1T2 (corresponding to the excitation peaks at 278 nm and 324 nm), then relax to 3T1 or 3T2 through a non-radiative transition, and finally decay to the ground state 1A1 and emit light around 491 nm (3T2 → 1A1) and 557 nm (3T1 → 1A1).As shown in Fig. 3(b), the PL spectrum of LCZV:0.015Eu3+ phosphor collected under 310 nm excitation exhibits both the self-activated luminescence of [VO4]3− groups around 500 nm and the characteristic linear emission of the 4f–4f transition of Eu3+ ions at 594, 613, 634 and 711 nm (corresponding to the transitions of 5D0 → 7FJ (J = 1–4)).30 The PLE spectrum is obtained by monitoring the 5D0 → 7F2 characteristic emission of Eu3+ ions at 613 nm, which contains a charge transfer band (CTB) from 200 to 350 nm and two characteristic excitation peaks of Eu3+ from 350 to 500 nm. The maximum value of the CTB is 310 nm which can be attributed to the CT transition (V5+ → O2−) of [VO4]3− groups. The sharp peaks around 393 and 464 nm are attributed to the 7F0 → 5L6 and 7F0 → 5D2 transitions of the trivalent Eu3+ dopant. The intensity of CTB at 310 nm is obviously higher than those of 7F0 → 5L6 and 7F0 → 5D2 transitions of Eu3+ at 393 and 464 nm. It can be inferred that there must be an effective energy transfer between [VO4]3− groups and Eu3+ ions. The simplified energy transfer process between [VO4]3− and Eu3+ ions is shown in Fig. 4. Under the 310 nm UV excitation, the [VO4]3− groups are excited through the V5+ → O2− CTB, when Eu3+ ions were introduced into the system, efficient energy transfer from [VO4]3− groups to the Eu3+ excited states 5D0, eventually resulting in radiative transitions of 5D0 → 7FJ (J = 1–4). It can also be noted from Fig. 3(b) that the dominant emission peak of Eu3+ is at 613 nm due to the 5D0 → 7F2 transition, indicating that Eu3+ ions in LCZV host are located in a non-inversion symmetry position according to the Judd–Ofelt theory.31 This result agrees well with the conclusion that Eu3+ takes on the Ca2+ sites (without inversion symmetry) in LCZV crystal structure.
A series of LCZV:xEu3+ (x = 0–0.155) samples were synthesized to further examine the effect of Eu3+ doping concentration on the PL properties of the phosphors. As shown in Fig. 5, under excitation at 310 nm, the characteristic emission peaks of all samples are similar, and the PL emission intensity changes significantly with the increase of the Eu3+ doping amount. The inset of Fig. 5 shows the relative PL intensity of the LCZV:xEu3+ (x = 0–0.155) samples as a function of Eu3+ concentration. When the concentration of Eu3+ ion is lower than 0.095, with the increase of Eu3+ ion concentration, the self-activated emission around 500 nm shows a decrease in intensity, while the Eu3+-related emission shows an increase, which confirms the conclusion that there is an effective energy transfer from [VO4]3− groups to Eu3+ ions. It is worth noting that the intensity of the self-activated emission first shows a rapid decrease and then turns to a slow decrease, with the inflection point around 0.02, at which the most obvious lattice distortion occurs according to Fig. 1(c). It can be inferred that Eu3+ ions would not only transfer the energy absorbed by [VO4]3− groups, but also the lattice contraction caused by Eu3+ ions weaken the self-activated luminescence of [VO4]3− groups.
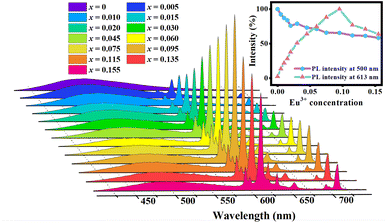 | ||
| Fig. 5 The emission spectra of LCZV:xEu3+(x = 0–0.155) under 310 nm excitation. The inset depicts the PL relative intensities at 500 nm and 613 nm as a function of Eu3+ concentration. | ||
As the concentration of Eu3+ ions exceeds 0.095, the Eu3+-related emission does not increase but decreases. According to the previous literature,32 the concentration quenching occurs from the non-radiative energy migration (short-range exchange interactions or long-range multipolar interactions) among the luminescence activators. Blasse pointed out that when the critical transfer distance (Rc) between Eu3+ is less than or equal to 5 Å, the concentration quenching phenomenon is attributed to exchange interaction; otherwise, it is attributed to multipolar interactions. The value of Rc can be calculated by the following formula:33
 | (3) |
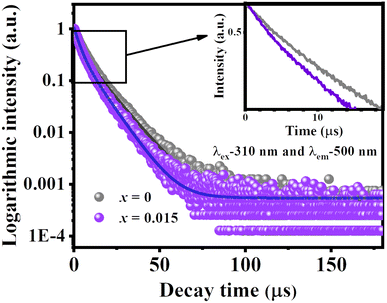
Fig. 6 shows the room temperature luminescence decay curves of [VO4]3− groups at 500 nm for LCZV and LCZV:0.015Eu3+ samples, respectively. The fluorescence decay curves of [VO4]3− fit well with the bi-exponential fitting eqn (4):34,35
I(t) = I0 + A1![[thin space (1/6-em)]](https://www.rsc.org/images/entities/char_2009.gif) exp(−t/τ1) + A2 exp(−t/τ1) + A2![[thin space (1/6-em)]](https://www.rsc.org/images/entities/char_2009.gif) exp(−t/τ2) exp(−t/τ2)
| (4) |
| τaνg = (A1τ12 + A2τ22)/(A1τ1 + A2τ2) | (5) |
The calculated fluorescence decay parameters of the LCZV:xEu3+ (x = 0, 0.015) samples are listed in Table 3. As shown in Table 3, the average fluorescence lifetime of the self-activated emission is shortened after doping with Eu3+ ions. By discussing the parameters of the fast decay mechanism (τ1, A1) and the slow decay mechanism (τ2, A2) in detail, it can be found that after Eu3+ doping, both the decay times of the fast component (τ1) and the slow component (τ2) are shortened, and the weight of the fast component (A1) is relatively increased while the weight of the slow component (A2) is relatively decreased. We mainly attribute the shortening of the decay time of the two components to the reduction of the radiative transition probability of the [VO4]3− groups caused by the energy transfer to Eu3+; while the change in the weight of the two components is attributed to the variation of the ratio between the two transition mechanisms (3T1 → 1A1, 3T2 → 1A1) due to the lattice distortion caused by Eu3+ doping. Comparing the changes in the decay time and the weight of the two components, it can be judged that the effect of Eu3+ ions doping on lattice distortion is smaller than that of energy transfer.
| Sample (x) | A1 | τ1 (μs) | A2 | τ2 (μs) | χ2 | τavg (μs) |
|---|---|---|---|---|---|---|
| 0 | 5.39 | 4.55 | 2.65 | 12.17 | 1.205 | 8.93 |
| 0.015 | 5.45 | 3.68 | 2.05 | 10.68 | 1.069 | 7.33 |
Fig. 7 and Table S3† show the CIE chromaticity coordinates of LCZV:xEu3+ (x = 0–0.155) samples. Fig. S3† shows the variation of the chromaticity coordinates x and y with the Eu3+ doping concentration. Obviously, with the increase of Eu3+ concentration, the chromaticity gradually transitions from bluish-green (0.2039, 0.2421) to white (0.2739, 0.3145) and then to orange-red (0.3634, 0.4014). Color tunable phosphors were thus obtained by changing the doping concentration of Eu3+ in LCZV:xEu3+ (x = 0–0.155) samples. In particular, white emissions were achieved when the value of x was set as 0.015. The packaged multicolor LED devices were displayed in the inset of Fig. 7. The calculated correlation color temperature (CCT) values are listed in Table S3.† For the white-emitting LCZV:0.015Eu3+ phosphor, CCT is about 7683 K. Generally speaking, we obtained a series of color tunable phosphors by doping Eu3+ ions into the self-activating luminescent LCZV host, and white light was achieved when the Eu3+ doping concentration was 0.015 and the multicolor LED devices were fabricated with multicolor luminescent effect.
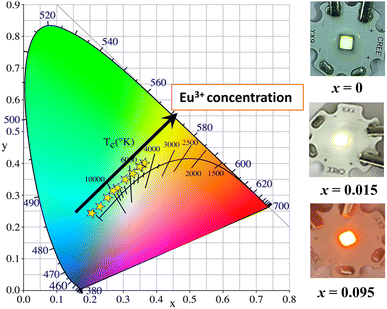 | ||
| Fig. 7 CIE chromaticity coordinates of LCZV:xEu3+ (x = 0–0.155) (left) and the LED device of samples irradiated with a 310 nm UV lamp (right). | ||
Temperature-dependent PL properties
Fig. 8 depicts the temperature-dependent PL spectra of LCZV:0.015Eu3+ under 310 nm light excitation. It can be found that the positions and shapes of characteristic emission peaks of samples at different temperatures from 293 K to 473 K are similar, and the PL emission intensity decreases with the increase in temperature. The inset in Fig. 8 describes the relative PL intensity curve with temperature. It can be seen that under ultraviolet excitation at 310 nm, the emission intensity of [VO4]3− groups at 500 nm decreased sharply to 4.9% of the initial value with increasing temperature; while the emission intensity of Eu3+ ions at 613 nm only drops to 62.1% of its initial value. As shown in the inset of Fig. 8, the luminescence intensity of [VO4]3− groups is more sensitive to temperature than that of Eu3+.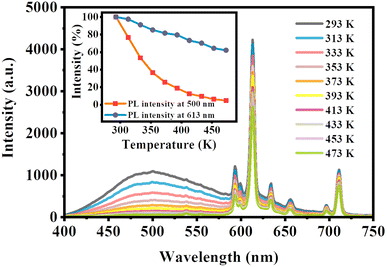 | ||
| Fig. 8 The temperature-dependent PL spectra of LCZV:0.015Eu3+. The inset depicts the temperature-dependent PL relative intensities at 500 nm and 613 nm. | ||
The thermal-quenching of [VO4]3− groups and Eu3+ ions in LCZV:0.015Eu3+ phosphor can be explained by the schematic configuration coordinate diagram shown in Fig. 9.6,37 In general, under the excitation of 310 nm light, the energy absorbed by the [VO4]3− groups emitted broadband cyan light through the CT transition between excited states 3T1,2 and ground state 1A1. In the presence of Eu3+ ions, the energy transfer occurs from the excited [VO4]3− groups to Eu3+ ions. The outer electrons of Eu3+ are first excited to the high-level state 5L6, then relaxed to the 5D0 level through a non-radiative transition, and finally return to the 7FJ ground state, with the emission of the characteristic Eu3+-related spectrum. As the temperature increases, the excited electrons of [VO4]3− groups absorb additional vibrational energy and cross the barrier ΔE1 to the intersection of 3T1,2 and 1A1 states, and rapidly relax to ground state 1A1 by non-radiative transition. Meanwhile, part of electrons at the 5D0 level of Eu3+ absorbed energy, surmounted the activation energy barrier ΔE2 by phonon-electron coupling38,39 to the intersection of 5D0 and 7F6, and finally back to the ground state through non-radiative transition.32,37,40 In summary, as the temperature increases, the thermal vibration of the matrix lattice is enhanced, and the phonons in the crystal increase, leading to the enhanced probability of the multiphonon relaxation process. The interaction between electrons and phonons is thus enhanced, resulting in the thermal quenching.41,42
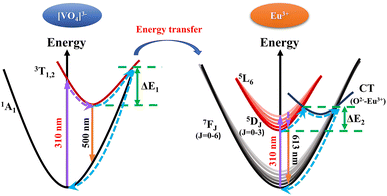 | ||
| Fig. 9 Schematic configuration coordinate diagram for thermal-quenching of [VO4]3− groups and Eu3+ ions in LCZV host. | ||
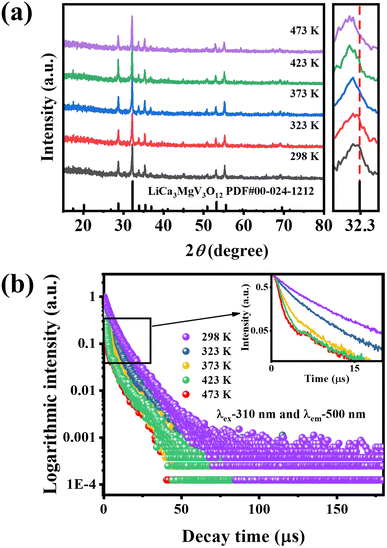
To further study the thermal quenching process of the self-activated luminescence from [VO4]3− groups, we conducted the temperature-dependent XRD patterns and the PL decay lifetimes as a function of temperature. Fig. 10(a) shows the XRD patterns of LCZV:0.015Eu3+ at different temperatures (298–473 K). It can be found that pure host phase remains at different temperatures, indicating that the crystal structure of the sample has good thermal stability from room temperature to 473 K. However, an enlarged XRD pattern at 2θ = 32–32.5° indicates that the diffraction peaks of the samples shift to lower angles with the increase of temperature, which means that the LCZV:0.015Eu3+ sample has positive thermal expansion properties.
Fig. 10(b) shows the PL decay curves of the LCZV:0.015Eu3+ sample at different temperatures (298–473 K), measured with the excitation wavelength of 310 nm and the emission wavelength of 500 nm. It can be seen that the lifetime of the self-activated PL shortens with increasing temperature. The average decay times τavg of [VO4]3− groups at different temperatures are calculated according to eqn (5) and shown in Table 4. From Table 4, a shortening trend is observed with increasing temperature, both for the fast decay mechanism (τ1) and the slow decay mechanism (τ2), due to the thermal quenching effect shown in Fig. 9. At the same time, we also found that with the increase in temperature, the proportion of the fast decay mechanism (A1) is gradually increasing while the proportion of slow decay mechanisms (A2) is gradually decreasing. This change of the fluorescence decay mechanism may be attributed to the lattice-expansion caused by heating (as described in Fig. 10(a)).
| T (K) | A1 | τ1 (μs) | A2 | τ2 (μs) | χ2 | τavg (μs) |
|---|---|---|---|---|---|---|
| 298 | 5.45 | 3.68 | 2.05 | 10.68 | 1.205 | 7.33 |
| 323 | 5.69 | 2.81 | 1.13 | 9.49 | 1.069 | 5.49 |
| 373 | 9.04 | 1.39 | 0.72 | 8.46 | 1.052 | 3.70 |
| 423 | 9.17 | 1.23 | 0.42 | 7.35 | 1.022 | 2.55 |
| 473 | 10.15 | 1.18 | 0.25 | 6.26 | 1.014 | 1.77 |
The activation energy ΔE of thermal quenching process was calculated by using the Arrhenius equation:35,37,43
 | (6) |
The variation of the relative intensity of the two emissions (around 500 nm and 613 nm) results in a change of the emitting light color with temperature. As displayed by the CIE chromaticity diagrams in Fig. 11, the luminescence color of LCZV:0.015Eu3+ sample gradually changes from white to orange-red as the ambient temperature increases from 293 K to 473 K. As shown in Fig. S5,† CIE x and CIE y of the sample exhibit a linear increasing trend with the rising temperature. All of these results demonstrate that the LCZV:0.015Eu3+ phosphor has potential to be used as a luminescent temperature sensor, which is a device that can determine the real-time temperature through the luminescent color.
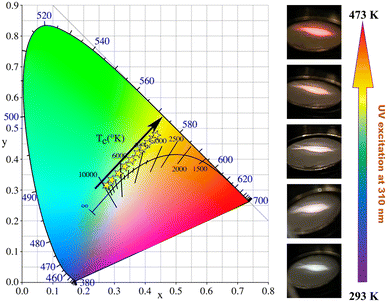 | ||
| Fig. 11 The CIE chromaticity diagrams of LCZV:0.015Eu3+ at different temperatures (left) and the luminescent images under 310 nm excitation (right). | ||
In order to evaluate the performance of the sample as a fluorescent temperature sensor, it is necessary to characterize the following parameters, fluorescence intensity ratio (FIR), absolute sensitivity (Sa) and relative sensitivity (Sr). The temperature-dependent FIR values can be obtained by fitting the experimental data according to the following eqn (7):29
 | (7) |
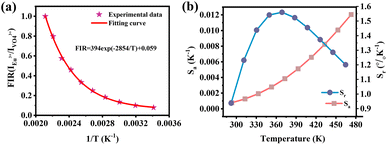 | ||
| Fig. 12 (a) FIR values monitored at different temperatures of LCZV:0.015Eu3+. (b) Sa and Sr values monitored at different temperatures of LCZV:0.015Eu3+. | ||
The temperature sensitivity of the LCZV:0.015Eu3+ sample was investigated by the absolute sensitivity (Sa) and relative sensitivity (Sr), which can be calculated through the following equations:44
 | (8) |
 | (9) |
Conclusions
Eu3+ ions were introduced into the lattice of LCZV to study the interaction of the self-activated and dopant-related luminescence. The lattice distortion caused by Eu3+ was evaluated in terms of bond lengths and bond angles, which corresponded to the decrease of self-activated fluorescence intensity. Both the self-activated and Eu3+-related emissions were detected, attributed to the effective energy transfer from [VO4]3− groups to Eu3+ ions. The difference of the thermal stability of the two emissions led to suitable temperature sensing characteristics. Based on the above results, the following products can be developed: color-tunable phosphors, a white light emitting LED, and a luminescent temperature sensor for non-contact test system.Conflicts of interest
There are no conflicts to declare.Acknowledgements
This work was supported in part by the projects from National Natural Science Foundation of China (51302106, 51501071, 21071061) and Outstanding Young Scientists Foundation Grant of Shandong Province (BS2010CL004).References
- J. Yang, P. He, Y. Xie, Q. Chen, Q. Dong, W. Nie, F. Yang, W. Wang, F. Du, J. Peng and X. Ye, J. Alloys Compd., 2022, 903, 163815 CrossRef CAS
.
- M. Xu, C. Fan, C. Yang, K. Song, F. Hussain, W. Sheng, J. Wu, H. Wang, W. Su, Q. Huang and S. Sun, J. Lumin., 2021, 237, 118197 CrossRef CAS
.
- T. Nakajima, M. Isobe, T. Tsuchiya, Y. Ueda and T. Kumagai, J. Lumin., 2009, 129, 1598–1601 CrossRef CAS
.
- M. K. Mahata, K. Kumar and V. K. Rai, Sens. Actuators, B, 2015, 209, 775–780 CrossRef CAS
.
- T. Nakajima, M. Isobe, T. Tsuchiya, Y. Ueda and T. Manabe, J. Phys. Chem. C, 2010, 114, 5160–5167 CrossRef CAS
.
- F. Kang, Y. Du, P. Boutinaud, G. Sun, X. Wang, J. Lu and S. Xiao, Adv. Mater., 2020, 1, 2467–2482 RSC
.
- L. Li, X. G. Liu, H. M. Noh and J. H. Jeong, J. Solid State Chem., 2015, 221, 95–101 CrossRef CAS
.
- H. Zhou, N. Guo, X. Lü, Y. Ding, L. Wang, R. Ouyang and B. Shao, J. Lumin., 2020, 217, 116758 CrossRef CAS
.
- M. Y. Espinosa-Cerón, A. N. Meza-Rocha, S. Carmona-Téllez, C. Chacón, O. Soriano-Romero and R. Lozada-Morales, J. Lumin., 2021, 238, 118239 CrossRef
.
- X. Huang and H. Guo, Ceram. Int., 2018, 44, 10340–10344 CrossRef CAS
.
- Y. Matsushima, T. Koide, M. Hiro-Oka, M. Shida, A. Sato, S. Sugiyama, M. Ito and J. McKittrick, J. Am. Ceram. Soc., 2015, 98, 1236–1244 CrossRef CAS
.
- T. Hasegawa, Y. Abe, A. Koizumi, T. Ueda, K. Toda and M. Sato, Inorg. Chem., 2018, 57, 857–866 CrossRef CAS PubMed
.
- H. Zhou, W. Sun, X. Liu, K. Wang, H. Ruan and X. Chen, Ceram. Int., 2019, 45, 2629–2634 CrossRef CAS
.
- X. Huang and H. Guo, RSC Adv., 2018, 8, 17132–17138 RSC
.
- X. Chen, Z. Xia, M. Yi, X. Wu and H. Xin, J. Phys. Chem. Solids, 2013, 74, 1439–1443 CrossRef CAS
.
- D. Pasinski and J. Sokolnicki, Materials, 2020, 13, 2996 CrossRef CAS PubMed
.
- L. K. Bharat, S. K. Jeon, K. G. Krishna and J. S. Yu, Sci. Rep., 2017, 7, 42348 CrossRef CAS PubMed
.
- X. Huang, S. Wang, S. Rtimi and B. Devakumar, J. Photochem. Photobiol., A, 2020, 401, 112765 CrossRef CAS
.
- R. Cao, X. Wang, Y. Jiao, X. Ouyang, S. Guo, P. Liu, H. Ao and C. Cao, J. Lumin., 2019, 212, 23–28 CrossRef CAS
.
- L. K. Bharat, K. G. Krishna and J. S. Yu, J. Alloys Compd., 2017, 699, 756–762 CrossRef CAS
.
- A. K. Kunti, L. Ghosh, S. K. Sharma and H. C. Swart, J. Lumin., 2019, 214, 116530 CrossRef CAS
.
- T. Jeyakumaran, N. Venkatesh Bharathi, R. Shanmugavel, P. Sriramachandran and S. Ramaswamy, J. Inorg. Organomet. Polym. Mater., 2020, 31, 695–703 CrossRef
.
- S. Ekambaram, K. C. Patil and M. Maaza, J. Alloys Compd., 2005, 393, 81–92 CrossRef CAS
.
- S. S. Pitale, M. Gohain, I. M. Nagpure, O. M. Ntwaeaborwa, B. C. B. Bezuidenhoudt and H. C. Swart, Phys. B, 2012, 407, 1485–1488 CrossRef CAS
.
- P. Sharma, P. Singh and Kamni, Phys. B, 2021, 602, 412500 CrossRef CAS
.
- N. Zhang, J. Li, J. Wang, R. Shi, L. Chen, A. Zhang and P. Yang, RSC Adv., 2019, 9, 30045–30051 RSC
.
- H. Chen, J. Zhou, H. Zhang and Z. Hu, Opt. Mater., 2019, 89, 132–137 CrossRef CAS
.
- Y. Lv, K. Liu, J.-W. Shi, Z. Li, J. Li, X. Ji, D. Ma, Y. Zou, Y. Cheng and C. Niu, J. Lumin., 2021, 234, 117948 CrossRef CAS
.
- H. Zhou, N. Guo, Q. Liang, Y. Ding, Y. Pan, Y. Song, R. Ouyang, Y. Miao and B. Shao, Ceram. Int., 2019, 45, 16651–16657 CrossRef CAS
.
- X. Zhang, Z. Zhu, Z. Sun, Z. Guo and J. Zhang, J. Lumin., 2018, 203, 735–740 CrossRef CAS
.
- N. Z. Khan, S. A. Khan, L. Zhan, A. Jalil, J. Ahmed, M. A. M. Khan, M. T. Abbas, F. Wang and X. Xu, J. Alloys Compd., 2021, 868, 159257 CrossRef CAS
.
- P. Dang, G. Li, X. Yun, Q. Zhang, D. Liu, H. Lian, M. Shang and J. Lin, Light: Sci. Appl., 2021, 10, 29 CrossRef CAS PubMed
.
- P. Du and J. S. Yu, Chem. Eng. J., 2017, 327, 109–119 CrossRef CAS
.
- J. Zhou, X. Huang, J. You, B. Wang, H. Chen and Q. Wu, Ceram. Int., 2019, 45, 13832–13837 CrossRef CAS
.
- P. Du and J. S. Yu, Dyes Pigm., 2017, 147, 16–23 CrossRef CAS
.
- P. Srilakshmi, A. U. Maheswari, V. Sajeev and M. Sivakumar, Mater. Today: Proc., 2019, 18, 1375–1379 CAS
.
- X. Huo, Z. Wang, C. Tao, N. Zhang, D. Wang, J. Zhao, Z. Yang and P. Li, J. Alloys Compd., 2022, 902, 163823 CrossRef CAS
.
- Z. Lei, S. Jiang, X. Wang, Y. Li, Y. Wang, J. Xie, F. Ling, Y. Wang, G. Xiang, L. Li and X. Zhou, Ceram. Int., 2022, 48, 30005–30011 CrossRef
.
- J. Fu, L. Zhou, Y. Chen, J. Lin, R. Ye, D. Deng, L. Chen and S. Xu, J. Alloys Compd., 2022, 897, 163034 CrossRef CAS
.
- L. Zhou, W. Wang, D. Xu, Z. Wang, Z. Yi, M. Wang and Z. Lu, Ceram. Int., 2021, 47, 34820–34827 CrossRef CAS
.
- C. Wang, Y. Jin, R. Zhang, Q. Yao and Y. Hu, J. Alloys Compd., 2022, 894, 162494 CrossRef CAS
.
- Y.-C. Lin, M. Bettinelli and M. Karlsson, Chem. Mater., 2019, 31, 3851–3862 CrossRef CAS
.
- H. Guo, B. Devakumar, R. Vijayakumar, P. Du and X. Huang, RSC Adv., 2018, 8, 33403–33413 RSC
.
- F. Liu, D. Deng, M. Wu, B. Chen, L. Zhou and S. Xu, J. Rare Earths, 2021, 39, 261–268 CrossRef CAS
.
Footnote |
| † Electronic supplementary information (ESI) available. See DOI: https://doi.org/10.1039/d2ra06647e |
| This journal is © The Royal Society of Chemistry 2022 |

