 Open Access Article
Structural, electrical, and dielectric study of the influence of 3.4% lanthanide (Ln3+ = Sm3+ and La3+) insertion in the A-site of perovskite Ba0.95Ln0.034Ti0.99Zr0.01O3†
El Hassan Yahakoub *,
Amine Bendahhou
 ,
Karim Chourti
 ,
Fatima Chaou,
Ilyas Jalafi,
Soufian El Barkany,
Zahra Bahari and
Mohamed Abou-salama
Department of Chemistry, Laboratory of Molecular Chemistry, Materials and Environment, Faculty Multidisciplinary Nador, University Mohamed Premier, B.P. 300, Selouane, Nador 62700, Morocco. E-mail: elhassan.yahakoub@ump.ac.ma
First published on 18th November 2022
Abstract
This paper presents a systematic study of the substitution effect by lanthanides (Ln3+ = Sm3+ and La3+) in the A-site of perovskite Ba(1−x)Ln2x/3(Ti0.99Zr0.01)O3 with a substitution rate equal to 3.4%. All samples were synthesized by the classical solid-state reaction route and characterized by X-ray diffraction and a complex impedance spectroscopy technique. The synthesized compounds exhibit single-phase perovskite structures without detectable secondary phases. The P4mm space group was verified by the Rietveld method from the X-ray diffraction data, with the tetragonal distortion decreasing with the increasing ionic radius of the lanthanides. SEM micrographs of all ceramics revealed high densification, low porosity and homogeneous distribution of grains of different sizes over the entire surface. The dielectric properties of non-doped and Sm3+ and La3+ doped Ba(1−x)Ln2x/3(Ti0.99Zr0.01)O3 compound are studied in the temperature range of 40–250 °C. The dielectric permittivity ε′ increases and the ferroelectric–paraelectric phase transition temperature decreases when the lanthanides are inserted into the A-site of Ba(1−x)Ln2x/3(Ti0.99Zr0.01)O3 perovskite. The Nyquist plots indicate a non-Debye type relaxation process. Conductivity and electrical modulus plots as a function of frequency (10 to 106 Hz) include two electrical responses corresponding to grain and grain boundary effects for all ceramics studied.
1. Introduction
Dielectric materials with high dielectric constant (ε′) and low dielectric loss (tan![[thin space (1/6-em)]](https://www.rsc.org/images/entities/char_2009.gif) δ) are in high demand for a wide range of applications in various fields such as frequency filters, resonators, antennas and duplexers, multilayer ceramic capacitors (MLCC), sensors, resistive switching and biomedicine.1–5 Among these typical ferroelectric materials, lead zirconate titanate (PZT) is a material that has been widely applied to electronic devices due to its excellent electrical properties. However, the toxic aspects of lead metal absorption into the human body can cause fatal poisoning.6 As a result, the European Union (EU) has adopted several regulations.7,8 Due to its high volatility and toxicity, lead-based electro-ceramic materials need to be replaced with new environmentally friendly smart materials.9 Among the lead-free materials studied, barium titanate BaTiO3 (BT) has attracted much attention because of its environmental friendliness. It also has very good dielectric (e.g., high dielectric constant and low loss factor), ferroelectric, piezoelectric, and pyroelectric behavior.10
δ) are in high demand for a wide range of applications in various fields such as frequency filters, resonators, antennas and duplexers, multilayer ceramic capacitors (MLCC), sensors, resistive switching and biomedicine.1–5 Among these typical ferroelectric materials, lead zirconate titanate (PZT) is a material that has been widely applied to electronic devices due to its excellent electrical properties. However, the toxic aspects of lead metal absorption into the human body can cause fatal poisoning.6 As a result, the European Union (EU) has adopted several regulations.7,8 Due to its high volatility and toxicity, lead-based electro-ceramic materials need to be replaced with new environmentally friendly smart materials.9 Among the lead-free materials studied, barium titanate BaTiO3 (BT) has attracted much attention because of its environmental friendliness. It also has very good dielectric (e.g., high dielectric constant and low loss factor), ferroelectric, piezoelectric, and pyroelectric behavior.10
Barium titanate is an interesting system is which considered one of the best known ferroelectrics and dielectrics with a perovskite structure due to its high maximum polarization (Pmax) high remanent polarization (Pr), high Curie temperature (TC = 120 °C), high dielectric constant (103 ≤ ε′ ≤ 3.3 × 10³) and low dielectric loss (tan![[thin space (1/6-em)]](https://www.rsc.org/images/entities/char_2009.gif) δ).11,12 BaTiO3 shows three phase transitions: cubic to tetragonal (TC–T), tetragonal to orthorhombic (TT–O), orthorhombic to rhombohedral (TO–R),13,14 at lower temperature TC this compound shows a polar structure and a tetragonal symmetry (space group P4mm), which leads to the formation of the normal ferroelectric state.14 On the other hand by the development of capacitor industry, the (MLCC) need some important improvements such as high permittivity, low dielectric loss and high temperature stability. Some studies have already been conducted to improve the dielectric properties of BaTiO3 ceramics by replacing the A-site (Ba2+) and B-site (Ti4+) in the BaTiO3 structure.15–18 It is found that the presence of transition elements in BaTiO3 ceramics stabilizes the perovskite structure and remarkably reduces the dielectric loss.9,19,20 While Jian-Hua Li et al.21 proposed adding transition elements to solve the unsolved problem of the stability of BaTiO3 ceramics at high temperature.
δ).11,12 BaTiO3 shows three phase transitions: cubic to tetragonal (TC–T), tetragonal to orthorhombic (TT–O), orthorhombic to rhombohedral (TO–R),13,14 at lower temperature TC this compound shows a polar structure and a tetragonal symmetry (space group P4mm), which leads to the formation of the normal ferroelectric state.14 On the other hand by the development of capacitor industry, the (MLCC) need some important improvements such as high permittivity, low dielectric loss and high temperature stability. Some studies have already been conducted to improve the dielectric properties of BaTiO3 ceramics by replacing the A-site (Ba2+) and B-site (Ti4+) in the BaTiO3 structure.15–18 It is found that the presence of transition elements in BaTiO3 ceramics stabilizes the perovskite structure and remarkably reduces the dielectric loss.9,19,20 While Jian-Hua Li et al.21 proposed adding transition elements to solve the unsolved problem of the stability of BaTiO3 ceramics at high temperature.
To date, considerable research has been conducted on BaZrxTi(1–x)O3 (BZT) solid solutions with perovskite structure due to their high dielectric properties. Their high dielectric permittivity and medium breakdown voltage demonstrate their potential applications in ceramic capacitors.22,23 In general, the properties of these materials are mainly associated with significant variations in electrical and structural properties, produced by the partial replacement of Ti4+ by Zr4+ in the BZT matrix.24 In BZT ceramics, Zr4+ ion is chemically more stable than Ti4+ ion and has an ionic radius (RZr4+ = 0.72 Å, CN = 6) larger than the ionic radius of Ti4+ (RTi4+ = 0.605 Å, CN = 6) which leads to a perovskite lattice expansion.25 Following research by Cristina Ciomaga, who found a categorization of (BZT) dielectrics based on the variation of concentration (x) of Zr in BaTiO3,25 BZT ceramics presented a normal ferroelectric behavior for x ≤ 0.10, and for 0.10 ≤ x ≤ 0.42, they acted as relaxing ferroelectrics while for x ≥ 0.42, the material eventually became anti-ferroelectric.26 It has been reported that Zr4+ can replace the Ti4+ ion in the B-site of the ABO3 perovskite structure, accompanied by a shift in TC to a lower temperature.27 Since BaZrO3 is a non-ferroelectric material,28 the substitution of Ti4+ ion by Zr4+ ion would disrupt the long-range polarization order and weaken the ferroelectricity in BT, resulting in a decrease in TC.27 Recently, new emerging applications of BZT-based compounds, such as electrocaloric cooling systems or energy storage capacitors, have been widely published.29–35
Doping in BZT ceramics has become a popular way to improve the performance of these compounds. The dopant introduced into BZT plays a crucial role in compensating for defects created in the perovskite structure. The dopant can be either an acceptor or a donor and thus needs oxygen vacancies or holes and electrons or barium vacancies, respectively, to compensate for the defects.36–38 in this framework, many researchers have been interested in lanthanides doped BZT which has very good dielectric and electrical properties.39,40 Lanthanides ions (Ln3+), because of their intermediate ionic radii and their ability to replace the atoms of the A and B sites in the perovskite structure, are widely used to improve the dielectric, electrical and optical properties of the BZT system.36,41–50 Thus, some important microstructure and dielectric response features were observed. For example, the phase transition temperature is significantly reduced by the addition of rare earth ions and this decrease in phase transition temperature is related to the increase in ionic radii of lanthanides,51,52 in particular, the ferroelectric–paraelectric phase transition and in order to maintain the ferroelectricity of the lanthanide-doped BZT at room temperature, the value of x and y should not exceed 0.1 in the compound Ba(1–x)Ln2x/3(Ti(1–y)Zry)O3 as mentioned by several authors in the literature.14,50,52,53 The ionic radii of these trivalent elements are between 0.8 and 1.3 Å, which is intermediate between the ionic radii of Ba2+ and Ti4+/Zr4+ ions. Based on the ionic radii, these ions can substitute for atoms in the A site (Ba1–xLn2x/3TiO3) or the B site (BaTi1−xLnxO3−x/2). However, intermediate ions can be substituted at the A and B sites in equal amounts (self-compensation, Ba1−xLnxTi1−yLnyO3).54
In this paper, we chose BaTi0.99Zr0.01O3 (BZT) as the base material because BaTi(1−x)ZrxO3 ceramics exhibited normal ferroelectric behavior for x ≤ 0.10 as we motioned before and we doped with a lanthanide (Ln3+ = Sm3+ and La3+) ratio of 3.4% in this basic structure (BZT) to ensure that our materials remain ferroelectric normal and study the impact of these dopants on the structural, dielectric and electrical properties of these composites to understand the relationships between structural and dielectric properties. The choice of these trivalent lanthanides (Ln3+ = Sm3+ and La3+) is justified by their particular electronic configuration which can lead to specific behaviors. Indeed, trivalent Ln3+ ions behave as a donor by replacing Ba2+ ions in BZT compounds, which leads to a charge imbalance, which favors the improvement of BZT ceramics properties.
2. Experimental procedure
2.1. Materials and methods
The Ceramics of compositions BaTi0.99Zr0.01O3, Ba0.95Sm0.034Ti0.99Zr0.01O3 and Ba0.95La0.034Ti0.99Zr0.01O3 (denoted as BZT, BSmZT and BLaZT, respectively) were synthesized by a conventional solid state route. The starting materials were BaCO3 (Sigma-Aldrich 99.9%), La2O3 (Sigma-Aldrich 99.9%), Sm2O3 (Sigma-Aldrich 99.9%), ZrO2 (Sigma-Aldrich 99%) and TiO2 (Sigma-Aldrich 99%). The lanthanide oxides (Sm2O3 and La2O3) were heated at 850 °C for 2 h before weighing. The starting materials were weighed in stoichiometric amounts according to the reaction below and mixed by ball milling in ethanol for 2 hours using zirconia balls. The mixed powders were dried at 80 °C, homogenized in an agate mortar for 30 minutes and calcined at 1200 °C for 6 hours.| (0.95)BaCO3 + 0.017Ln2O3 + 0.01TiO2 + 0.99ZrO2 → (Ba99Ln0.034)(Zr0.99Ti0.01)O3 + 0.95CO2 |
The obtained powders were ground and mixed with an organic binder of polyvinyl alcohol (PVA). Then, cylindrical pellets were obtained by pressing at 20 kN (12 mm diameter, 2 mm thickness). The sintering of the obtained pellets was carried out at 1300 °C for 6 hours in air. The temperature was raised to 700 °C at a rate of 10 °C min−1, followed by a one-hour plateau at this temperature, and then raised to the sintering temperature at a rate of 5 °C min−1. Finally, a natural cooling process of the samples was performed to room temperature.
2.2. Characterization
Crystal structure identification of BZT, BSmZT and BLaZT powders were performed by X-ray diffraction (XRD) using an Inel Equinox 2000 CuKα radiation (λ = 1.54056 Å) at room temperature (293 K, 0.031° step, 10–110° 2θ range, scanning speed of 1° min−1). Lattice parameters, atomic positions, occupancy, and thermal agitation factor were renamed by the Rietveld method using Jana 2006 software.55 The sintered pellet was polished with emery paper to make the two surfaces parallel and then annealed at 300 °C for 30 minutes. The microstructure of the synthesized ceramic was checked by scanning electron microscopy (SEM) (TESCAN VEGA III LM), with an accelerating voltage of 10 kV. The average grain size of the ceramic sample was estimated using Image J software. Prior to electrical measurements, the sintered ceramic was painted with a silver paste and annealed for 30 minutes at 300 °C to adhere the silver to the sample, then cooled to room temperature prior to any measurements. The silver-coated disk-shaped pellet behaves as a parallel plate capacitor that is used for various dielectric and electrical measurements using a BioLogic impedance analyzer (MTZ-35) over the frequency range of 10 Hz to 1 MHz with an AC voltage of 1 V amplitude, with both the furnace and the sample being subjected to the impedance test.3. Results and discussion
3.1. X-ray diffraction and Rietveld refinement analysis
After the synthesis of BZT, BSmZT and BLaZT compositions, the crystal structure was evaluated by DRX analysis. X-ray diffraction spectra of BZT, BSmZT and BLaZT powders recorded at room temperature in the 2θ range varying between 10 and 100° are shown in Fig. 1(a). The most intense DRX peaks observed around 32° in each sample, attributed to the (110) plane, suggest the presence of the perovskite phase in all the prepared compositions, the purity and the tetragonal crystal structure of the obtained ceramics were confirmed using JCPDS no. 05-0626. The Bragg peaks can be fully indexed to the tetragonal structure of the Ba0.95Sr0.05TiO3 phase with the elemental lattice parameters a = 3.989 Å and c = 4.026 Å.56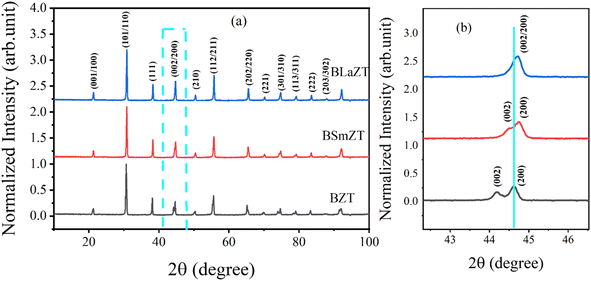 | ||
| Fig. 1 (a) XRD diffractograms of BZT, BSmZT and BLaZT powders calcined at 1200 °C, (b) the magnification of (a) in the range 44° to 45°. | ||
To study the impact of different lanthanide doping on the crystal structure, the (002) and (200) diffraction peaks located between 44° and 45° have been enlarged and presented in Fig. 1(b). It can be seen that the insertion of lanthanides (Sm3+ and La3+) in the BZT structure leads to the convergence of the diffraction peak (002) and (200).57 On the other hand, it was very clear that the diffraction peaks tend to shift to high 2θ values, according to Bragg's law [2dhkl × sin(θ) = nλ], this shift indicates that the volume of the elemental lattice decreases when the lanthanides are inserted in the A-site of the perovskite structure, the reduction of the volume of the lattice is due to the difference in ionic radius between Ba2+ and Ln3+ in the A-site and it can also be clearly seen that the diffraction peak shift of the BSmZT phase is larger than that of the BLaZT phase, indicating that the lattice volume of the BSmZT compound is slightly smaller than that of the BLaZT phase. This shift can be justified by the deference of the effective ionic radii for the coordination of lanthanide 12 (RSm3+ = 1.24 Å and RLa3+ = 1.36 Å) and barium (RBa2+ = 1.61 Å) according to Shannon 56.58
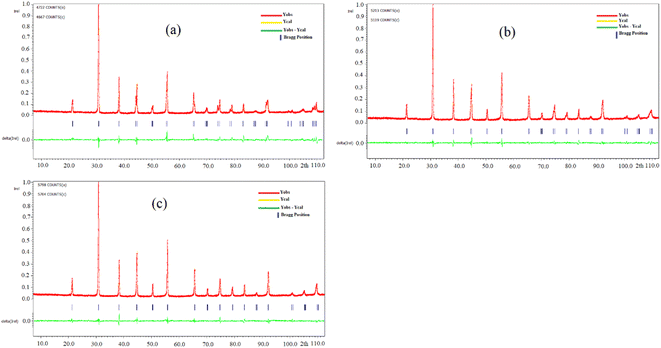
Structural refinements of the XRD spectra of the prepared materials were performed by the Rietveld method with Jana 2006 software to obtain more information about the structural parameters of the synthesized materials, this method allows the determination of several parameters related to the structure refinement such as space group, mesh parameters (a, b, c), density, profile half-width parameters (u, v, w), reliability factors (Rp, Rwp, Rexp, and GOF), Wyckoff, thermal agitation factor (Uiso), and site occupation. The observed experimental profiles of lanthanide-doped BZT and BZT ceramics were refined by a theoretical profile related to JCPDS number 05-0626. Fig. 2 shows typical Rietveld refinements of XRD data recorded at room temperature for compounds synthesized at 1200 °C. Good agreement is observed between the experimental moduli and the calculated XRD spectra for all compositions refined by the Rietveld method, this confirms that all the synthesized materials have a perovskite tetragonal structure with the space group P4mm. Subsequently, the Pseudo-Voigt function which can be written as PV = ηL + (1 − η)G, where η is the mixing factor, G is the Gaussian function, and L represents the Lorentzian function, was used to assimilate the shape of the X-ray diffraction peaks.59 Furthermore, the Caglioti (U, V, W) equation was used to describe the half-width of the diffraction peaks.60 The starting model used to refine the composition of BZT, BSmZT and BLaZT are that of structural parameters related to the tetragonal phase of BaTiO3, such as space group (No. 99), lattice parameters and atomic positions of each atom.61 In this model, Ba/Ln is placed at site 1a (1/2, 1/2, z); while Ti/Zr atoms occupy site 1b (0, 0, z). As already known in the BaTiO3 structure, there are two crystallographically distinct oxygen atoms 1c (1/2, 0, z) and 1d (0, 0, z) occupied by O1 and O2, respectively.
The results and conditions of structural refinement by the Rietveld method for the compounds BZT, BLaZT and BSmZT are reported in Table S1.† The lattice parameters indicate a decrease in tetragonality, with an increase in the size of the Ln3+ cation that partially replaces Ba2+. The decrease in the c/a ratio is mainly due to the decrease in “c” when the ionic radius of the lanthanides La3+ and Sm3+ is reduced, while the “a” parameter is almost invariant for both compounds (BSmZT and BLaZT). The decrease of the lattice volume for the doped compounds is a logical result related to the decrease of the ionic radius of Ln3+ inserted in the A site of the BZT structure. On the other hand, the refinement quality is judged by the values of the reliability factors R. All the prepared materials show good refinement quality due to the low values of R factors such as Rp, Rwp, Rexp and GOF, as shown in Table S1.† Subsequently, the obtained crystallographic parameters such as atomic positions and thermal agitation factor Uiso of all atoms resulting from Rietveld refinement for the compounds BZT, BSmZT and BLaZT are summarized in Table S2.† The distances between the O1 and O2 atoms and the atoms located in the A site (Ba/Ln) and B site (Ti/Zr) are also grouped in Table S3,† analysis of the data in this table indicates that the elongations along the c-axis (O2–Ti/Zr–O2) are small for the BLaZT compound, indicating that the distortion of [Ti/ZrO6] octahedra in the lattice of lanthanum-doped ceramics is slightly small compared to the other compounds, the decrease in the distortion of [Ti/ZrO6] octahedra in the BLaZT compound may be related to the decrease in tetragonality in the latter compound. After the final refinement of the samples, the crystal structure of the BSmZT materials was drawn by VESTA software using the CIF file (see Fig. 3), we see in this figure a schematic representation of a tetragonal supercell (P4mm), the final position parameters of each atom and illustrating the [Ti/ZrO6] and [Ba/SmO12] clusters obtained from the Rietveld analysis.
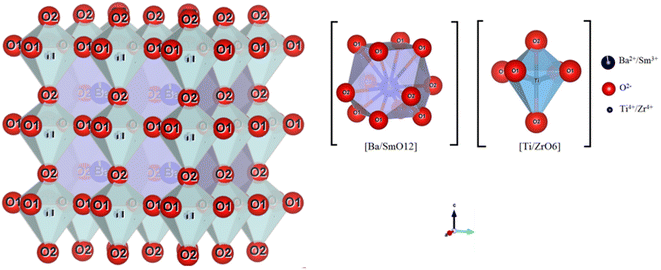 | ||
| Fig. 3 Schematic representation of BSmZT supercells drawn with the “VESTA” software in the P4mm space group with two types of clusters: [Ba/SmO12] and [Ti/ZrO6]. | ||
The coordination between the Ba/Sm atoms and the twelve oxygen atoms of these supercells forms a polyhedron called a cuboctahedron which is written as a [Ba/SmO12] cluster. The shape of the cuboctahedron has twelve common vertices, which result from the union of two triangles and two squares, fourteen faces and twenty-four identical edges, each separating a triangle from a square. The type of bonding between Ba/Ln and O atoms can be determined by the difference between the electronegativities (E) of (Ba/Ln) and O atoms. If the values exceed (1.7 eV), the bonds have a higher ionic bond character than the covalent bond character.62 For our materials, the difference between (EO and EBa/Ln) is about 2.6 which indicates that the Ba/Ln–O bond of the ionic bond character. Although the two atoms of Ti and Zr are linked to six atoms of O, to form a polyhedron called an octahedron that is written as clusters [Ti/ZrO6] (see Fig. 3). These octahedrons have six vertices, eight faces and twelve edges, formed by the union of eight triangles.62 The bonds between the atoms of Ti/Zr and O have an ionic character. These characteristics are due to the differences between the E of the atoms around (2.0 eV for Ti/Zr–O) and below (Ba/Ln–O) in the lattice. However, the [Ba/LnO12] clusters have a higher ionic character than the [Ti/ZrO6] clusters. But in general, the quality of the refinements is insufficient to discuss the proposed structural model and study the structural parameters in more detail.
3.2. Density and microstructure analysis by SEM of ceramic samples
The relative density (ρr) of the prepared ceramics was calculated using the following equation.63–65
 | (1) |
The relative density ρr is the ratio of measured density ρm = m/V and the theoretical density ρt = ZM/V0NA, where m, V, M, V0, and NA are the weight of the pellet, volume of pellet, molar mass, the volume of a unit cell and Avogadro's constant.
The calculated densities for the prepared ceramics are presented in Table 1. The relative densities of BZT, BSmZT and BLaZT ceramics are 93%, 92.72% and 94.53%, respectively indicating that the samples are well densified.
| Sample | ρm (g cm−3) | ρt (g cm−3) | ρr (%) |
|---|---|---|---|
| BZT | 5.6376 | 6.0701 | 93 |
| BSmZT | 5.6413 | 6.0842 | 92.72 |
| BLaZT | 5.7521 | 6.0848 | 94.53 |
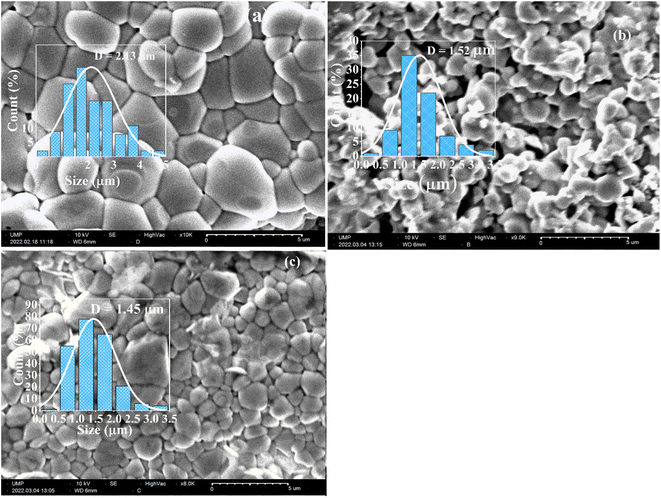
The micrographs of BZT, BSmZT and BLaZT ceramics are shown in Fig. 4(a)–(c), respectively. As can be seen, all samples sintered at 1300 °C shows regular grain shapes with low porosity and clear grain boundaries. In addition, the grain size is reduced when barium is partially replaced by lanthanides (Sm3+ and La3+). ImageJ software is used to calculate the average grain size (D). The values of grain size (D) for BZT, BSmZT and BLaZT are 2.43 μm, 1.52 μm and 1.45 μm respectively. The histogram of the grain size distribution according to a Gaussian fit was also added individually in these SEM images (see Fig. 4). The decrease in the average grain size can be related to the decrease in the tetragonality of the system due to the insertion of the lanthanides into the BZT.66
3.3. Study of dielectric properties
Complex impedance spectroscopy is a non-destructive technique for determining the relation between dielectric properties, structure and microstructure. In this technique, during the measurement, four variables are recorded as a function of frequencies, namely the real and imaginary part of the impedance, the phase angle and the dielectric loss. The complex permittivity ε* can be expressed in terms of real value (ε′) and imaginary part (ε′′).
 | (2) |
The relative permittivity (dielectric constant εr) and the dielectric loss (tan(δ)) were determined from the complex impedance measurements Z* (Z* = Z′ + jZ′′) using the following expressions.67
 | (3) |
 | (4) |
 | (5) |
The relative permittivity as a function of temperature for BZT and lanthanide-doped BZT (Ln3+ = Sm3+ and La3+) at different frequencies (1 kHz to 1 MHz) in the temperature range of 40–250 °C is shown in the Fig. 5.
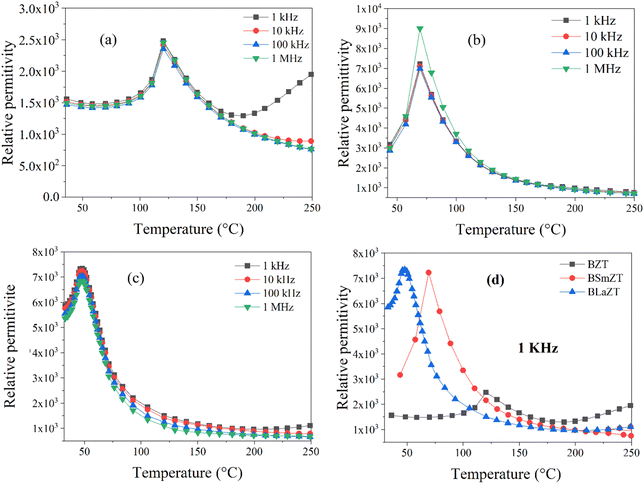 | ||
| Fig. 5 Temperature dependence of dielectric permittivity for: (a) BZT, (b) BSmZT, (c) BLaZT, (d) comparison of dielectric permittivity at 1 kHz for synthesized ceramics. | ||
In Fig. 5(a)–(c), we notice the appearance of a dielectric peak, this relative permittivity peak ε′ is associated with the transition from the ferroelectric tetragonal phase to a paraelectric cubic phase.38 We also observe that all compounds have the same transition temperature for all frequencies, which confirms that the prepared ceramics do not exhibit relaxation behavior, the curie temperature corresponding to this phase transition for all compounds is presented in Fig. 5(d). Therefore, the dielectric permittivity value of BZT compounds doped with lanthanides Ln3+ = La3+ and Sm3+ is higher compared to non-doped BZT and the value of the ferroelectric–paraelectric phase transition temperature (TC) decreases when lanthanides are inserted into the BZT structure.
The increase in dielectric permittivity for lanthanide-doped compounds compared to non-doped ones is caused by the substitution of barium by lanthanides, the cuboctahedral groups [BaO12] are substituted by the deformed cuboctahedral groups [LnO12] this process can be obtained by the Krӧger–Vink notation described by the equation below :58
 | (6) |
This equation means that for two Ln3+ ions positioned in the A-site, a cationic vacancy ( ) is necessary for charge neutrality in the perovskite structure, i.e. the substitution of Ba2+ ions by Ln3+ ions leads to a vacancy in the A-site, which increases with increasing Ln3+ ion content. Again, the change in lattice parameter causes the Ti4+/Zr4+ ions in the B-site of the unit cell to be decentered, so that the coupling between the octahedral groups of [Ti4+/Zr4+O6] weakens and results in a sharp decrease in the transition temperature.
The variation of the dielectric loss (denoted by tan(δ)) as a function of temperature for lanthanide-doped (Ln3+ = Sm3+ and La3+) and undoped BZT compounds is shown in Fig. 6(a)–(c). The value of the dielectric loss (tan![[thin space (1/6-em)]](https://www.rsc.org/images/entities/char_2009.gif) δ) is affected by structural parameters, the amount of oxygen ions transported in the material and defects (vacancies, holes, electrons,…), etc.68 The value of tan(δ) can be calculated from eqn (5). It is found that the rate of increase of the loss tangent (tan
δ) is affected by structural parameters, the amount of oxygen ions transported in the material and defects (vacancies, holes, electrons,…), etc.68 The value of tan(δ) can be calculated from eqn (5). It is found that the rate of increase of the loss tangent (tan![[thin space (1/6-em)]](https://www.rsc.org/images/entities/char_2009.gif) δ) is slower in the region of low temperatures, and all is constant, while for higher temperatures (above 150 °C), the value of tan
δ) is slower in the region of low temperatures, and all is constant, while for higher temperatures (above 150 °C), the value of tan![[thin space (1/6-em)]](https://www.rsc.org/images/entities/char_2009.gif) δ increases sharply. On the other hand, the phase transition temperature (ferroelectric–paraelectric) TC appears clearly for BZT and BSmZT and is not observed for BLaZT.
δ increases sharply. On the other hand, the phase transition temperature (ferroelectric–paraelectric) TC appears clearly for BZT and BSmZT and is not observed for BLaZT.
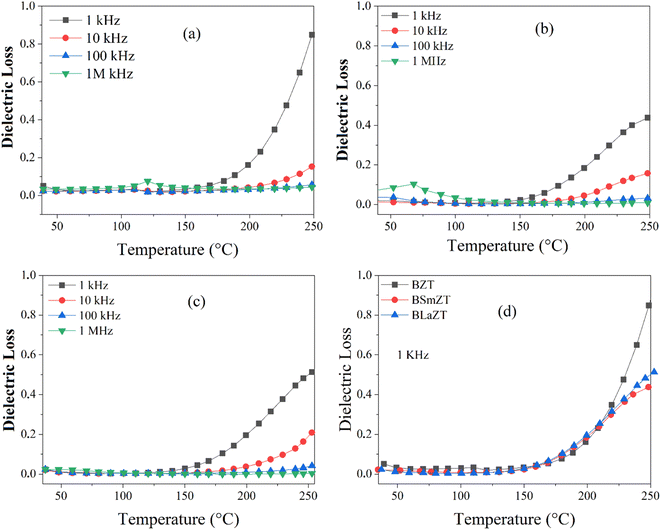 | ||
| Fig. 6 Temperature dependence of dielectric Loss: (a) BZT, (b) BSmZT, (c) BLaZT, (d) comparison of dielectric loss at 1 kHz for synthesized ceramics. | ||
The increase in tan(δ) may be due to the presence of certain types of unknown defects such as oxygen vacancies formed during sintering or to the distribution of thermally activated charge carriers (electrons). The amount of vacancies in a material depends on the nature of the material, the thermal conditions of preparation (sintering) and the nominal voltage of the reactants.69 Normally, during the sintering process, some types of cations may have multiple valence states, the electrical neutrality of the lattice is then violated due to these newly created valence states. Oxygen vacancies are formed at high sintering temperatures; this mechanism can be properly explained using the Kroger-Ving notation:70
 | (7) |
 represents oxygen gap formed. Therefore, the electrons presented in excess to the lattice this compensated according to the following reduction reaction Ti4++ e− ↔Ti3+.69 In general, rare earths have a valence state of +3, which is lower than that of Ti4+ and higher than that of Ba2+, so they serve as acceptor doping in the B site and as donor in the A site. La3+ and Sm3+ will occupy the A site due to their larger ionic radius and will serve as donor doping. In particular, La is the most stable rare earth in the A-site.71 The donor doping of La3+ and Sm3+ in the A-site can effectively prevent the change of the valence state of Ti in the B-site and the creation of oxygen vacancies in the lattice. Therefore, the loss (tan(δ)) is decreased at a fixed temperature for La and Sm doped BZT as shown in Fig. 6(d).
The comparative study of the relative permittivity (ε′) and dielectric loss (tan(δ)) of the present samples with other materials is summarized in Table 2, which is comparable to the values of other reported materials.
| Composition | Sintering temperature (°C) | tan(δ) | References | |
|---|---|---|---|---|
| Ba0.985Mg0.015Ti0.98 Zr0.02O3 | 1150 | 2348 | 0.050 | 72 |
| La/Mn Co-doped BaTiO3 | 1290 | 980 | 0.030 | 66 |
Ba0.95Pr0![[thin space (1/6-em)]](https://www.rsc.org/images/entities/char_2009.gif) .034Zr0.09Ti0.91O3 .034Zr0.09Ti0.91O3 |
1500 | 9780 | 0.017 | 39 |
Ba0.95Nd0![[thin space (1/6-em)]](https://www.rsc.org/images/entities/char_2009.gif) .034Zr0.09Ti0.91O3 .034Zr0.09Ti0.91O3 |
1500 | 10![[thin space (1/6-em)]](https://www.rsc.org/images/entities/char_2009.gif) 900 900 |
0.023 | 39 |
Ba0.95Gd0![[thin space (1/6-em)]](https://www.rsc.org/images/entities/char_2009.gif) .034Zr0.09Ti0.91O3 .034Zr0.09Ti0.91O3 |
1500 | 4320 | 0.049 | 39 |
| Ba0.85Ca0.15Zr0.10Ti0.90O3 | 1350 | 4805 | 0.016 | 73 |
| BaZr0.05Ti0.95O3 | 1200 | 1500 | 0.020 | 74 |
| Ba0.985Sr0.015Zr0.10Ti0.90O3 | 1300 | 1600 | 0.050 | 66 |
| BaZr0.01Ti0.99O3 | 1300 | 2479 | 0.026 | Present work |
| Ba0.95Sm0.034Zr0.01Ti0.99O3 | 1300 | 7228 | 0.016 | Present work |
| Ba0.95La0.034Zr0.01Ti0.99O3 | 1300 | 7324 | 0.012 | Present work |
3.4. Complex impedance spectroscopy (CIS)
Nyquist plots (complex impedance spectra) and their temperature dependence for different compositions of BZT, BSmZT and BLaZT are shown in Fig. 7(a)–(c) respectively, and Fig. 7(d) represents the comparison of Nyquist plots at T = 380 °C for the three compounds (BZT, BSmZT and BLaZT).
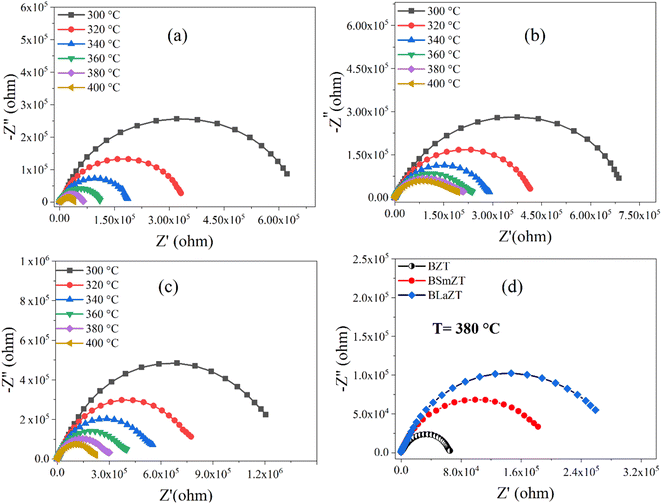 | ||
| Fig. 7 (a–d) Complex impedance spectrum (Nyquist plots) for: (a) BZT, (b) BSmZT, (c) BLaZT ceramics at different temperatures and (d) comparison of Nyquist plots at T = 380 °C for BZT, BSmZT, BLaZT. | ||
The plots have semicircles; their centers are located below the real impedance axis. A careful observation of the complex diagram confirms the presence of two depressed semicircles, the first on the low-frequency side shows a contribution due to grains and the second on the high-frequency side is due to grain boundaries, the depressed semicircles for all ceramics indicate a non-Debye type relaxation process due to the distribution of relaxation times.76 The presence of non-Debye type relaxation or multiple relaxation times in materials can be due to several causes such as arbitrary grain size distribution and growth, different grain shapes and directions, or electromagnetic scattering effect.66,73 In addition, to describe the electrical properties of the materials, an electrical circuit consisting of two branches in series is used to represent the specific electrical properties of grain boundaries and grains; this series combination of two circuits in parallel identifies the effect of grain boundaries and grains respectively. The first circuit assigned to the grains has resistance Rg, capacitance Cg, and the constant phase element CPEg, and the second circuit corresponding to the grain boundaries also has resistance Rgb, capacitance Cgb, and the constant phase element CPEgb respectively. The presence of the constant phase element in the grains and in the grain boundaries indicates a non-ideal capacitive behavior, and this non-ideal behavior of the grains and grain boundaries may be due to the presence of more than one relaxation process.77–79 The capacitance C and the phase element value CPE are related as  where α < 1.80,81 Fitted Nyquist plot and the equivalent circuits for the BLaZT composition at different temperatures is presented in Fig. 8. The values of R, C and CPE corresponding to the grain and grain boundary contributions were calculated using MT-Lab software; the results obtained are presented in Table S4.†
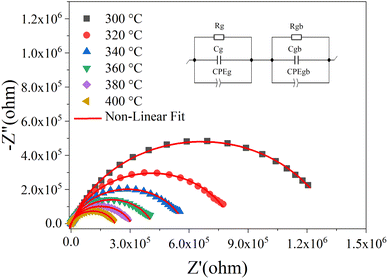 | ||
| Fig. 8 Nyquist plot fitted for BLaZT composition at different temperatures. Red lines show data fitted with MT-Lab software. | ||
The analysis of the obtained results shows that the resistances Rg and Rgb of the three compounds decrease with the increase of the temperature, this decrease of Rg, Rgb and Rt(Rg + Rgb) is related to two factors: the thermal activation and the liberation of the trapped charge carriers with the increase of the temperature what confirms the semiconducting nature of the three samples.82 It is also noted that the grain resistance value (Rg) is lower than the grain seal value (Rgb) for all selected temperatures.
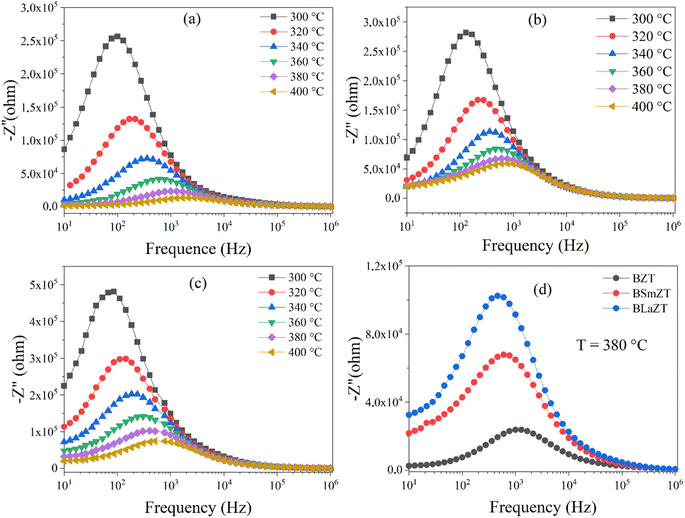
Fig. 9(a)–(c) represent the variation of the imaginary part of the impedance (Z′′) as a function of frequency at high temperature for (a) BZT, (b) BSmZT, (c) BLaZT and Fig. 9(d) represents the comparison of (−Z′′) as a function of frequency at T = 380 °C for the three compounds (BZT, BSmZT and BLaZT).
This figure has two aspects: (i) appearance of a peak at a characteristic frequency corresponding to each temperature which called relaxation frequency. It broadens with increasing temperature, indicating the presence of a temperature-dependent relaxation mechanism in the samples. This mechanism is due to the existence of immobile charge carriers at low temperature and defects at high temperature, (ii) the maximum amplitudes of −Z′′ decrease and move towards the higher frequencies with increasing temperature, this indicates that the relaxation process is thermally activated with an accumulation of space charge at the barrier.66,68,83–85 Fig. 9(d) shows that the values of (−Z′′) increase and the relaxation frequency decreases with the insertion of rare earth into the A-site of the BZT perovskite. The relaxation frequency that is the one for which the maximum value of −Z′′ is obtained is called the relaxation frequency (fmax) and the corresponding relaxation time (denoted τ) can be calculated from the relation 2πfmaxτ = 1.
σac = 2πfε0ε′![[thin space (1/6-em)]](https://www.rsc.org/images/entities/char_2009.gif) tan(δ) tan(δ)
| (8) |
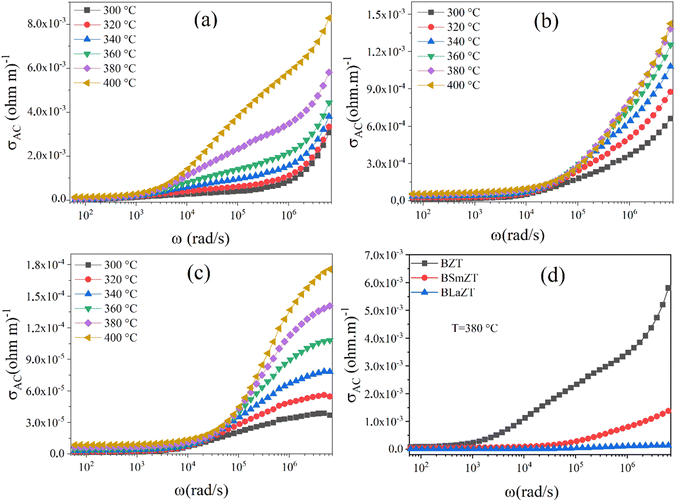 | ||
| Fig. 10 The variation of ac conductivity with frequency at different temperatures for: (a) BZT, (b) BSmZT, (c) BLaZT and (d) comparison of ac conductivity at T = 380 °C for BZT, BSmZT, BLaZT. | ||
We can see from Fig. 10(a)–(c) that the ac conductivity increases with frequency for all temperatures. The ac conductivity at each measured temperature shows two distinct regions. At low frequency, we observe a first region where the conductivity does not change with frequency, i.e., it is independent of the test frequency, indicating that the dc conductivity plays a dominant role in this region. For the second region, the conductivity increases with frequency. This type of ac conductivity can be explained by the Jonscher power law.86
| σ(ω) = σdc + Aωn | (9) |
| σ(ω) = σac + A1ωn1 + A2ωn2 | (10) |
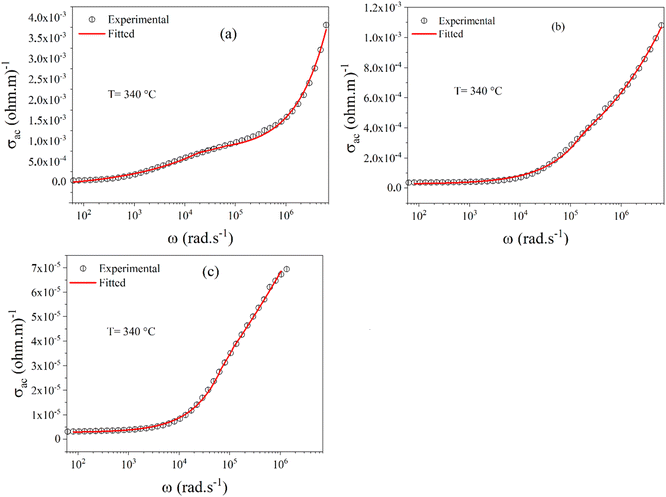
Fig. 11(a)–(c) show the nonlinear curve fitted to the modified Jonscher power law for BZT, BSmZT, and BLaZT at 340 °C. The values of the fitting parameters A1, n1, A2, n2 and σdc for all compositions at different temperatures are presented in the Table S5† were calculated from the nonlinear fit by eqn (10).
As it is mentioned before, the variation of “n” values with temperature has led to the knowledge of different conduction models in our materials. Several types of models have been reported by many researchers in the literature.77
Fig. 12(a) and (b) represents the variation of the parameters “n1” and “n2” with temperature (300–400 °C) for undoped and Sm and La doped BZT compounds, This observation indicates that the non-overlapping small polaron tunneling effect (NSPT) is the appropriate model to understand the charge transport mechanism in grains (region I). According to this model, the AC conductivity of these samples is due to the addition of a charge carrier at a site that leads to local lattice distortion.77 On the other hand, we observe that “n2” varies inversely with temperature. This observation indicates that correlated barrier hopping (CBH) is the appropriate model to understand the mechanism of charge transport in grain boundaries (region II).71 The AC conductivity of the second region in these three samples is due to the hopping of charge carriers between two sites on the potential barrier between them due to thermal activation.56
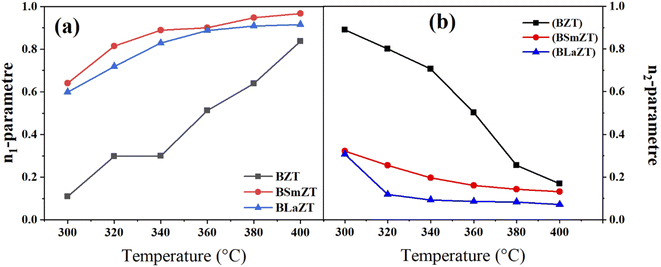 | ||
| Fig. 12 The variation of the parameter (a) “n1” and (b) “n2” with temperature (300 to 400 °C) for all compounds. | ||
The dependence of σdc on temperature can be described by the Arrhenius law:
 | (11) |
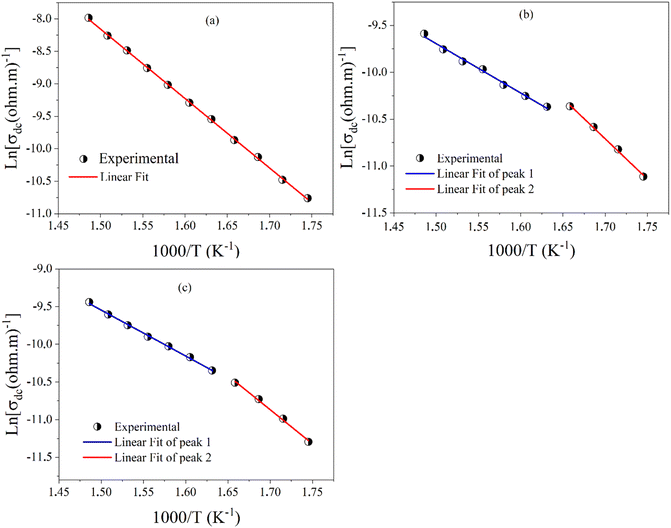 | ||
| Fig. 13 The variation of ln(σdc) as a function of 1000/T for; (a) BZT, (b) BSmZT BLaZT, and (c) BLaZT ceramics. | ||
| Composition | Ega from σdc (eV) | Egba from σdc (eV) |
|---|---|---|
| BZT | 0.921 | — |
| BSmZT | 0.741 | 0.453 |
| BLaZT | 0.779 | 0.525 |
The conductivity of the material depends mainly on two factors: (i) the concentration and (ii) the mobility of the charge carriers present in the material,91 in ferroelectric materials with a perovskite-like structure, especially in titanates, the conduction mechanism is mainly due to oxygen defects and these defects can increase or decrease depending on the preparation conditions.91 Fig. 10(d) illustrates the variation of conductivity as a function of frequency of doped and undoped BZT ceramics at T = 380 °C and shows that the AC conductivity of BSmZT and BLaZT is more reliable than that of undoped BZT, this is due to the substitution of Ba (divalent element) by the lanthanides Sm3+ and La3+(trivalent elements); this heterogeneous substitution prevents the creation of oxygen vacancies in the lattice.71 Results in a decrease in conductivity in doped compounds compared to undoped compounds, caused by the decrease in the concentration of oxygen vacancies (OVs).
The existence of a stretching coefficient parameter (β) is confirmed by the asymmetric broadening of the relaxation peaks ( ), this parameter allowing to determine the type of relaxation process in the ceramic (Debye or non-Debye) either for the grains or for the grain boundaries.86 The modeled Kohlrausch–Williams Watts (KWW) function proposed by Bergma is used to calculate this coefficient (β), the modified notation of this function is presented as follows:96
 | (12) |
 is the maximum value of M′′ in the low-frequency region,
  is the maximum value of M′′ in the high-frequency region, fgbmax is the maximum frequency corresponding to the grain boundary anomaly, and fgmax is that corresponding to the grain anomaly. For ideal Debye relaxation, β = 1 and for non-Debye relaxation, (β) is between 0 and 1 (0 < β < 1).
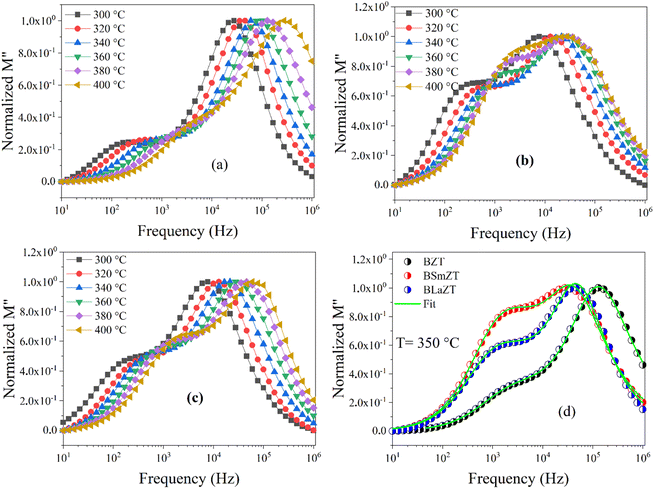
The green lines in Fig. 14(d) represent the fit by eqn (12)of the variation of M′′ as a function of frequency at T = 350 °C for BZT, BSmZT and BLaZT ceramics. The results found for the temperature range 300–400 °C are presented in the Table S6.† the analysis of these results indicates that the values of β between 0 and 1 (0 < β < 1) that show a deviation of the non-Debye type, the variation of β related to the contribution of grains and grain boundaries as a function of temperature are shown in Fig. 15(a)–(c).
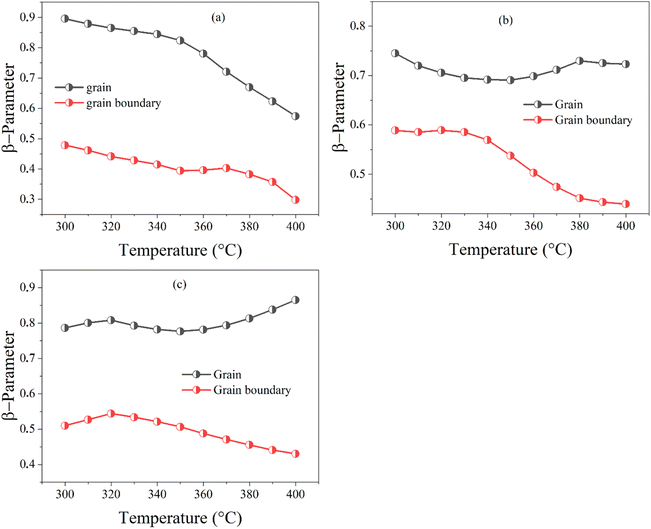 | ||
| Fig. 15 The variation of β-parameter with temperature (300 to 400 °C); (a) BZT, (b) BSmZT, (c) BLaZT. | ||
An Arrhenius-type behavior model expressed by the following formulas defines the relaxation process induced by the imaginary modulus:
 | (13) |
 | (14) |
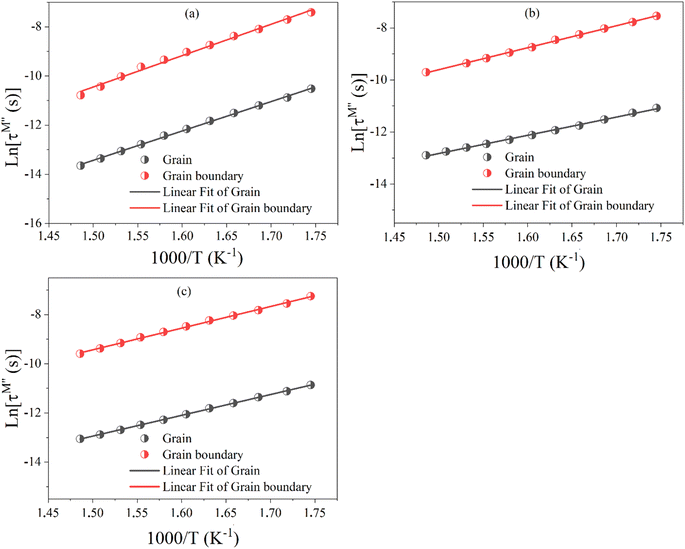
τ0 represents the pre-exponential factor; kB and T are the Boltzmann constant and temperature, respectively. The activation energy related to the grain and grain boundary response was determined from the slope of the linear fit in the Arrhenius plot (shown in Fig. 16(a)–(c)) is plotted between ln(τM′′) vs. 1000/T. Ega and Egba calculated or our materials are shown in Table 4.
| Composition | Ega from M′′ (eV) | Egba from M′′ (eV) |
|---|---|---|
| BZT | 1099 | 1029 |
| BSmZT | 0.728 | 0.604 |
| BLaZT | 0.759 | 0.729 |
A comparison of activation energy values suggest that higher energy is required for charge carrier mobility across grain boundaries and within grains for undoped compounds compared to lanthanide-doped compounds. This is because less energy is required for charge carrier activation in Sm3+ and La3+ doped compounds.
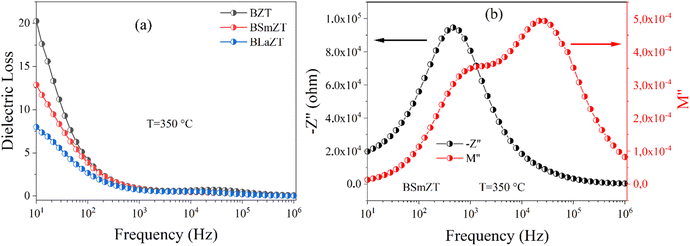
The comparison of dielectric loss, imaginary impedance and imaginary modulus diagrams is very important to separate grain and grain boundary effects and/or to differentiate at the microscopic scale the process responsible for the localized dielectric relaxation and the long range conduction mechanism.95,97
Fig. 17(a) shows the variation of dielectric loss as a function of frequency for BZT, BSmZT and BLaZT respectively at T = 350 °C. No peaks were observed in the dielectric loss plot, indicating the absence of a dielectric relaxation process in all three samples. Indeed, to confirm the presence of a dielectric relaxation process in a material, a relaxation peak must be present in both the dielectric loss and imaginary impedance plots (−Z′′ and M′′).93 On the other hand, Fig. 17(b) shows the evolution of the imaginary impedance and imaginary electric modulus as a function of frequency at T = 350 °C for the example compound BSmZT. The peaks observed in the impedance and modulus plot confirm the presence of distinct conduction mechanisms.95 Similarly, two peaks were observed in the modulus plot while only one peak is observed in the spectroscopic impedance plot (see Fig. 17(b)). We can then neglect the contribution of the electrode polarization in our results because the electrode-sample (interfacial) polarization generally appears at frequencies below 100 Hz,95 and a partial overlap of the M′′ and Z′′ peaks in our samples, as shown in Fig. 17(b), indicates the presence of both long-range conductivity and localized relaxation processes.92,98
4. Conclusion
The synthesis of Ba(Zr0.99Ti0.01)O3, (Ba0.95Sm0.034)(Zr0.99Ti0.01)O3 and (Ba0.95La0.034)(Zr0.99Ti0.01)O3 was carried out by the solid state chemical synthesis route. The X-ray diffraction pattern refined by the Rietveld method at room temperature confirms the formation of a tetragonal phase for the three synthesized compounds. Microstructural studies show well-developed sintered grains and a decrease in grain size when the lanthanides are introduced into the A-site of the perovskite, with an average grain size between 1.45 and 2.43 μm. Dielectric studies reveal an increase in the dielectric constant and a decrease in the loss tangent value with a shift of the TC curie temperature to low temperatures. The electrical behavior of the compounds was studied by impedance spectroscopy in the temperature range of 300–400 °C. Cole–Cole plots of Z′′ versus Z′ show that the electrical response of the ceramics for all samples is due to grain and grain boundary effects. Conductivity is decreased when lanthanides are introduced into the lattice, which is in agreement with the increase in resistance; the correlated barrier hopping (CBH) model at the grains and the non-overlapping small polaron tunneling (NSPT) model at the grain boundaries dominate conduction. The values of β (0 < β < 1) confirm the presence of non-Debye type relaxation and a trace of the imaginary impedance Z′′ and imaginary electric modulus M′′ as a function of frequency and a partial overlap of the M′′ and Z′′ peaks in our samples, indicates the presence of both long range conductivity and localized relaxation processes.Conflicts of interest
There are no conflicts to declare.Acknowledgements
We gratefully acknowledge the anonymous reviewers for their careful review and valuable suggestions on the manuscript. We thank the Department of Chemistry – Multidisciplinary Faculty (FPN), for their practical assistance in recording the spectral analysis. The authors are thankful to the Head of Oujda's chemistry department, Prof. Abdelmonaem TALHAOUI, for providing all the facilities and subsidies necessary to carry out the research work of this article.References
- M. Acosta, N. Novak, V. Rojas, S. Patel, R. Vaish, J. Koruza, G. Rossetti Jr and J. Rödel, Appl. Phys. Rev., 2017, 4, 041305 Search PubMed.
- M. E. Villafuerte-Castrejón, E. Morán, A. Reyes-Montero, R. Vivar-Ocampo, J.-A. Peña-Jiménez, S.-O. Rea-López and L. Pardo, Materials, 2016, 9, 21 CrossRef PubMed.
- H. Zhang, T. Wei, Q. Zhang, W. Ma, P. Fan, D. Salamon, S.-T. Zhang, B. Nan, H. Tan and Z.-G. Ye, J. Mater. Chem. C, 2020, 8, 16648–16667 RSC.
- J. Wu, J. Appl. Phys., 2020, 127, 190901 CrossRef CAS.
- K. Kannan, K. Tan, Z. Zainal, C. Khaw, S. Chen and O. Lee, Results Phys., 2020, 19, 103374 CrossRef.
- L. Patrick, Alternative medicine review, 2006, p. 11 Search PubMed.
- J. Rödel, W. Jo, K. T. Seifert, E. M. Anton, T. Granzow and D. Damjanovic, J. Am. Ceram. Soc., 2009, 92, 1153–1177 CrossRef.
- J. Rödel, K. G. Webber, R. Dittmer, W. Jo, M. Kimura and D. Damjanovic, J. Eur. Ceram. Soc., 2015, 35, 1659–1681 CrossRef.
- Z. Suwei, Z. Hailong, Z. Boping and Y. Sui, J. Alloys Compd., 2010, 506 Search PubMed.
- K. M. Sangwan, N. Ahlawat, R. Kundu, S. Rani, S. Rani, N. Ahlawat and S. Murugavel, J. Phys. Chem. Solid., 2018, 117, 158–166 CrossRef CAS.
- E. Haily, L. Bih, A. Lahmar, M. Elmarssi and B. Manoun, Phys. Mater. Chem., 2020, 241, 122434 CrossRef CAS.
- A. Sati, A. Kumar, V. Mishra, K. Warshi, P. Pokhriyal, A. Sagdeo and P. Sagdeo, Mater. Chem. Phys., 2021, 257, 123792 CrossRef CAS.
- M. V. Petrović, J. Bobić, T. Ramoška, J. Banys and B. D. Stojanović, Ceram. Int., 2011, 37, 2669–2677 CrossRef.
- M. V. Petrović, R. Grigalaitis, N. Ilic, J. Bobić, A. Dzunuzovic, J. Banys and B. D. Stojanović, J. Alloys Compd., 2017, 724, 959–968 CrossRef.
- G. N. Bhargavi, A. Khare, T. Badapanda and M. S. Anwar, Appl. Phys. A, 2018, 124, 1–9 CrossRef.
- S. Smail, M. Benyoussef, K. Taïbi, N. Bensemma, B. Manoun, M. El Marssi and A. Lahmar, Phys. Mater. Chem., 2020, 252, 123462 CrossRef CAS.
- V. Paunovic, V. Mitic, M. Djordjevic and Z. Prijic, Ceram. Int., 2020, 46, 8154–8164 CrossRef CAS.
- P. Singh, R. S. Yadav, P. Singh and S. B. Rai, J. Alloys Compd., 2021, 855, 157452 CrossRef CAS.
- P. Sharma, P. Kumar, R. Kundu, J. Juneja, N. Ahlawat and R. Punia, Ceram. Int., 2015, 41, 13425–13432 CrossRef CAS.
- J. Bhagyaraj, K. Ramaiah, C. Saikrishna and S. Bhaumik, J. Alloys Compd., 2013, 581, 344–351 CrossRef CAS.
- J.-H. Li, S.-F. Wang, Y.-F. Hsu, T.-F. Chung and J.-R. Yang, J. Alloys Compd., 2018, 768, 122–129 CrossRef CAS.
- Y. Wang, H. Fan, B. Peng and P. Ren, J. Alloys Compd., 2014, 590 Search PubMed.
- Z. Yu, C. Ang, R. Guo and A. Bhalla, Mater. Lett., 2007, 61, 326–329 CrossRef CAS.
- L. Liu, S. Ren, J. Zhang, B. Peng, L. Fang and D. Wang, J. Am. Ceram. Soc., 2018, 101, 2408–2416 CrossRef CAS.
- M. J. Haque, M. S. Mostari, S. R. Ankur and M. S. Rahman, Results Mater., 2021, 10, 100176 CrossRef CAS.
- T. Maiti, R. Guo and A. Bhalla, J. Am. Ceram. Soc., 2008, 91, 1769–1780 CrossRef CAS.
- L. Jin, J. Qiao, L. Wang, L. Hou, R. Jing, J. Pang, L. Zhang, X. Lu, X. Wei and G. Liu, J. Alloys Compd., 2019, 784, 931–938 CrossRef CAS.
- T. Maiti, R. Guo and A. Bhalla, J. Am. Ceram. Soc., 2008, 91, 1769–1780 CrossRef CAS.
- B. Asbani, J.-L. Dellis, A. Lahmar, M. Courty, M. Amjoud, Y. Gagou, K. Djellab, D. Mezzane, Z. Kutnjak and M. El Marssi, Appl. Phys. Lett., 2015, 106, 042902 CrossRef.
- H. Kaddoussi, Y. Gagou, A. Lahmar, J. Belhadi, B. Allouche, J.-L. Dellis, M. Courty, H. Khemakhem and M. El Marssi, Solid State Commun., 2015, 201, 64–67 CrossRef CAS.
- H. Kaddoussi, A. Lahmar, Y. Gagou, J.-L. Dellis, H. Khemakhem and M. El Marssi, Ceram. Int., 2015, 41, 15103–15110 CrossRef CAS.
- Y. Bai, X. Han and L. Qiao, Appl. Phys. Lett., 2013, 102, 252904 CrossRef.
- M. Benyoussef, J. Belhadi, A. Lahmar and M. El Marssi, Mater. Lett., 2019, 234, 279–282 CrossRef CAS.
- H. Cheng, J. Ouyang, Y.-X. Zhang, D. Ascienzo, Y. Li, Y.-Y. Zhao and Y. Ren, Nat. Commun., 2017, 8, 1–7 CrossRef.
- V. S. Puli, D. K. Pradhan, D. B. Chrisey, M. Tomozawa, G. Sharma, J. Scott and R. S. Katiyar, J. Mater. Sci., 2013, 48, 2151–2157 CrossRef CAS.
- K. Aliouane, A. Guehria-Laidoudi, A. Simon and J. Ravez, Solid State Sci., 2005, 7, 1324–1332 CrossRef CAS.
- F. Moura, A. Z. Simões, L. Cavalcante, M. Zampieri, J. A. Varela, E. Longo, M. Zaghete and M. Simões, Appl. Phys. Lett., 2008, 92, 032905 CrossRef.
- T. Badapanda, S. Sarangi, B. Behera, S. Anwar, T. Sinha, R. Ranjan, G. Luz, E. Longo and L. Cavalcante, J. Mater. Sci.: Mater. Electron., 2014, 25, 3427–3439 CrossRef CAS.
- X. Diez-Betriu, J. Garcia, C. Ostos, A. Boya, D. Ochoa, L. Mestres and R. Perez, Mater. Chem. Phys., 2011, 125, 493–499 CrossRef CAS.
- C. Ostos, L. Mestres, M. Martínez-Sarrión, J. Garcia, A. Albareda and R. Perez, Solid State Sci., 2009, 11, 1016–1022 CrossRef CAS.
- S. B. Reddy, K. P. Rao and M. R. Rao, J. Alloys Compd., 2011, 509, 1266–1270 CrossRef CAS.
- P. Yongping, Y. Wenhu and C. Shoutian, J. Rare Earths, 2007, 25, 154–157 CrossRef.
- R. Sagar and R. Raibagkar, J. Alloys Compd., 2013, 549, 206–212 CrossRef CAS.
- L. Ben and D. C. Sinclair, Appl. Phys. Lett., 2011, 98, 092907 CrossRef.
- Y. Zhang, J. Hao, C. L. Mak and X. Wei, Opt. Express, 2011, 19, 1824–1829 CrossRef CAS PubMed.
- R. Sagar, P. Hudge, S. Madolappa, A. Kumbharkhane and R. Raibagkar, J. Alloys Compd., 2012, 537, 197–202 CrossRef CAS.
- Y. Wang, L. Li, J. Qi and Z. Gui, Ceram. Int., 2002, 28, 657–661 CrossRef CAS.
- D. Shan, Y. Qu and J. Song, Solid State Commun., 2007, 141, 65–68 CrossRef CAS.
- S. Bhaskar Reddy, M. Ramachandra Rao and K. Prasad Rao, Appl. Phys. Lett., 2007, 91, 022917 CrossRef.
- X. Chou, J. Zhai, H. Jiang and X. Yao, J. Appl. Phys., 2007, 102, 084106 CrossRef.
- Y. Wang, L. Li, J. Qi and Z. Gui, Ceram. Int., 2002, 28, 657–661 CrossRef CAS.
- X. Diez-Betriu, J. Garcia, C. Ostos, A. Boya, D. Ochoa, L. Mestres and R. Perez, Mater. Chem. Phys., 2011, 125, 493–499 CrossRef CAS.
- S. Mahajan, O. Thakur, D. Bhattacharya and K. Sreenivas, J. Phys. D Appl. Phys., 2009, 42, 065413 CrossRef.
- J. Wu, L. Li, W. Espinosa and S. Haile, J. Mater. Res., 2004, 19, 2366–2376 CrossRef CAS.
- V. Petříček, M. Dušek and L. Palatinus, Z. für Kristallogr. - Cryst. Mater., 2014, 229, 345–352 CrossRef.
- S. Elliott, Adv. Phys., 1987, 36, 135–217 CrossRef CAS.
- F. Han, Y. Bai, L.-J. Qiao and D. J. J. o. M. C. C. Guo, J. Mater. Chem. C, 2016, 4, 1842–1849 RSC.
- A. Bendahhou, K. Chourti, M. Loutou, S. El Barkany and M. Abou-Salama, RSC Adv., 2022, 12, 10895–10910 RSC.
- Z. Chchiyai, F. El Bachraoui, Y. Tamraoui, L. Bih, A. Lahmar, M. El Marssi, J. Alami and B. Manoun, J. Alloys Compd., 2022, 166979 CrossRef CAS.
- G. Caglioti, A. t. Paoletti and F. Ricci, Nucl. Instrum., 1958, 3, 223–228 CrossRef CAS.
- Z. Raddaoui, R. Lahouli, S. Kossi, J. Dhahri, K. Khirouni and K. Taibi, J. Alloys Compd., 2019, 771, 67–78 CrossRef CAS.
- T. Badapanda, V. Senthil, S. Rout, L. Cavalcante, A. Z. Simões, T. Sinha, S. Panigrahi, M. De Jesus, E. Longo and J. A. Varela, Curr. Appl. Phys., 2011, 11, 1282–1293 CrossRef.
- A. Bendahhou, K. Chourti, S. El Barkany and M. Abou-Salama, Ceram. Int., 2022, 48, 20446–20455 CrossRef CAS.
- A. Bendahhou, P. Marchet, A. El-Houssaine, S. El Barkany and M. Abou-Salama, CrystEngComm, 2021, 23, 163–173 RSC.
- K. Chourti, P. Marchet, Y. El Hafiane, A. Bendahhou, S. El Barkany, M. Karroua and M. Abou-salama, Moroc. J. Chem., 2020, 8(8–1), 2304–2317 Search PubMed.
- D. B. Chandra, M. Matin and H. A. Akther, J. Mater. Sci. Mater. Electron., 2021, 32, 4916–4936 CrossRef.
- J. Joshi, D. Kanchan, M. Joshi, H. Jethva and K. Parikh, Mater. Res. Bull., 2017, 93, 63–73 CrossRef CAS.
- R. Roy and A. Dutta, Ceram. Int., 2021, 47, 15732–15742 CrossRef CAS.
- B. Arya, M. Mohanty and R. Choudhary, Mater. Chem. Phys., 2022, 125717 CrossRef CAS.
- K. M. Sangwan, N. Ahlawat, S. Rani, S. Rani and R. Kundu, Ceram. Int., 2018, 44, 10315–10321 CrossRef CAS.
- D. Y. Lu, M. Toda and M. Sugano, J. Am. Ceram. Soc., 2006, 89, 3112–3123 CrossRef CAS.
- M. Chandraiah and P. Panda, Ceram. Int., 2015, 41, 8040–8045 CrossRef CAS.
- K. N. D. K. Muhsen, R. A. M. Osman and M. S. Idris, J. Mater. Sci.: Mater. Electron., 2019, 30, 20673–20686 CrossRef CAS.
- T. Badapanda, S. Chaterjee, A. Mishra, R. Ranjan and S. Anwar, Phys. B, 2017, 521, 264–269 CrossRef CAS.
- B. Kang, S.-K. Choi and C. Park, J. Appl. Phys., 2003, 94, 1904–1911 CrossRef CAS.
- T. Badapanda, S. Sarangi, B. Behera, S. Anwar, T. Sinha, R. Ranjan, G. Luz, E. Longo and L. Cavalcante, J. Mater. Sci.: Mater. Electron., 2014, 25, 3427–3439 CrossRef CAS.
- M. Jebli, C. Rayssi, J. Dhahri, M. B. Henda, H. Belmabrouk and A. Bajahzar, RSC Adv., 2021, 11, 23664–23678 RSC.
- H. Ali, S. Karim, M. Rafiq, K. Maaz, A. ur Rahman, A. Nisar and M. Ahmad, J. Alloys Compd., 2014, 612, 64–68 CrossRef CAS.
- M. S. Abouzari, F. Berkemeier, G. Schmitz and D. Wilmer, Solid State Ionics, 2009, 180, 922–927 CrossRef.
- S. Lenka, T. Badapanda, P. Nayak, S. Sarangi and S. Anwar, Ceram. Int., 2021, 47, 5477–5486 CrossRef CAS.
- K. Chourti, A. Bendahhou, F. A. Rabie, M. Loutou and M. Abou-salama, Mater. Today Proc., 2021, 45, 7450–7456 CrossRef CAS.
- H. Ali, S. Karim, M. Rafiq, K. Maaz, A. ur Rahman, A. Nisar and M. Ahmad, J. Alloys Compd., 2014, 612, 64–68 CrossRef CAS.
- G. Nag Bhargavi, T. Badapanda, A. Khare, M. Shahid Anwar and N. Brahme, Appl. Phys. A, 2021, 127, 528 CrossRef CAS.
- B. Mandal, P. Roy and P. Mitra, Mater. Sci. Eng. C, 2020, 117, 111304 CrossRef CAS PubMed.
- A. Sakthisabarimoorthi, S. M. B. Dhas, R. Robert and M. Jose, Mater. Res. Bull., 2018, 106, 81–92 CrossRef CAS.
- A. Bendahhou, K. Chourti, R. El Bouayadi, S. El Barkany and M. Abou-Salama, RSC Adv., 2020, 10, 28007–28018 RSC.
- R. Muhammad, A. Khesro and M. Uzair, J. Electron. Mater., 2016, 45, 4083–4088 CrossRef CAS.
- J. Scott and M. Dawber, Appl. Phys. Lett., 2000, 76, 3801–3803 CrossRef CAS.
- S. Wu, C. Sun, X. Yang, C. Hu, L. Liu and L. Fang, Ceram. Int., 2020, 46, 9240–9248 CrossRef CAS.
- A. Bendahhou, P. Marchet, S. El Barkany and M. Abou-Salama, J. Alloys Compd., 2021, 882, 160716 CrossRef CAS.
- S. Lenka, T. Badapanda, P. Nayak, S. Sarangi and S. Anwar, Ceram. Int., 2021, 47, 5477–5486 CrossRef CAS.
- R. Gerhardt, J. Phys. Chem. Solid., 1994, 55, 1491–1506 CrossRef CAS.
- J. Liu, C.-G. Duan, W.-G. Yin, W.-N. Mei, R. W. Smith and J. R. Hardy, J. Chem. Phys., 2003, 119, 2812–2819 CrossRef CAS.
- S. Madolappa, B. Ponraj, R. Bhimireddi and K. B. Varma, J. Am. Ceram. Soc., 2017, 100, 2641–2650 CrossRef CAS.
- S. Madolappa, H. K. Choudhary, N. Punia, A. Anupama and B. Sahoo, Mater. Chem. Phys., 2021, 270, 124849 CrossRef CAS.
- R. Bergman, J. Appl. Phys., 2000, 88, 1356–1365 CrossRef CAS.
- J. Liu, C.-G. Duan, W.-G. Yin, W.-N. Mei, R. W. Smith and J. R. Hardy, Phys. Rev. B: Condens. Matter Mater. Phys., 2004, 70, 144106 CrossRef.
- V. Khopkar and B. Sahoo, Phys. Chem. Chem. Phys., 2020, 22, 2986–2998 RSC.
Footnote |
| † Electronic supplementary information (ESI) available. See DOI: https://doi.org/10.1039/d2ra06758g |
| This journal is © The Royal Society of Chemistry 2022 |

