 Open Access Article
An off–on fluorescence aptasensor for trace thrombin detection based on FRET between CdS QDs and AuNPs†
Pu Li b,
Chen Luob,
Xiaoxiao Chen
 b and
Chaobiao Huang
 *ab
*ab
aXingzhi College, Zhejiang Normal University, Lanxi 321100, China. E-mail: hcb@zjnu.cn
bCollege of Chemistry and Life Science, Zhejiang Normal University, Jinhua 321004, China
First published on 14th December 2022
Abstract
An off–on fluorescence aptasensor was developed for trace thrombin detection based on fluorescence resonance energy transfer (FRET) between CdS QDs and gold nanoparticles (AuNPs). Using DNA pairwise hybridization of the aptamer to the complementary DNA (cDNA), the CdS QDs (energy donor) were tightly coupled to the AuNPs (energy acceptor), resulting in the occurrence of FRET and there was a dramatic fluorescence quenching of CdS QDs (turn off). When the thrombin was added to the fluorescence aptasensor, the specific binding of the aptamer to the target formed a G-quadruplex that caused the AuNPs receptor to detach and the DNA duplex to be disassembled. The process would inhibit the FRET which contribute to the recovery of fluorescence (turn on) and an “off–on” fluorescence aptasensor for thrombin detection was constructed accordingly. Under optimal conditions, the fluorescence recovery showed good linearity with the concentration of thrombin in the range of 1.35–54.0 nmol L−1, and the detection limit was 0.38 nmol L−1 (S/N = 3, n = 9). Importantly, the fluorescence aptasensor presented excellent specificity for thrombin, and was successfully applied to the quantitative determination of thrombin in real serum with satisfactory recoveries of 98.60–102.2%.
1. Introduction
Thrombin (TB) is a multifunctional serine protease with procoagulant and anticoagulant activities that is associated with a majority of physiological and pathological processes such as thrombosis, angiogenesis, inflammation, blood clotting, tumor growth and metastasis.1–5 It also acts as a hormone to regulate platelet aggregation, endothelial cell activation and other important vascular biological responses.6 Lower concentrations of TB can play a neuroprotective role in organisms. However, if TB levels are too low, it can cause a decrease in coagulation function, whereas levels that are too high may contribute to thrombosis and Alzheimer's disease.7–9 Therefore, it is crucial to design a sensor with high selectivity and sensitivity for thrombin detection in biochemical analysis.Current methods for the detection of thrombin content based on aptamers include electrochemistry,10–15 fluorimetry,16,17 colorimetry18–20 and surface enhanced Raman scattering (SERS).21–23 Among them, the fluorescence has attracted special attention because of its high sensitivity.24 Aptamers (apt, single-stranded DNA or RNA) have attracted increasing interest in biosensors due to their properties and the ability to specifically bind targets.25,26 Aptamers exhibit many unique merits over traditional antibodies such as small size, ease of modification, good stability (structural stability in response to physical changes such as pressure, temperature, pH, metal ions, etc.), and low dissociation rates.2,27–29 Thus, nucleic acid aptamers are considered as promising candidates for the construction of electrochemical sensors, fluorescent aptamers sensors and colorimetric sensors.30,31
FRET can be defined as an energy transfer process between an energy donor and an energy acceptor. In well-designed FRET-based biosensors, donor and acceptor are closely linked by antibody/antigen interaction or DNA hybridization.32,33 In recent years, Ag, Pd, Au, Pt and other nanomaterials have become excellent substitutes for immobilized carriers of various enzymes and labeled materials such as enzymes due to their large surface area, high catalytic activity, good stability and easy electron transfer.34–36 Gold nanoparticles (AuNPs), are mainly used as colorimetric materials and fluorescent quenching agents, as AuNPs not only exhibit strong distance-dependent optical properties, but also have excellent quenching efficiency over a wide wavelength range.37 Inorganic semiconductor quantum dots (QDs) synthesized in the aqueous phase such as CdX (X: Se, Te, S) have been reported to be successfully coupled to many biomolecules (proteins, peptides, nucleic acids, aptamers) due to they are easily functionalized with biomolecules.38–40 QDs and AuNPs pairs are unique energy transfer modes as donors and acceptors, respectively, which are favored by FRET systems due to their simpler preparation and high-efficiency energy transfer.41
To date, other FRET systems have been developed for TB detection. Du, Wang, Chang, Chen, Chi et al. reported FRET aptasensors for TB detection. Their FRET biosensing system offers the advantages of simple synthesis, excellent performance, better performance, good biocompatibility, high specificity and sensitivity.42–46 The aptasensor we designed utilizes DNA double-strand hybridization to achieve faster and better thrombin detection, with better stability, specificity and simpler operation.
In this work, a fluorescence aptasensor based on FRET between CdS QDs and AuNPs for detection of trace thrombin have been developed. Amino modified apt conjugated with the –COOH of the CdS QDs donors to produce CdS QDs-apt, while the AuNPs acceptors were coupled of the thiol-modified cDNA. CdS QDs and AuNPs were closely combined by DNA hybridization in apt and cDNA to form CdS QDs-apt/cDNA-AuNPs bioconjugations, thereby resulting in the occurrence of FRET effectively and a dramatic fluorescence quenching of CdS QDs (turn off). However, when thrombin was present, the apt preferentially binded to specific target, thereby triggering the formation of the G-quadruplex.22,37,47,48 As a result, AuNPs would dissociate from the CdS QDs-apt/cDNA-AuNPs bioconjugations, led to the result that DNA duplex was disassembled and FRET was prohibited. Thus recovered the fluorescence of CdS QDs (turn on) to some extent (Scheme 1).
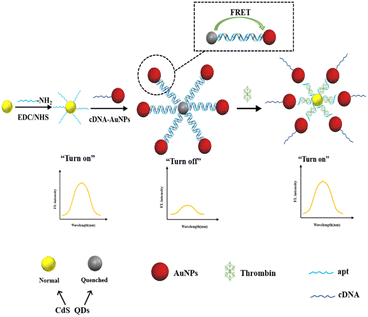 | ||
| Scheme 1 The sensing mechanism of the proposed CdS QDs-apt/cDNA-AuNPs FRET switch for thrombin detection. | ||
2. Experiment
2.1 Reagents
Sodium sulfide (Na2S), tris(2-carboxyethyl)phosphine hydrochloride (TCEP), chromic chloride (CdCl2) were purchased from Aladdin Co. Ltd. N-Hydroxysuccinimide (NHS), 1-ethyl-3-(3-dimethylaminopropyl)carbodiimide hydrochloride (EDC), mercaptoacetic acid (TGA) were supplied from Sigma-Aldrich Co. Ltd., USA; sodium hydroxide (NaOH), chloroauric acid (HAuCl4·4H2O), sodium chloride (NaCl), trisodium citrate dihydrate (C6H5Na3O7·2H2O) were gained from Sinopharm Chemical Reagent Co. Ltd., China; thiol-modified cDNA: 5′-CCA ACC ACA GTG–C6SH-3′ and amino-modified aptamer: 5′-NH2C6–TTT TTT CAC TGT GGT TGG TGT GGT TGG-3′ were obtained from Sangon Biotech Co. Ltd. (Shanghai, China).2.2 Apparatus
The UV-vis absorption spectra were recorded using Lambda 950 spectrophotometer (PerkinElmer Inc., USA). The morphological evaluations were characterized by JEM-2100F transmission electron microscopy (JEOL, Tokyo, Japan). Fluorescence (FL) spectra were obtained with RF-6000 Fluorescence Spectrometer (Shimadzu, Japan). The X-ray photoelectron spectrometer was conducted on ESCALAB 250Xi X-ray photoelectron spectroscopy (Reonicolai Inc., USA). Fluorescence lifetime spectra are determined by FLS 980 Fluorescence spectrometer (Tenmei, Edinburgh). The zeta potential were measured by nano particle size and zeta potential analyzer (Marvin, Shanghai, China).2.3 Preparation of AuNPs
Referring to the literature.49,50 The mixture of HAuCl4 (1 mL, 1 wt%) and water (99 mL) was transferred to a tri-neck flask that had been immersed overnight in aqua regia (note: as aqua regia is highly corrosive, we should use it in the fume hood and wear personal protective equipment). It was then boiled in an oil bath and refluxed at 100 °C. When the first drop of reflux appeared, C6H5Na3O7·2H2O (2.5 mL, 1 wt%) was quickly added upon vigorous stirring. The mixture turned Burgundy in color and then boiled for 15 min until it no longer changed color. It was cooled to room temperature by constant stirring. Finally, the AuNPs were obtained and stored in a refrigerator at 4 °C for further use.2.4 Conjugation of cDNA on AuNPs
cDNA was conjugated on AuNPs using the reported protocols.50,51 160 μL (10 μmol L−1) of cDNA was incubated in TCEP (80 μL) for 1 h to reduce disulfide bonds. Then 2 mL of AuNPs were added and incubated for 24 h at room temperature in the dark. During incubation, 200 μL of NaCl (0.5 mol L−1) solution was added in four portions to age AuNPs, followed by centrifugation for 20 min at 10![[thin space (1/6-em)]](https://www.rsc.org/images/entities/char_2009.gif) 000 rpm. Finally, collected and washed the lower red precipitate of cDNA-AuNPs with Tris–HCl (10 mmol L−1, pH = 7.4) buffer for three times, and then the cDNA-AuNPs were re-dispersed with 3 mL Tris–HCl buffer and kept at 4 °C before subsequent experiments.
000 rpm. Finally, collected and washed the lower red precipitate of cDNA-AuNPs with Tris–HCl (10 mmol L−1, pH = 7.4) buffer for three times, and then the cDNA-AuNPs were re-dispersed with 3 mL Tris–HCl buffer and kept at 4 °C before subsequent experiments.
2.5 Preparation of CdS QDs and CdS QDs-apt
CdS QDs were prepared as previous report.52 100 mL 0.01 mol per L CdCl2 and 500 μL TGA were introduced to a 250 mL tri-neck flask. Adjust pH to 11.0 by NaOH (1 mol L−1) and removed oxygen through nitrogen for 30 min. Then added 10.0 mL 0.1 mol per L Na2S and refluxed at 100 °C for 4 h under nitrogen atmosphere. CdS QDs were obtained and kept at 4 °C.Apt was modified to the surface of CdS QDs by EDC/NHS coupling reaction. Subsequently, 2 mL of CdS QDs were mixed with 500 μL EDC (400 mmol L−1) and 500 μL NHS (40 mmol L−1) in Tris–HCl buffer solution. Then, 100 μL of apt (10 μmol L−1) was added to the above solution and reacted at 4 °C for 12 h in refrigerator. Unbound apt and CdS QDs were removed by centrifugation and the precipitates were washed three times with Tris–HCl buffer. The CdS QDs-apt were therefore obtained and dispersed into 3 mL Tris–HCl buffer for further use.
2.6 Detection of thrombin
CdS QDs-apt (200 μL) and cDNA-AuNPs (400 μL) were mixed and incubated at 37 °C in thermostatic culture oscillator for 40 min. Then different concentrations of thrombin (200 μL) were added into above mixed solution and continued to incubate for 20 min. The mixture was diluted to 1 mL with Tris–HCl buffer. Its fluorescence spectra were measured at an excitation wavelength of 445 nm.2.7 Actual sample handling
Serum sample (received from Jinhua City Central Hospital, China) was pretreated by simple centrifugation. The diluted 100-fold human serum containing spiked thrombin was performed under optimal experimental conditions as described above.3. Results and discussion
3.1 TEM characterization
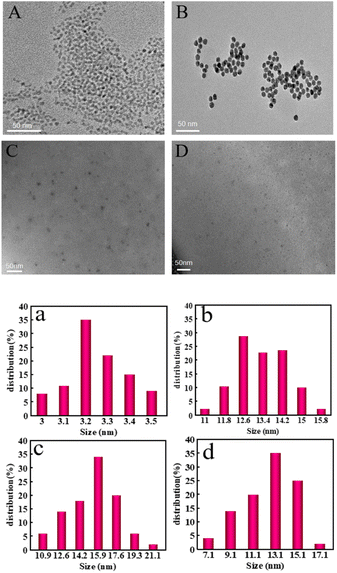
The morphology of CdS QDs, AuNPs, CdS QDs-apt/cDNA-AuNPs and CdS QDs-apt/cDNA-AuNPs@TB were checked via high-resolution TEM images. As can be seen from TEM images and particle size distribution in Fig. 1, the shape of CdS QDs, AuNPs, CdS QDs-apt/cDNA-AuNPs and CdS QDs-apt/cDNA-AuNPs@TB all exhibited spherical or ellipsoid and were in the dispersion state (Fig. 1A–D). According to the results of particle size calculation, the particle size of CdS QDs (Fig. 1a), AuNPs (Fig. 1b), CdS QDs-apt/cDNA-AuNPs (Fig. 1c) and CdS QDs-apt/cDNA-AuNPs@TB (Fig. 1d) was about 3.2, 12.6, 15.9 and 13.1 nm, respectively. Compared with the particle size of AuNPs, the particle size of CdS QDs-apt/cDNA-AuNPs had slightly increased which indirectly proved that cDNA-AuNPs have been combined with CdS QDs-apt successfully. However, the particle size of CdS QDs-apt/cDNA-AuNPs decreased after the introduction of thrombin, it may be that in the presence of thrombin, the aptamer on the CdS QDs-apt preferred to bind with its specific target to trigger the formation of the G-quadruplex that caused AuNPs receptor to detach from the CdS QDs-apt/cDNA-AuNPs bioconjugations.3.2 Fluorescence, XPS and FTIR spectra of CdS QDs and CdS QDs-apt
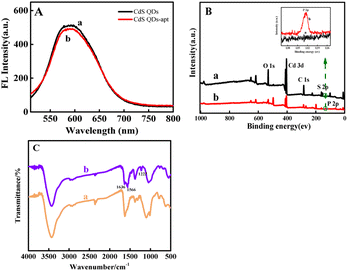
Fig. 2A displayed the fluorescence spectra of CdS QDs (a) and CdS QDs-apt (b) hardly changes. Fig. 2B showed XPS images of CdS QDs (a) and CdS QDs-apt (b). The characteristic peaks of Cd 3d, S 2p, C 1s and O 1s can be clearly observed near 405, 160, 285, 404 and 530 eV, respectively. Additionally, high-resolution XPS spectra of P 2p before and after apt combined with CdS QDs were analyzed in inset of Fig. 2B. Comparing curve a and b, presence of P 2p peak at 132.4 eV for CdS QDs-apt was acquired while the CdS QDs did not exhibited this peak, which may be attributed to the phosphate skeleton of the apt.41,53 In addition, FTIR spectra of CdS QDs (a) and CdS QDs-apt (b) were also investigated in Fig. 2C, the characteristic peaks of CdS QDs-apt at 1636 (C![[double bond, length as m-dash]](https://www.rsc.org/images/entities/char_e001.gif) O) and 1566 cm−1 (C–N) correspond to the amide I (1700–1600 cm−1) and amide II bands (1600–1500 cm−1),54,55 respectively, which indicated the existence of amide groups in prepared CdS QDs-apt. The characteristic peak at 1222 cm−1 corresponds to the base of the apt.56 The results indicated that the apt had been bound to the CdS QDs surface.
O) and 1566 cm−1 (C–N) correspond to the amide I (1700–1600 cm−1) and amide II bands (1600–1500 cm−1),54,55 respectively, which indicated the existence of amide groups in prepared CdS QDs-apt. The characteristic peak at 1222 cm−1 corresponds to the base of the apt.56 The results indicated that the apt had been bound to the CdS QDs surface.
3.3 UV-vis and zeta potential characterization
Binding of cDNA to AuNPs was accomplished through the Au–S bond.57,58 Fig. S1A† exhibited the UV-vis absorption spectra of (a) free DNA, (b) AuNPs, (c) cDNA-AuNPs, from which it can be observed that AuNPs had a well-defined surface plasmon resonance (SPR) at 519 nm band, confirming the formation of spherical AuNPs with a narrow size distribution (curve b).32,59 For comparison with curve a and b, curve c has both characteristic absorption peaks at 260 and 519 nm, demonstrating the successful preparation of cDNA-AuNPs bioconjugation. Furthermore, the zeta potential of CdS QDs, CdS QDs-apt, AuNPs, cDNA-AuNPs and CdS QDs-apt/cDNA-AuNPs were shown in Fig. S1B.† Modified by apt and cDNA, CdS QDs-apt and cDNA-AuNPs had more negative zeta potential relative to that of CdS QDs and AuNPs in similar environment, and the negative transfer was attributed to the negative charge of apt and cDNA. Compared with the zeta potential of CdS QDs-apt and cDNA-AuNPs, CdS QDs-apt/cDNA-AuNPs has more negative zeta potential, demonstrated that cDNA-AuNPs had conjugated with CdS QDs-apt.3.4 Sensing mechanism
As can be seen in Fig. S2A,† the absorption spectrum of AuNPs overlapped completely with the fluorescence spectrum of CdS QDs which provided the possibility for FRET occurred from CdS QDs to AuNPs. Curve a and b in Fig. S2B† were the fluorescence spectra of CdS QDs absence or presence AuNPs. No strong fluorescence quenching was observed of CdS QDs, only less than 50% quenching. By DNA hybridization within apt and cDNA could bring CdS QDs tight combination of CdS QDs and AuNPs to form CdS QDs-apt/cDNA-AuNPs bioconjugations that benefited to make the FRET occurrence, resulting in the fluorescence quenched almost completely at 593 nm (Fig. S2B,† curve c) (“turn off”), confirmed that the distance between donor and acceptor was another key factor in the efficient FRET effect.33,60 However, when thrombin was present, the apt preferentially bind to its specific target to trigger G-quadruplex formation that caused AuNPs receptor to detach from the CdS QDs-apt/cDNA-AuNPs bioconjugations and the DNA duplex to be disassembled. The process would inhibit FRET and promoted fluorescence recovery (“turn on”) (Fig. S2B,† compare curve c and d). Additionally, the changes in each step can also be clearly observed through photographs of the luminescence by shining a UV lamp. The CdS QDs had an orange fluorescence and there was no significant change after adding the aptamer (centrifugal tube a, b, Fig. S2C†). The orange fluorescence of CdS QDs was quenched by adding cDNA-AuNPs (centrifugal tube c, Fig. S2C†) and the fluorescence of CdS QDs gradually recovered with the increase of thrombin concentration (centrifugal tube d–f, Fig. S2C†).In addition, to further determine the type of quenching mechanism, the fluorescence lifetimes of CdS QDs-apt were measured in the presence and absence of cDNA-AuNPs (Fig. S3†). The results revealed that the fluorescence lifetime of CdS QDs-apt was shortened by 2 ns in the presence of cDNA-AuNPs (Table 1 in ESI†), indicating the type of quenching followed the dynamic quenching mechanism.
3.5 Optimization of experimental conditions
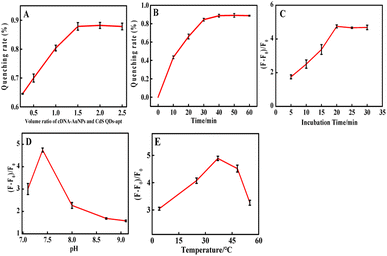
Conditions were optimized for critical parameters such as the volume ratio of cDNA-AuNPs and CdS QDs-apt, pH, reaction temperature and time. As shown in Fig. 3A, the fluorescence quenching rate was increased notably upon the increasing volume ratio of cDNA-AuNPs to CdS QDs-apt until it reached the quenching equilibrium of 3![[thin space (1/6-em)]](https://www.rsc.org/images/entities/char_2009.gif) :
:![[thin space (1/6-em)]](https://www.rsc.org/images/entities/char_2009.gif) 2. Thus, 2
2. Thus, 2![[thin space (1/6-em)]](https://www.rsc.org/images/entities/char_2009.gif) :
:![[thin space (1/6-em)]](https://www.rsc.org/images/entities/char_2009.gif) 1 was selected as the optimal volume ratio of cDNA-AuNPs to CdS QDs-apt for subsequent experiments.
1 was selected as the optimal volume ratio of cDNA-AuNPs to CdS QDs-apt for subsequent experiments.
Fig. 3B showed the relationship of fluorescence quenching with the hybridization reaction time between aptamer and cDNA. It can be seen that the quenching equilibrium was almost reached when the reaction time reaches 30 minutes. Therefore, 40 min was chosen as the hybridization time. Fig. 3C exhibited that the fluorescence recovery was gradually increased with the increasing of incubation time, 20 min to reach fluorescence recovery maximum and tend to balance. On this basis, 25 min was selected as the optimal time for the biological coupling of thrombin to CdS QDs-apt/cDNA-AuNPs.
Fig. 3D and E displayed that the effect of pH and incubation temperature for the fluorescence recovery. A maximum fluorescence recovery was obtained when the pH was 7.4 and the incubation temperature was 37 °C. Therefore, 0.1 mol per L Tris–HCl buffer at pH 7.4, incubation temperature at 37 °C were applied for subsequent experiments. This is consistent with the optimum temperature for the catalytic behaviour of the enzyme.61
3.6 Analytical performance
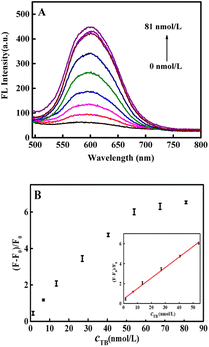
As shown in Fig. 4A, the fluorescence intensity gradually increased with increasing thrombin concentration. Fig. 4B demonstrated that a good linear relationship of the fluorescence recovery with the concentration of thrombin in the range of 1.35 to 54.0 nmol L−1. The linear equation was y = 0.1050x + 0.4600 (R2 = 0.9974) and the detection limit (LOD) was 0.38 nmol L−1 (S/N = 3, n = 9). To demonstrate the superiority of the fluorescence aptasensor, it was compared with previous thrombin assays reported in the literature and the results are shown in Table 1. It can be clearly seen that the fluorescence aptasensor designed in this paper had a wider detection range and lower detection limits, indicated that the proposed fluorescence aptasensor has broad application prospects because of its low cost and high sensitivity.3.7 Selectivity, stability
To investigate the specificity of the fluorescence aptasensor for thrombin, we selected other similar proteins including glucose oxidase (GOX), horseradish peroxidase (HRP), bovine serum albumin (BSA) and biologically relevant inorganic cations (Na+, Mg2+, K+, Ca2+, Fe3+, Cu2+) as interfering substances (except for 54 nmol per L thrombin, all substances were used at a concentration of 1 μM). As shown in Fig. 5A. It was revealed that these similar proteins and biologically relevant inorganic cations had little effect on the determination of thrombin, illustrating that the developed fluorescence aptasensor had excellent specificity for thrombin (for more details, see Fig. S4†).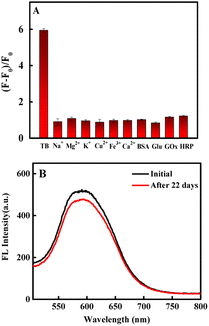 | ||
| Fig. 5 (A) Selectivity of the fluorescence aptasensor (each sample was measured in parallel three times). (B) Stability of CdS QDs-apt. | ||
To investigate the long-term stability of the fluorescence aptasensor, the fluorescence intensity was detected after keeping the CdS QDs-apt in a 4 °C refrigerator every 22 days. The fluorescence decreased by only 7.9% (Fig. 5B), indicating the high stability of the synthesized fluorescence aptasensor.
3.8 Real samples analysis and recovery
As can be seen from Table 2. No thrombin detected in human serum and the recoveries were observed to be 98.60–102.2%. The method had good sensing capability for complex biological samples.| Samples | Detected (nmol L−1) | Added (nmol L−1) | Founded (nmol L−1) (x ± SD, n = 3) | Recovery (%) (x ± SD, n = 3) |
|---|---|---|---|---|
| Human serum | 0.00 | 5.00 | 4.93 ± 0.42 | 98.60 ± 0.08 |
| 20.00 | 20.43 ± 0.18 | 102.2 ± 0.01 | ||
| 40.00 | 40.32 ± 0.46 | 100.8 ± 0.01 |
4. Conclusions
In general, we designed a novel off–on fluorescence aptasensor based on FRET between CdS QDs and AuNPs. Strikingly, the fluorescence aptasensor exhibited a wider linear range and a lower LOD, reflecting the excellent sensitivity and selectivity towards thrombin detection. Eventually on account of the facile design, this sensing strategy can be conceivably extended to a variety of targets for which appropriate aptamers are available. Therefore, it can be easily extended and it has a potential to be applied for detecting other molecules.Author contributions
Conceptualization, P. L., X. C. and C. L.; methodology, P. L., X. C. and C. L.; data curation, P. L.; formal analysis, P. L. and C. H.; writing—original draft, P. L.; writing—review and editing, P. L. All authors have read and agreed to the published version of the manuscript.Conflicts of interest
The authors declare that they have no competing financial interests or personal relationships that could have appeared to influence the work reported in this paper.Acknowledgements
The authors gratefully acknowledge the support for this research from the National Natural Science Foundation of China (21575129).Notes and references
- V. Tutwiler, A. D. Peshkova, G. Le Minh, S. Zaitsev, R. I. Litvinov, D. B. Cines and J. W. Weisel, J. Thromb. Haemostasis, 2019, 17, 361–370 CrossRef PubMed
.
- Y. X. Chen, K. J. Huang, L. L. He and Y. H. Wang, Biosens. Bioelectron., 2018, 100, 274–281 CrossRef CAS PubMed
.
- W. Tao, Y. Zhang, T. Hou, Y. Zhang and S. Wang, Anal. Methods, 2018, 10, 4178–4182 RSC
.
- R. Troisi, N. Balasco, I. Autiero, L. Vitagliano and F. Sica, Int. J. Mol. Sci., 2021, 22, 10803 CrossRef CAS PubMed
.
- M. Sillen and P. J. Declerck, Int. J. Mol. Sci., 2021, 22, 3690 CrossRef PubMed
.
- N. Jaberi, A. Soleimani, M. Pashirzad, H. Abdeahad, F. Mohammadi, M. Khoshakhlagh, M. Khazaei, G. A. Ferns, A. Avan and S. M. Hassanian, J. Cell. Biochem., 2019, 120, 4757–4765 CrossRef CAS PubMed
.
- A. Nishino, M. Suzuki, H. Ohtani, O. Motohashi, K. Mezawa, H. Nagura and T. Yoshimoto, J. Neurotrauma, 2009, 10, 167–179 CrossRef PubMed
.
- J. Iannucci, W. Renehan and P. Grammas, Front. Neurosci., 2020, 14, 762 CrossRef PubMed
.
- K. Grossmann, Int. J. Mol. Sci., 2021, 22, 4805 CrossRef CAS PubMed
.
- J. Yang, B. Dou, R. Yuan and Y. Xiang, Anal. Chem., 2016, 88, 8218–8223 CrossRef CAS PubMed
.
- X. Wang, F. Gao, Y. Gong, G. Liu, Y. Zhang and C. Ding, Talanta, 2019, 205, 120140 CrossRef CAS PubMed
.
- S. Chen, P. Liu, K. Su and X. Li, Biosens. Bioelectron., 2018, 99, 338–345 CrossRef CAS PubMed
.
- B. Qin and K. Yang, Microchim. Acta, 2018, 185, 407 CrossRef PubMed
.
- Y. Wang, F. Wang, Z. Han, K. Huang, X. Wang, Z. Liu, S. Wang and Y. Lu, Sens. Actuators, 2020, 304, 127418 CrossRef CAS
.
- Y. H. Wang, H. Xia, K. J. Huang, X. Wu, Y. Y. Ma, R. Deng, Y. F. Lu and Z. W. Han, Microchim. Acta, 2018, 185, 502 CrossRef PubMed
.
- Y. Guo, J. Zhang, W. Zhang and D. Hu, Microchim. Acta, 2019, 186, 1–8 CrossRef PubMed
.
- G. L. Wang, X. L. Hu, X. M. Wu, Y. M. Dong and Z. J. Li, Microchim. Acta, 2016, 183, 765–771 CrossRef CAS
.
- K. C. Lin, B. Jagannath, S. Muthukumar and S. Prasad, The Analyst, 2017, 142, 2770–2780 RSC
.
- S. A. Kurseev, A. M. Solovjev, M. M. Neumann, A. V. Medvedko and I. Y. Sakharov, Anal. Lett., 2020, 53, 140–151 CrossRef CAS
.
- L. Zhang and L. Li, Microchim. Acta, 2016, 183, 485–490 CrossRef CAS
.
- F. Gao, L. Du, D. Tang, Y. Lu and Y. Zhang, Biosens. Bioelectron., 2015, 66, 423–430 CrossRef CAS PubMed
.
- P. Zou, Y. Liu, H. Wang, J. Wu and F. Zhu, Biosens. Bioelectron., 2016, 79, 29–33 CrossRef CAS PubMed
.
- N. Jiang, T. Zhu and Y. Hu, Microchim. Acta, 2019, 186, 747 CrossRef CAS PubMed
.
- B. Lin, Y. Yu, Y. Cao, M. Guo, D. Zhu, J. Dai and M. Zheng, Biosens. Bioelectron., 2018, 100, 482–489 CrossRef CAS PubMed
.
- S. R. Yan, M. M. Foroughi, M. Safaei, S. Jahani and L. K. Foong, Int. J. Biol. Macromol., 2020, 155, 184–207 CrossRef CAS PubMed
.
- H. Liu, Y. Bai, J. Qin, H. Wang, Y. Wang, Z. Chen and F. Feng, Sens. Actuators, B, 2018, 256, 413–419 CrossRef CAS
.
- Y. Hou, J. Liu, M. Hong, X. Li, Y. Ma, Q. Yue and C. Z. Li, Biosens. Bioelectron., 2017, 92, 259–265 CrossRef CAS PubMed
.
- J. D. Munzar, A. Ng and D. Juncker, Chem. Soc. Rev., 2019, 48, 1390–1419 RSC
.
- X. Zhao, X. Dai, S. Zhao, X. Cui and B. Yu, Spectrochim. Acta, Part A, 2021, 247, 119038 CrossRef CAS PubMed
.
- K. Ling, J. Xu, Y. Xu, X. Yun and Y. Chai, Biosens. Bioelectron., 2013, 42, 193–197 CrossRef PubMed
.
- B. Jiang, M. Wang, Y. Chen, J. Xie and Y. Xiang, Biosens. Bioelectron., 2012, 32, 305–308 CrossRef CAS PubMed
.
- J. Qian, C. Wang, X. Pan and S. Liu, Anal. Chim. Acta, 2013, 763, 43–49 CrossRef CAS PubMed
.
- L. Xiang and J. Tang, RSC Adv., 2017, 7, 8332–8337 RSC
.
- M. Sharifi, S. H. Hosseinali, P. Yousefvand, A. Salihi and M. Falahati, Mater. Sci. Eng. C, 2020, 108, 110422 CrossRef CAS PubMed
.
- C. Shen, X. Xia, S. Hu, M. Yang and J. Wang, Anal. Chem., 2015, 87, 693–698 CrossRef CAS PubMed
.
- H. Lu, S. Yu, Y. Fan, C. Yang and D. Xu, Colloids Surf., B, 2013, 101, 106–110 CrossRef CAS PubMed
.
- L. Kuang, S. P. Cao, L. Zhang, Q. H. Li, Z. C. Liu, R. P. Liang and J. D. Qiu, Biosens. Bioelectron., 2016, 85, 798–806 CrossRef CAS PubMed
.
- K. E. Sapsford, W. R. Algar, L. Berti, K. B. Gemmill, B. J. Casey, E. Oh, M. H. Stewart and I. L. Medintz, Chem. Rev., 2013, 113, 1904–2074 CrossRef CAS PubMed
.
- K. E. Sapsford, K. M. Tyner, B. J. Dair, J. R. Deschamps and I. L. Medintz, Anal. Chem., 2011, 83, 4453–4488 CrossRef CAS PubMed
.
- Z. S. Pehlivan, M. Torabfam, H. Kurt, C. Ow-Yang, N. Hildebrandt and M. Yuce, Mikrochim. Acta, 2019, 186, 563 CrossRef CAS PubMed
.
- X. Lu, C. Wang, J. Qian and C. Ren, Anal. Chim. Acta, 2019, 1047, 163–171 CrossRef CAS PubMed
.
- C. Du, Y. Hu, Q. Zhang, Z. Guo, G. Ge, S. Wang, C. Zhai and M. Zhu, Biosens. Bioelectron., 2018, 100, 132–138 CrossRef CAS PubMed
.
- Y. Wang, L. Bao, Z. Liu and D.-W. Pang, Anal. Chem., 2011, 83, 8130–8137 CrossRef CAS PubMed
.
- H. Chang, L. Tang, Y. Wang, J. Jiang and J. Li, Anal. Chem., 2010, 82, 2341–2346 CrossRef CAS PubMed
.
- H. Chen, F. Yuan, S. Wang, J. Xu, Y. Zhang and L. Wang, Biosens. Bioelectron., 2013, 48, 19–25 CrossRef CAS PubMed
.
- C.-W. Chi, Y.-H. Lao, Y.-S. Li and L.-C. Chen, Biosens. Bioelectron., 2011, 26, 3346–3352 CrossRef CAS PubMed
.
- X. Zhang, R. Hu and N. Shao, Talanta, 2013, 107, 140–145 CrossRef CAS PubMed
.
- I. Smirnov and R. H. Shafer, Biochemistry, 2000, 39, 1462–1468 CrossRef CAS PubMed
.
- W. W. Ye, J. Y. Shi, C. Y. Chan, Y. Zhang and M. Yang, Sens. Actuators, B, 2014, 193, 877–882 CrossRef CAS
.
- Y. Wang, N. Gan, Y. Zhou, T. Li, Y. Cao and Y. Chen, Biosens. Bioelectron., 2017, 87, 508–513 CrossRef CAS PubMed
.
- X. Zhang, M. R. Servos and J. Liu, J. Am. Chem. Soc., 2012, 134, 7266–7269 CrossRef CAS PubMed
.
- G. L. Wang, J. J. Xu and H. Y. Chen, Nanoscale, 2010, 2, 1112–1114 RSC
.
- C. Wang, J. Qian, K. An, X. Huang, L. Zhao, Q. Liu, N. Hao and K. Wang, Biosens. Bioelectron., 2017, 89, 802–809 CrossRef CAS PubMed
.
- C. Stani, L. Vaccari, E. Mitri and G. Birarda, Spectrochim. Acta, Part A, 2020, 229, 118006 CrossRef CAS PubMed
.
- D. Bahari, B. Babamiri, A. Salimi and H. Salimizand, Talanta, 2021, 221, 121619 CrossRef CAS PubMed
.
- Y. He, B. Zhang and Z. Fan, Mikrochim. Acta, 2018, 185, 163 CrossRef PubMed
.
- X. Zhang, M. R. Servos and J. Liu, J. Am. Chem. Soc., 2012, 134, 7266–7269 CrossRef CAS PubMed
.
- J. Li, T. Yang, W. H. Chan and M. Choi, J. Phys. Chem. C, 2013, 117, 19175–19181 CrossRef CAS
.
- J. Qian, C. Ren, C. Wang, K. An, H. Cui, N. Hao and K. Wang, Biosens. Bioelectron., 2020, 166, 112443 CrossRef CAS PubMed
.
- J. Qian, K. Wang, C. Wang, M. Hua, Z. Yang and Q. Liu, Analyst, 2015, 140, 7434–7442 RSC
.
- S. Jiao, R. Zhang, Y. Yin, S. Zhong and Z. Liu, RSC Adv., 2019, 9, 28814–28822 RSC
.
- L. Wang, W. Yang, T. Li, D. Li, Z. Cui, Y. Wang, S. Ji, Q. Song, C. Shu and L. Ding, Mikrochim. Acta, 2017, 184, 3145–3151 CrossRef CAS
.
- X. Rao, J. Zhang, J. Cui, Y. Hu, T. Liu, J. Chai and G. Cheng, Chem. Res. Chin. Univ., 2013, 29, 868–873 CrossRef CAS
.
- T. Li, E. Wang and S. Dong, Chem. Commun., 2008, 31, 3654–3656 RSC
.
- Y. Liu, X. Jiang, W. Cao, J. Sun and F. Gao, Sensors, 2018, 18, 589 CrossRef PubMed
.
Footnote |
| † Electronic supplementary information (ESI) available. See DOI: https://doi.org/10.1039/d2ra06891e |
| This journal is © The Royal Society of Chemistry 2022 |

