 Open Access Article
Observation of “de Vries-like” properties in bent-core molecules†
Supreet
Kaur‡
 a,
Abinash
Barthakur‡
 b,
Golam
Mohiuddin‡§
 a,
Santosh Prasad
Gupta
c,
Surajit
Dhara
 b and
Santanu Kumar
Pal
 *a
*a
aIndian Institute of Science Education and Research (IISER) Mohali, Sector-81, Knowledge City, Manauli 140306, India. E-mail: skpal@iisermohali.ac.in
bSchool of Physics, University of Hyderabad, Hyderabad-500046, India
cDepartment of Physics, Patna University, Patna-800005, India
First published on 18th January 2022
Abstract
“de Vries” liquid crystals, defined by a maximum layer shrinkage of ≤1% from the smectic A to C phase transition, are an integral component of ferroelectric liquid crystal (FLC) displays. Bona fide de Vries materials described in the literature are primarily perfluorinated, polysiloxane and polysilane-terminated rod-like (or calamitic) LCs. Herein, for the first time, we report a series of newly designed achiral unsymmetrical bent-core molecules with terminal alkoxy chains exhibiting similar properties to “de Vries” LCs. The new molecular structure is based on the systematic distribution of four phenyl rings attached via ester and imine linkers having 3-amino-2-methylbenzoic acid as the central core with a bent angle of 147°. Detailed microscopic investigations in differently aligned (planar as well as homeotropic) cells along with SAXS/WAXS studies revealed that the materials exhibited a SmA–SmC phase sequence along with the appearance of the nematic phase at higher temperatures. SAXS measurements divulged the layer spacings (d-spacings) and hence, the layer shrinkage was calculated ranging from 0.19% to 0.68% just below the SmA–SmC transition. The variation of the calculated molecular tilt angle (α) derived from the temperature-dependent SAXS data, followed the power law with exponent values 0.29 ± 0.01 and 0.25 ± 0.01 for compounds 1/10 and 1/12, respectively. The experimental values obtained were very close to the theoretically predicted values for the materials with de Vries-like properties. The analysis of temperature-dependent birefringence studies based on the prediction of the Landau theory, showed a dip across the SmA–SmC phase transition typical of compounds exhibiting the de Vries characteristics. The collective results obtained suggest “de Vries” SmA as a probable model for this bent-core system which may find applications in displays.
Introduction
The supramolecular self-assembly, in general, depends on the nanosegregation of incompatible fragments of the component molecules determined by the virtual molecular shape and geometry. In liquid crystals (LCs) with long range fluidic order, the nucleation of the lamellar smectic phase, mainly, is compelled by the nanosegregation of the electron dense aromatic ring and flexible hydrophobic aliphatic chain of the constituent molecules.1 In the smectic A (SmA) phase the orientational axis and translational order axis are equivalent, with parallel director (n) and layer normal (z) whereas in the smectic C (SmC) phase, n is tilted respective to z by a tilt angle α (Fig. 1) which is temperature dependent. The layer spacing in SmC (dC) is smaller (by cos![[thin space (1/6-em)]](https://www.rsc.org/images/entities/char_2009.gif) α) than that in the SmA phase (dA) by virtue of the tilt. Usually, the phase transition from SmA to SmC is accompanied by 7–10% layer shrinkage that has been a real difficulty in the preparation of chiral SmC mixtures for ferroelectric LC (FLC) displays.2 FLCs are primarily known for their fast switching speed (electro-optic response) that is potentially used in display technology.3–6 The higher layer shrinkage induces chevron formation that leads to folding instabilities of the smectic layer structures or zig-zag defects.7–9 These defects degrade the brightness and contrast i.e., the optical quality of the surface-stabilized FLC (SSFLC) display devices and act as a blockade in the development and application of FLCs in technology. This issue increased the need to develop novel materials with negligible layer shrinkage at the SmA–SmC transition, known as “de Vries” LCs. Adriaan de Vries proposed a model in which the SmA phase has a lamellar structure with tilted molecular orientations of the mesogens and random azimuthal distribution. As per the model, the SmA–SmC phase transition is described as an ordering of the azimuthal distribution resulting in zero layer contraction (Fig. 1).10 Reports show that a substantial amount of “de Vries” LC materials have been prepared but all of them consist of rod-like (or calamitic) molecules mainly with polysiloxane11–16 and polysilane17–20 terminal chains. The nanosegregation of domains due to the immiscible chemically different sub-units i.e., electron dense aromatic rings and flexible hydrophobic aliphatic chains, has a crucial impact on lamellar ordering in the smectic phase.
α) than that in the SmA phase (dA) by virtue of the tilt. Usually, the phase transition from SmA to SmC is accompanied by 7–10% layer shrinkage that has been a real difficulty in the preparation of chiral SmC mixtures for ferroelectric LC (FLC) displays.2 FLCs are primarily known for their fast switching speed (electro-optic response) that is potentially used in display technology.3–6 The higher layer shrinkage induces chevron formation that leads to folding instabilities of the smectic layer structures or zig-zag defects.7–9 These defects degrade the brightness and contrast i.e., the optical quality of the surface-stabilized FLC (SSFLC) display devices and act as a blockade in the development and application of FLCs in technology. This issue increased the need to develop novel materials with negligible layer shrinkage at the SmA–SmC transition, known as “de Vries” LCs. Adriaan de Vries proposed a model in which the SmA phase has a lamellar structure with tilted molecular orientations of the mesogens and random azimuthal distribution. As per the model, the SmA–SmC phase transition is described as an ordering of the azimuthal distribution resulting in zero layer contraction (Fig. 1).10 Reports show that a substantial amount of “de Vries” LC materials have been prepared but all of them consist of rod-like (or calamitic) molecules mainly with polysiloxane11–16 and polysilane17–20 terminal chains. The nanosegregation of domains due to the immiscible chemically different sub-units i.e., electron dense aromatic rings and flexible hydrophobic aliphatic chains, has a crucial impact on lamellar ordering in the smectic phase.
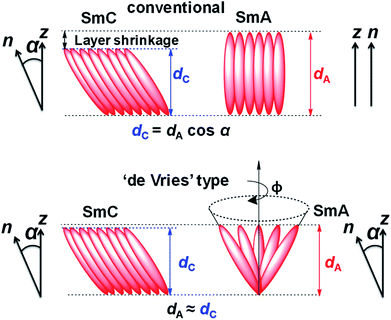 | ||
| Fig. 1 Schematic representation of SmA and SmC phases according to the conventional rigid-rod model and the diffuse cone model as proposed by de Vries.10 | ||
Unsymmetrical bent-core molecules or hockey-stick shaped molecules, renowned for their potential physical properties for device applications, such as nematic ferroelectricity,21 cybotactic nematic phases,22–26 formation of a polarization modulated layer undulated phase structure,27–30 and a long range blue phase with a high Kerr constant,31 barely exhibit “de Vries-like” behaviour. In the past two decades, miscellaneous hockey-stick shaped mesogens (composed of four or more phenyl rings) have been explored. Due to the intermediate mesogenic properties of calamitic and bent-core LCs, they exhibit formation of distinct phases viz. dark conglomerate,32–34 biaxial nematic,35–37 twist-bend nematic38–42 and cluster phases.25,43,44 In the field of bent-core LCs, there are very few reports, mostly in a scattered way that describe “de Vries-like” characteristics.45–49 Bent-core or hockey-stick shaped LCs with their exceptional physical characteristics, if showed “de Vries-like” behaviour, could be a tremendous advantage for FLC display technology.
Here, we report the design and synthesis of unsymmetrical bent-core molecules that show unconventional temperature dependence of layer spacing and birefringence which are hitherto unobserved in bent-core systems. In particular, the compounds exhibit low layer shrinkage (0.19% to 0.68%) upon the SmA–SmC phase transition, typically observed in de Vries calamitic liquid crystals. However, in contrast to the conventional de Vries system, these bent-core molecules exhibit a high temperature nematic phase. The detailed analysis from extensive polarizing optical microscopic studies, SAXS/WAXS measurements and temperature-dependent birefringence studies (vide infra) reinforces “de Vries” SmA as a probable model for this bent-core system.
Experimental
Synthesis and characterization
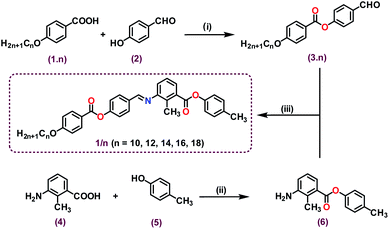
The bent-core molecules under investigation (designated as 1/n) were derived from 3-amino-2-methylbenzoic acid as the central core with two oppositely directed esters and an imine bond as linking units (Scheme 1). The molecules resemble unsymmetrical bent-core or hockey-stick shaped architecture with variable alkoxy chains (n = 10, 12, 14, 16, 18) at the molecular long arm and a –CH3 moiety at the end of the short arm. The bent angle of 147° was in accordance with similar type of molecules.22,23 The synthetic route for the final compounds is presented in Scheme 1 and the details are included in the ESI (Fig. S1–S17†). In our previous report with similar molecular architecture (terminal –CN and –OCH3 moieties at the molecular short arm),23 only nematic and SmA phases were observed without any SmC transition, but here, interestingly, we noticed the tilted phase beneath the SmA phase.Results and discussion
Thermal behaviour
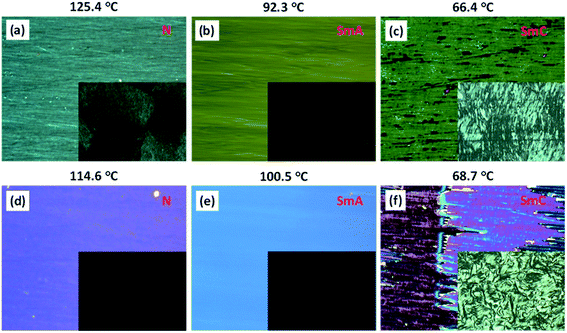
The mesophase characterizations were performed with a polarizing optical microscope (POM) and a differential scanning calorimeter (DSC). All the compounds (1/10, 1/12, 1/14, 1/16, 1/18) exhibited a isotropic–nematic–SmA–SmC phase sequence during cooling from isotropic liquid. Under a POM (with crossed polarizers), the compounds exhibited homeotropic/dark appearance when sandwiched between an untreated glass slide and a coverslip. To determine the exact nature of the mesophases, systematic microscopic investigations were carried out in homogeneous (planar) as well as homeotropic anchoring cells with different cell gaps purchased from INSTEC, USA.For a representative case, compounds 1/10 and 1/12 are discussed here. In a planar anchoring cell (PI-coated ITO cell with a 4.8 μm cell gap), compound 1/10 exhibited birefringent textures (137.0 °C onwards) when cooled into the nematic phase (Fig. 2a and S18b†) that subsequently changed to a defect-free SmA phase at 93.0 °C (Fig. 2b and S18c†). Gradually, the SmA phase underwent a transition to the SmC phase at 81.0 °C as evident from the increasing of defects in the texture (Fig. 2c and S18d†). The SmA–SmC phase transition was further established by employing a homeotropic cell (cell gap 3.3 μm with ITO coating and an antiparallel rubbing direction). The black/dark texture of the SmA phase (Fig. 2b (inset) and S18c†) transformed to a birefringent Schlieren type texture confirming the presence of an underlying SmC phase (Fig. 2c (inset) and S18d†) which was retained until crystallization at 42.9 °C.
Compound 1/12, upon cooling from the isotropic phase, under planar anchoring conditions (3.2 μm cell gap), showed a birefringent nematic texture at 132.5 °C (Fig. 2d and S19b†) followed by appearance of a defect-free SmA phase (Fig. 2e and S19c†) at 106.0 °C. Continuous cooling led to the appearance of defects in the texture. At 91.0 °C, the SmC phase appeared with a change in optical texture (Fig. 2f and S19d†). When compound 1/12 was filled into a homeotropic cell (cell gap 3.3 μm with ITO coating and antiparallel rubbing direction), black/dark images were observed for the nematic and SmA phases (Fig. 2d, e (inset) and S19b, c†) whereas an underlying Schlieren texture with four brush defects (Fig. 2f (inset) and S19d†) was observed at the transition from the SmA to SmC phase. The appearance of birefringence with an exclusive four brush defect confirmed the presence of the SmC phase. The birefringent Schlieren images under homeotropic conditions were observed due to the tilt in the molecular axis (or optic axis) from the layer normal in the SmC phase. The microscopic description of the remaining three compounds 1/14, 1/16 and 1/18 is elaborated in the ESI (Fig. S20–S22†).
The transition temperatures and the associated enthalpies were determined by DSC studies (Table 1). Due to the low enthalpy of transition, the SmC phase was not observed in DSC thermograms (Fig. 3 and S23†) but texturally confirmed by the observations in POM in differently anchored cells and later by XRD experiments. The mesophase characterization suggested that the stability of smectic phases increased upon lengthening of the alkoxy chain (from n = 10 to 18). For a particular compound, the increase in the alkoxy chain favoured the SmC phase over the SmA phase. The structure–property relationship for the series 1/n, derived collectively from POM and DSC studies, is presented in the ESI (Fig. S24†).
| 1/n | Phase transition temperatures in °C (enthalpy in kJ mol−1) |
|---|---|
| a SmA/SmC phases observed in POM and XRD studies but not in DSC. [Cr = crystal, Iso = isotropic liquid, N = nematic, SmA = smectic A and SmC = smectic C phase]. | |
| 1/10 | Cr 110.8 °C (36.83) N 138.7 °C (0.32) Iso |
| Iso 137.0 °C (−0.26) N 93.0 °C SmAa 81.0 °C SmCa 42.9 °C (−19.0) Cr | |
| 1/12 | Cr1 66.6 °C (18.99) Cr2 88.7 °C (1.00) Cr3 93.9 °C (15.58) SmA 106.3 °C (0.04) N 135.5 °C (0.16) Iso |
| Iso 132.5 °C (−0.34) N 106.0 °C (−0.03) SmA 91.0 °C SmCa 40.9 °C (−23.02) Cr | |
| 1/14 | Cr 64.5 °C (27.37) SmA 109.3 °C (0.17) N 125.6 °C (0.32) Iso |
| Iso 123.4 °C (−0.46) N 108.0 °C (−0.08) SmA 84.0 °C SmCa 44.2 °C (−31.32) Cr | |
| 1/16 | Cr 69.7 °C (24.27) SmA 114.0 °C (0.35) N 123.3 °C (0.38) Iso |
| Iso 121.2 °C (−0.29) N 111.1 °C (−0.42) SmA 89.0 °C SmCa 60.0 °C (−28.08) Cr | |
| 1/18 | Cr 75.6 °C (34.52) SmC 117.0 °C (0.96) N 120.0 °C (0.30) Iso |
| Iso 117.2 °C (−0.62) N 114.4 °C (−1.06) SmA 94.0 °C SmCa 59.2 °C (−40.05) Cr | |
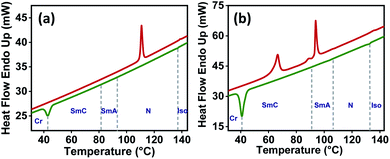 | ||
| Fig. 3 Representative DSC thermograms of compounds (a) 1/10 and (b) 1/12 recorded in the third heating (red) and third cooling (green) cycle (scan rate: 10 °C min−1). | ||
X-ray diffraction studies
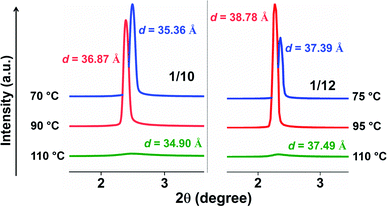
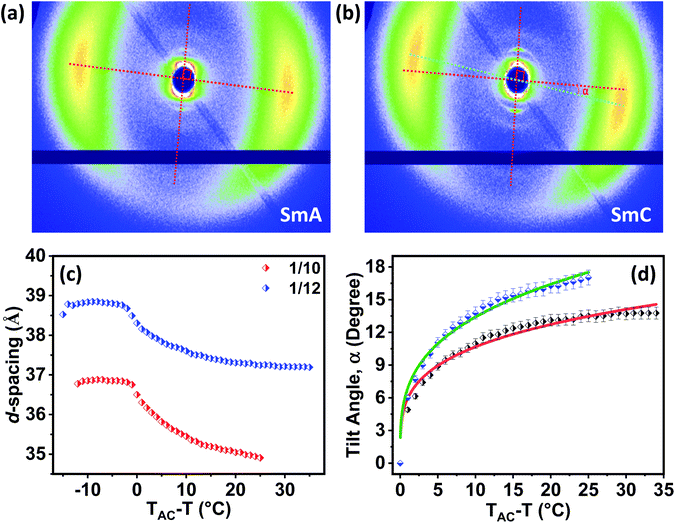
Exclusive information about the phase structure and layer shrinkage of the unsymmetrical bent-core compounds was obtained from the detailed X-ray diffraction (XRD) analysis. The XRD profile in the nematic range of the compounds 1/10 and 1/12 exhibited two diffuse peaks, one in the small angle region and another in the wide angle region as summarized in Tables S1 and S2,† respectively. Upon cooling, the small angle diffuse peak became sharp for both the compounds, indicative of the ordering of the aggregates in the sample. In the SmA phase range, we observed that the d-spacing (d-value) was always less than the corresponding calculated molecular length (L) i.e., d < L; in case of 1/10 the d-spacing value in the SmA range was 36.75–36.88 Å whereas the calculated value of L was 37.7 Å (i.e., d (=36.75–36.88 Å) < L (=37.7 Å)); in 1/12 the d-spacing value in the SmA range was 38.49–38.85 Å whereas the calculated value of L was 40.2 Å (i.e., d (=38.49–38.85 Å) < L (=40.2 Å)). The observation of d < L in the SmA phase range indicated the existence of a “de Vries-like” phase. Further cooling of the sample led to a small contraction in the layer until crystallization (Fig. 4). This was due to the appearance of a tilted SmC phase substantiated by the aforementioned extensive POM study. The calculated maximum layer shrinkage for compounds 1/10 and 1/12 was approximately 0.68% and 0.49%, respectively. Layer shrinkage was calculated using the formula: (dA − dC)/dA × 100, where, expressively, in 1/10, it was found to be (36.75 − 36.50)/36.75 × 100 = 0.68% and in 1/12, it was (38.49 − 38.30)/38.49 × 100 = 0.49%.50The variation of d-spacing in different phases is shown in Fig. 5c (Fig. S28†). The d-spacing increased from a low value in the N phase to a maximum in the SmA phase and then started to decrease in the SmC phase, with decreasing temperature. The SmA to SmC transition temperature (TAC) was found to be 81.0 °C and 91.0 °C for compounds 1/10 and 1/12, respectively. In the uniaxial SmA phase, n, the director, is parallel to the layer normal. But n develops a (polar) tilt angle (α) relative to the layer normal at the transition to the SmC phase. Moreover, α also varies with temperature. The nature of this phase transition from SmA to SmC depends on the variation of α along this transition.
Physically α is equal to the angular difference between the layer normal of the smectic phase and the orientation of the alkyl chains, and can be deduced from the 2D oriented XRD pattern (Fig. 5a, b and S26†). However, it is not possible to calculate α when the 2D X-ray diffraction pattern is un-oriented. Therefore, for better accuracy, the tilt angle (α) was calculated from the XRD pattern by using the relation: α = cos−1[dC/dAC] where dAC is the layer spacing corresponding to TAC temperature and dC is the layer spacing in the SmC phase. The spacing dC was calculated at various temperatures in the SmC phase (Tables S1–S5 in the ESI†) and so was the tilt angle (α).
The temperature-dependent tilt angle α(T) for 1/10 and 1/12 was plotted with respect to TAC − T as shown in Fig. 5d. The variation of α(T) was fitted with a simple power law (TAC − T)β where β is the critical exponent. The critical exponent β was found to be 0.29 ± 0.01 and 0.25 ± 0.01 for compounds 1/10 and 1/12, respectively as calculated from the best suitable fit. The value of β was very close to the theoretically predicted value for the de Vries-like materials, that indicated a continuous phase transition from the SmA to the SmC phase.
Interestingly, compound 1/18 displayed an anomalous d-spacing vs. T behaviour in the cooling cycle. The d-spacing increased upon transition from the orthogonal to the tilted phase due to stretching of the interdigitated alkoxy chains at a comparatively lower temperature.47 The XRD observations of 1/18 are detailed in the ESI (Fig. S31 and Table S5†).
Birefringence studies
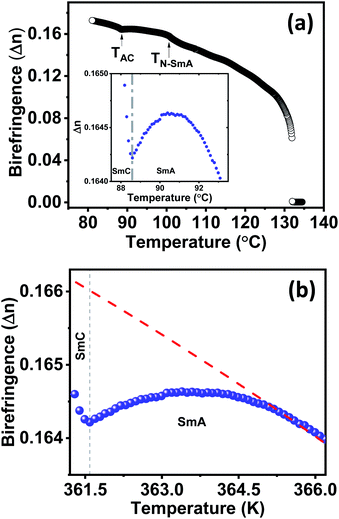
Temperature-dependent birefringence (Δn) measurements were carried out using a phase modulation technique.51,52 This technique provides a high-resolution measurement of birefringence compared to conventional direct intensity measurement techniques. The variation of Δn with temperature for compound 1/12 is presented in Fig. 6a. An expected discontinuous jump at the Iso–N transition temperature was observed. Below the Iso–N transition, birefringence continued to increase with decreasing temperature and underwent a subtle increase at the N–SmA transition temperature. As the temperature was reduced further, it passed through a local maxima within the SmA phase and declined until the SmA–SmC transition was reached (inset of Fig. 6a). The local maxima, so-called parabolic behaviour at the SmA phase followed by a dip in birefringence at the SmA–SmC transition is known to be a typical characteristic of compounds exhibiting the de Vries SmA–SmC transition.53–56 Such a behaviour is theoretically explained to originate from the increasing fluctuations of the tilt angle as the SmA–SmC transition temperature is approached.57,58 A quantitative estimation of the tilt fluctuations can be made from the temperature-dependent birefringence above the SmC to SmA phase transition. In the absence of critical fluctuations and for small angles, Δn in the SmA phase can be expressed as: | (1) |
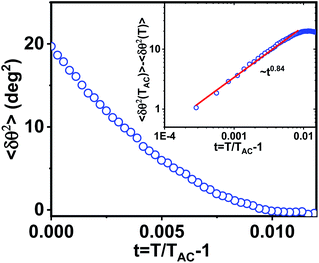 | ||
| Fig. 7 Variation of mean square tilt fluctuations δθ2 calculated from eqn (1) with reduced temperature t = (T − TAC)/TAC. The inset shows the relative tilt fluctuations δθ2(TAC) − δθ2(T) with reduced temperature t in the log–log scale. The red line shows a linear fit that provides the critical exponent of heat capacity γ. | ||
It is known that the SmA–SmC transition could be of three types namely, first order, tricritical and XY-like. Saunders showed that for |t| ≪ 1, the excess birefringence above the de Vries SmA–SmC transition for all the transition types mentioned above varied linearly, i.e., ΔΔn ∝ t, where ΔΔn = (Δn − ΔnAC)/(ΔnAC) and t = (T − TAC)/TAC.59 On the other hand, below the de Vries SmA–SmC transition, ΔΔn ∝ tx, where x is the critical exponent and x = 1 and 0.5 for the XY-like and tricritical transitions, respectively.59 However, for a first order transition, ΔΔn should exhibit a discontinuous jump at the transition. Compound 1/12 did not show any jump at TAC, hence the first order transition was ruled out. For further analysis, we plotted excess birefringence with the reduced temperature following Saunders. Fig. 8 shows the variation of excess birefringence ΔΔn as a function of reduced temperature t across the SmA–SmC transition. It was noted that above the transition (t > 0), ΔΔn varied linearly i.e., ΔΔn ∼ t and below the transition (t < 0), ΔΔn ∼ t0.59. The latter exponent was very close to 0.5 indicating that the SmA–SmC transition was tricritical type.
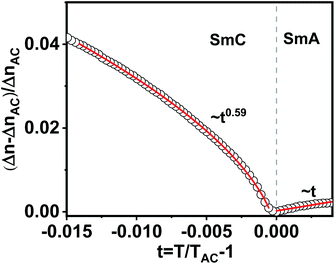 | ||
| Fig. 8 Fractional change in birefringence ΔΔn = (Δn − ΔnAC)/(ΔnAC) as a function of reduced temperature t = (T − TAC)/TAC around the SmA–SmC transition. The continuous red lines are fits to the equations ΔΔn ∝ t and ΔΔn ∝ t0.59 above and below the SmA–SmC transition as predicted by Saunders.59 | ||
Optical tilt studies
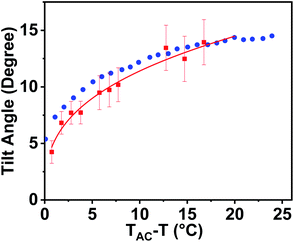
Measurement of the optical tilt angle was carried out by observing two oppositely tilted neighbouring domains of a planar aligned sample in the SmC phase under a POM. Fig. 9 shows the temperature variation of the optical tilt angle θop. The value of θop increased with decreasing temperature as expected and can be fitted well to a power law θop ∼ (TAC − T)β, with the exponent, β = 0.33. Similar exponents have been reported in many de Vries materials in calamitic compounds, showing a crossover (tricritical) from the second to first-order transition.60,61 The numerical value of the reduction factor (R) reveals the de Vries character of the liquid crystalline material. In conventional rod-like de Vries LCs, R is expressed as:| R = δ(θ)/θop = cos−1[dC(T)/d(TAC)]/θop(T) | (2) |
The variation of the tilt angle α(T), calculated from the X-ray layer spacing is also shown in Fig. 9. Both the angles were comparable; hence the R factor was nearly equal to 1 in these bent-core systems. This is comparatively higher than the values typically observed in conventional de Vries calamitic materials (R ≪ 1).60,62
It is known that de Vries smectics are established for conventional calamitic systems. Interestingly, in this report, unsymmetrical bent-core compounds exhibit de Vries-like properties supported by low-layer shrinkage, molecular tilt, and birefringence measurements. Based on these experimental observations, a schematic model for arrangement of bent-core molecules is proposed in the de Vries smectic phase (Fig. 10). The orthogonal SmA phase possesses a tilt when it exhibits de Vries-like properties, and hence the layer spacings in the de Vries SmA and SmC phases are comparable i.e., negligible layer shrinkage.
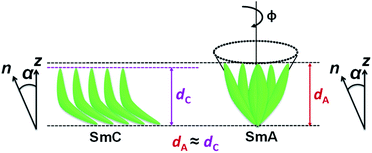 | ||
| Fig. 10 A proposed schematic model for arrangement of bent-core molecules in de Vries SmA and SmC phases. | ||
Conclusions
We have presented a facile design of a series of four-ring unsymmetrical bent-core compounds exhibiting “de Vries-like” smectic phases. Interestingly, a high temperature nematic phase was also observed for these de Vries-like LCs. A DSC phase transition peak was not observed for any SmA to SmC transition due to very low enthalpy, and comprehensive POM and XRD investigations confirmed the presence of the SmC phase. The structure–property correlation deduced that the SmC phase was favoured over the SmA phase upon lengthening of the terminal alkoxy chain (from n = 10 to 18). Critical XRD analysis revealed information about layer spacings (d-values) in the nematic, SmA and SmC phases. All the compounds exhibited ≤1% layer shrinkage upon the SmA–SmC phase transition. The de Vries-like SmA phase was also verified as per the d < L value. Furthermore, the variation of the calculated molecular tilt angle (α) derived from the temperature-dependent SAXS experiments, followed the power law with exponent values 0.29 ± 0.01 and 0.25 ± 0.01 for compounds 1/10 and 1/12, respectively, and are quite close to the theoretically predicted value for the “de Vries-like” LCs. The R factor, determined by using the equation for conventional calamitic de Vries materials, was nearly equal to 1 for this bent-core system. Moreover, detailed analysis of temperature-dependent birefringence studies showed that the SmA–SmC transition was tricritical type. We have proposed a simple model on the possible orientation of the bent-core molecules in the de Vries smectic phase. We expect that our findings open an unexplored aspect, namely the “de Vries-like” characteristics of bent-core liquid crystals.Data availability
The detailed experimental data is provided in the ESI.†Author contributions
SK, GM and SKP conceived and designed this research. SK synthesized the compounds and the phase characterization studies (POM, DSC and XRD) were done by SK and GM. SPG analysed and explained the XRD data. AB and SD performed and analysed the birefringence and optical tilt measurements. All the authors contributed to the manuscript preparation.Conflicts of interest
There are no conflicts to declare.Acknowledgements
SKP acknowledges the SERB Project (CRG/2019/000901/OC). SK acknowledges CSIR (09/947(0254)/2020-EMR-I) for the PhD fellowship. GM acknowledges DST-SERB, India for NPDF (NPDF/2016/000560). SPG is thankful to Patna University for the support. We thank IISER Mohali for all central and departmental facilities, in particular, for access to the NMR, HRMS and SAXS/WAXS system. SD acknowledges financial support from SERB (CRG/2019/000425). AB acknowledges UGC-CSIR (1502/(CSIR-UGC NET JUNE 2019) for the fellowship.References
- C. Tschierske, J. Mater. Chem., 1998, 8, 1485–1508 RSC.
- J. P. F. Lagerwall and F. Giesselmann, ChemPhysChem, 2006, 7, 20–45 CrossRef CAS PubMed.
- T. Takahashi, H. Furue, M. Shikada, N. Matsuda, T. Miyama and S. Kobayashi, Jpn. J. Appl. Phys., 1999, 38, 534–536 CrossRef.
- L. A. Beresnev, L. M. Blinov, M. A. Osipov and S. A. Pikin, Mol. Cryst. Liq. Cryst., 1988, 158, 1–150 CrossRef.
- R. B. Meyer, L. Liebert, L. Strzelecki and P. Keller, J. Phys., Lett., 1975, 36, 69–71 CrossRef.
- N. A. Clark and S. T. Lagerwall, Appl. Phys. Lett., 1980, 36, 899–901 CrossRef CAS.
- Y. Takanishi, Y. Ouchi, H. Takezoe and A. Fukuda, Jpn. J. Appl. Phys., 1989, 28, L487–L489 CrossRef CAS.
- T. P. Rieker, N. A. Clark, G. S. Smith, D. S. Parmar, E. B. Sirota and C. R. Safinya, Phys. Rev. Lett., 1987, 59, 2658–2661 CrossRef CAS PubMed.
- N. A. Clark and T. P. Rieker, Phys. Rev. A, 1988, 37, 1053–1056 CrossRef PubMed.
- A. de Vries, J. Chem. Phys., 1979, 71, 25–31 CrossRef CAS.
- J. Naciri, J. Ruth, G. Crawford, R. Shashidhar and B. R. Ratna, Chem. Mater., 1995, 7, 1397–1402 CrossRef CAS.
- G. Galli, M. Reihmann, A. Crudeli, E. Chiellini, Y. Panarin, J. Vij, C. Blanc, V. Lorman and N. Olsson, Mol. Cryst. Liq. Cryst., 2005, 439, 245–257 Search PubMed.
- M. Rossle, L. Braun, D. Schollmeyer, R. Zentel, J. P. F. Lagerwall, F. Giesselmann and R. Stannarius, Liq. Cryst., 2005, 32, 533–538 CrossRef.
- J. C. Roberts, N. Kapernaum, F. Giesselmann and R. P. Lemieux, J. Am. Chem. Soc., 2008, 130, 13842–13843 CrossRef CAS PubMed.
- L. Li, C. D. Jones, J. Magolan and R. P. Lemieux, J. Mater. Chem., 2007, 17, 2313–2318 RSC.
- A. Kocot, J. K. Vij, T. S. Perova, K. Merkel, V. Swaminathan, S. P. Sreenilayam, N. Yadav, V. P. Panov, P. J. Stevenson, A. Panov and D. Rodriquez-Lojo, J. Chem. Phys., 2017, 147(1–11), 094903 CrossRef CAS PubMed.
- C. P. J. Schubert, C. Muller, A. Bogner, F. Giesselmann and R. P. Lemieux, Soft Matter, 2017, 13, 3307–3313 RSC.
- K. M. Mulligan and R. P. Lemieux, Liq. Cryst., 2015, 42, 1229–1235 CrossRef CAS.
- S. P. Sreenilayam, D. R. Lojo, D. M. A. Kooijman, J. K. Vij, V. P. Panov, A. Panov, M. R. Fisch, S. Kumar and P. J. Stevenson, Phys. Rev. Mater., 2018, 2(1–12), 025603 CrossRef CAS.
- K. M. Mulligan, A. Bogner, Q. Song, C. P. J. Schubert, F. Giesselmann and R. P. Lemieux, J. Mater. Chem. C, 2014, 2, 8270–8276 RSC.
- S. Ghosh, N. Begum, S. Turlapati, S. K. Roy, A. K. Das and N. V. S. Rao, J. Mater. Chem. C, 2014, 2, 425–431 RSC.
- S. Kaur, G. Mohiuddin, P. Satapathy, R. Nandi, V. Punjani, S. K. Prasad and S. K. Pal, Mol. Syst. Des. Eng., 2018, 3, 839–852 RSC.
- S. Kaur, G. Mohiuddin, V. Punjani, R. K. Khan, S. Ghosh and S. K. Pal, J. Mol. Liq., 2019, 295(1–11), 111687 CrossRef CAS.
- R. K. Khan, S. Turlapati, N. Begum, G. Mohiuddin, N. V. S. Rao and S. Ghosh, RSC Adv., 2018, 8, 11509–11516 RSC.
- S. K. Saha, G. Mohiuddin, M. K. Paul, S. P. Gupta, R. K. Khan, S. Ghosh and S. K. Pal, ACS Omega, 2019, 4, 7711–7722 CrossRef CAS PubMed.
- L. Chakraborty, N. Chakraborty, D. D. Sarkar, N. V. S. Rao, S. Aya, K. V. Le, F. Araoka, K. Ishikawa, D. Pociecha, E. Gorecka and H. Takezoe, J. Mater. Chem. C, 2013, 1, 1562–1566 RSC.
- R. Deb, R. K. Nath, M. K. Paul, N. V. S. Rao, F. Tuluri, Y. Shen, R. Sha, D. Chen, C. Zhu, I. I. Smalyukh and N. A. Clark, J. Mater. Chem., 2010, 20, 7332–7336 RSC.
- D. K. Yoon, R. Deb, D. Chen, E. Korblova, R. Shao, K. Ishikawa, N. V. S. Rao, D. M. Walba, I. I. Smalyukh and N. A. Clark, Proc. Natl. Acad. Sci. U. S. A., 2010, 107, 21311–21315 CrossRef CAS PubMed.
- R. K. Nath, R. Deb, N. Chakraborty, G. Mohiuddin, D. S. S. Rao and N. V. S. Rao, J. Mater. Chem. C, 2013, 1, 663–670 RSC.
- M. J. Gim, S. Turlapati, S. Debnath, N. V. S. Rao and D. K. Yoon, ACS Appl. Mater. Interfaces, 2016, 8, 3143–3149 CrossRef CAS PubMed.
- R. K. Khan, S. Turlapati, N. V. S. Rao, R. Pratibha, W. Drzewinski, R. Dabrowski and S. Ghosh, J. Mater. Chem. C, 2017, 5, 6729–6737 RSC.
- M. Nagaraj, Liq. Cryst., 2016, 43, 2244–2253 CrossRef CAS.
- A. Belaissaoui, S. J. Cowling and J. W. Goodby, Liq. Cryst., 2013, 40, 822–830 CrossRef CAS.
- M. Alaasar, M. Prehm, S. Belau, N. Sebastián, M. Kurachkina, A. Eremin, C. Chen, F. Liu and C. Tschierske, Chem.–Eur. J., 2019, 25, 6362–6377 CrossRef CAS PubMed.
- C. Tschierske and D. J. Photinos, J. Mater. Chem., 2010, 20, 4263–4294 RSC.
- M. Lehmann, J. Seltmann, A. A. Auer, E. Prochnow and U. Benedik, J. Mater. Chem., 2009, 19, 1978–1988 RSC.
- S. Maisch, A. M. Krause, D. Schmidt and M. Lehmann, Liq. Cryst., 2018, 45, 136–151 CrossRef CAS.
- D. Chen, M. Nakata, R. Shao, M. R. Tuchband, M. Shuai, U. Baumeister, W. Weissflog, D. M. Walba, M. A. Glaser, J. E. Maclennan and N. A. Clark, Phys. Rev. E: Stat., Nonlinear, Soft Matter Phys., 2014, 89(1–5), 022506 CrossRef PubMed.
- S. P. Sreenilayam, V. P. Panov, J. K. Vij and G. Shanker, Liq. Cryst., 2017, 44, 244–253 CAS.
- B. X. Li, Y. A. Nastishin, H. Wang, M. Gao, S. Paladugu, R. Li, M. Fukuto, Q. Li, S. V. Shiyanovskii and O. D. Lavrentovich, Phys. Rev. Res., 2020, 2(1–14), 033371 CrossRef CAS.
- Y. Wang, G. Singh, D. M. A. Kooijman, M. Gao, H. K. Bisoyi, C. Xue, M. R. Fisch, S. Kumar and Q. Li, CrystEngComm, 2015, 17, 2778–2782 RSC.
- Y. Wang, Z. g. Zheng, H. K. Bisoyi, K. G. G. Cuevas, L. Wang, R. S. Zola and Q. Li, Mater. Horiz., 2016, 3, 442–446 RSC.
- M. Alaasar, S. Poppe, C. Kerzig, C. Klopp, A. Eremin and C. Tschierske, J. Mater. Chem. C, 2017, 5, 8454–8468 RSC.
- M. Alaasar, S. Poppe and C. Tschierske, Liq. Cryst., 2017, 44, 729–737 CrossRef CAS.
- Y. P. Panarin, S. P. Sreenilayam, V. Swaminathan, C. Tschierske and J. K. Vij, Phys. Rev. Res., 2020, 2(1–8), 013118 CrossRef CAS.
- H. Ocak, B. B. Eran, M. Prehm, S. Schymura, J. P. F. Lagerwall and C. Tschierske, Soft Matter, 2011, 7, 8266–8280 RSC.
- S. P. Sreenilayam, Y. P. Panarin, J. K. Vij, V. P. Panov, A. Lehmann, M. Poppe, M. Prehm and C. Tschierske, Nat. Commun., 2016, 7(1–8), 11369 CrossRef CAS PubMed.
- A. A. S. Green, M. R. Tuchband, R. Shao, Y. Shen, R. Visvanathan, A. E. Duncan, A. Lehmann, C. Tschierske, E. D. Carlson, E. Guzman, M. Kolber, D. M. Walba, C. S. Park, M. A. Glaser, J. E. Maclennan and N. A. Clark, Phys. Rev. Lett., 2019, 122(1–6), 107801 CrossRef CAS PubMed.
- D. Tsuji, Y. Takanishi, J. Yamamoto and A. Yoshizawa, J. Phys. Chem. C, 2012, 116, 8678–8687 CrossRef CAS.
- S. Ghosh, P. Nayek, S. K. Roy, T. P. Majumder, M. Zurowska and R. Dabrowski, Europhys. Lett., 2010, 89, 16001 CrossRef.
- T. C. Oakberg, SPIE Proc., 1997, 19, 3121 Search PubMed.
- P. Sathyanaraya, M. Mathews, Q. Li, V. S. S. Sastry, K. V. Le, H. Takezoe and S. Dhara, Phys. Rev. E: Stat., Nonlinear, Soft Matter Phys., 2010, 81, 010702(R) CrossRef PubMed.
- J. Fernsler, D. Wicks, D. Staines, A. Havens and N. Paszek, Liq. Cryst., 2012, 39, 1204–1215 CrossRef CAS.
- J. P. F. Lagerwall, F. Giesselmann and M. D. Radclife, Phys. Rev. E: Stat., Nonlinear, Soft Matter Phys., 2002, 66(1–11), 031703 CrossRef PubMed.
- U. Manna, J. K. Song, Y. P. Panarin, A. Fukuda and J. K. Vij, Phys. Rev. E: Stat., Nonlinear, Soft Matter Phys., 2008, 77(1–12), 041707 CrossRef CAS PubMed.
- M. Skarabot, K. Kocevar, R. Blinc, G. Heppke and I. Musevic, Phys. Rev. E: Stat. Phys., Plasmas, Fluids, Relat. Interdiscip. Top., 1999, 59, R1323 CrossRef.
- K. Saunders, D. Hernandez, S. Pearson and J. Toner, Phys. Rev. Lett., 2007, 98(1–4), 197801 CrossRef PubMed.
- K. C. Lim and J. T. Ho, Phys. Rev. Lett., 1978, 40, 1576 CrossRef CAS.
- K. Saunders, Phys. Rev. E: Stat., Nonlinear, Soft Matter Phys., 2008, 77(1–13), 061708 CrossRef PubMed.
- Q. Song, D. Nonnenmacher, F. Giesselmann and R. P. Lemieux, J. Mater. Chem. C, 2013, 1, 343–350 RSC.
- H. K. Singh, S. K. Singh, R. Nandi, D. S. S. Rao, S. K. Prasad, R. K. Singh and B. Singh, RSC Adv., 2016, 6, 57799–57802 RSC.
- M. D. Radcliffe, M. L. Brostrom, K. A. Epstein, A. G. Rappaport, B. N. Thomas, R. Shao and N. A. Clark, Liq. Cryst., 1999, 26, 789–794 CrossRef CAS.
Footnotes |
| † Electronic supplementary information (ESI) available: Chemical and physical characterizations of all the compounds. See DOI: 10.1039/d1sc06629c |
| ‡ Joint first authors. |
| § Present address: Department of Chemistry, University of Science & Technology Meghalaya, Ri-Bhoi, Meghalaya-793101, India. |
| This journal is © The Royal Society of Chemistry 2022 |

