 Open Access Article
Catalytic electron drives host–guest recognition†
Yoshihiro
Owatari
,
Shuta
Iseki
,
Daiji
Ogata
and
Junpei
Yuasa
 *
*
Department of Applied Chemistry, Tokyo University of Science, 1-3 Kagurazaka, Shinjuku, Tokyo 162-8601, Japan. E-mail: yuasaj@rs.tus.ac.jp; Fax: +81-3-72-6179
First published on 5th April 2022
Abstract
Electron injection is demonstrated to trigger electrocatalytic chain reactions capable of releasing a solvent molecule and forming a redox active guest molecule. One-electron reduction of a hydroxy anthrone derivative (AQH–CH2CN) results in the formation of an anthraquinone radical anion (AQ˙−) and acetonitrile (CH3CN). The resulting fragment of AQ˙− exhibits high stability under mild reducing conditions, and it has enough reducing power to reduce the reactant of AQH–CH2CN. Hence, subsequent electron transfer from AQ˙− to AQH–CH2CN yields the secondary AQ˙− and CH3CN, while the initial AQ˙− is subsequently oxidized to AQ. Overall, the reactants of AQH–CH2CN are completely converted into AQ and CH3CN in sustainable electrocatalytic chain reactions. These electrocatalytic chain reactions are mild and sustainable, successfully achieving catalytic electron-triggered charge-transfer (CT) complex formation. Reactant AQH–CH2CN is non-planar, making it unsuitable for CT interaction with an electron donor host compound (UHAnt2) bearing parallel anthracene tweezers. However, conversion of AQH–CH2CN to planar electron acceptor AQ by the electrocatalytic chain reactions turns on CT interaction, generating a host CT complex with UHAnt2 (AQ ⊂ UHAnt2). Therefore, sustainable electrocatalytic chain reactions can control CT interactions using only a catalytic amount of electrons, ultimately affording a one-electron switch associated with catalytic electron-triggered turn-on molecular recognition.
Introduction
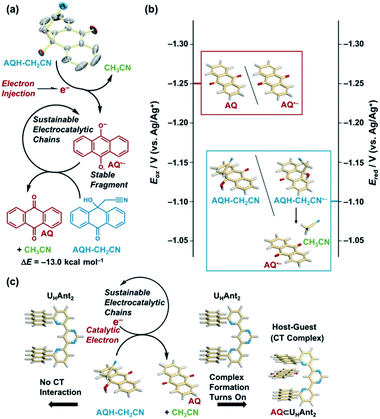
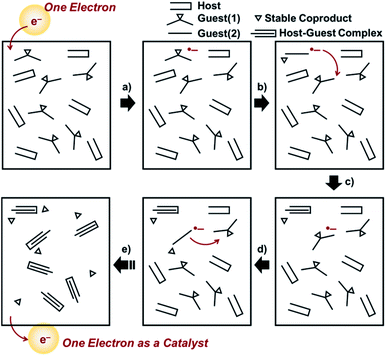
The addition of an electron can significantly change the chemical and electronic nature of molecules.1,2 The extra electron (+e−) populated in the antibonding orbital weakens the chemical bond,3 leading to reductive fragmentations that form a redox-active fragment and a highly stable coproduct.1,2 When the resulting active fragment has sufficient reducing power to reduce the reactant, electrocatalytic chain reactions can be triggered.1,2 Synthetic studies on such electron upconversions have focused on challenging chemical transformations.1,2,4–12 However, the advantages of electrons as a remote and accessible chemical input also show promise for the development of new dynamic host–guest systems,13,14 whereby electrocatalytic chain reactions enable guest molecule release,14–18 ultimately affording a one-electron switch using only a catalytic amount of electrons as the input dots.Herein, we demonstrate electrocatalytic chain reactions capable of turning on charge-transfer (CT) complex formation, accompanied by solvent molecule release and redox-active anthraquinone formation, for the first time (Scheme 1).19 Quinone derivatives are important electron carriers widely distributed in nature,20 and have recently been utilized as guest molecules in host–guest systems.18,21–23 Electron injection to a hydroxy anthrone derivative (AQH–CH2CN) results in the formation of an anthraquinone radical anion (AQ˙−) and a stable coproduct (acetonitrile, CH3CN) [Scheme 1a]. Redox-active fragment AQ˙− has sufficient reducing power to reduce reactant AQH–CH2CN (Scheme 1b), which initiates the electrocatalytic chain reaction (Scheme 1a). This electron upconversion produces a much lower amount of energy (3.5 kcal mol−1, 0.15 eV; Scheme 1b) compared with electron upconversions used for synthetic purposes (20–25 kcal mol−1).2 Even the redox-active fragment (AQ˙−) is stable under mild reducing conditions, and the stable coproduct (CH3CN) is a solvent molecule that has no impact on the electrocatalytic chain reaction. Therefore, the present electrocatalytic chain reactions are mild and sustainable, providing new opportunities for catalytic electron-triggered host–guest systems (Scheme 1c). Reactant AQH–CH2CN is non-planar, making it unsuitable for host–guest systems driven by CT interactions. However, the electrocatalytic chain reaction converts AQH–CH2CN to AQ, which is a planar electron-acceptor suitable for CT interactions, making turn-on generation of a host CT complex possible. Therefore, the sustainable electrocatalytic chain reactions demonstrated here can control host–guest molecular recognition using only a catalytic amount of electrons. This paves the way for a “one-electron switch” associated with catalytic electron-triggered turn-on molecular recognition (Scheme 2).
Results and discussion
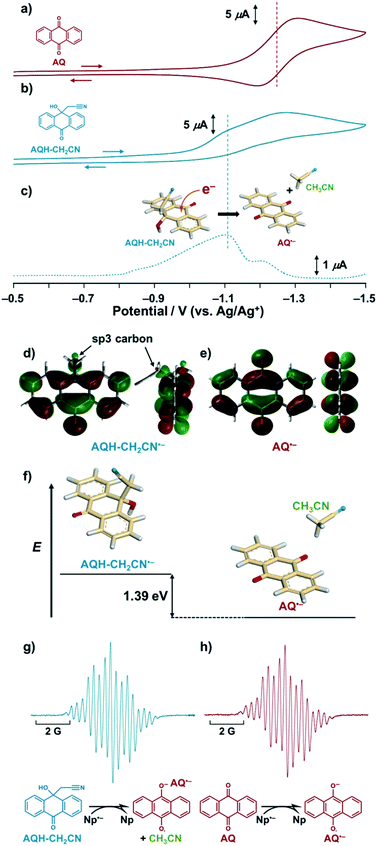
The hydroxy anthrone derivative (AQH–CH2CN)24 was synthesized by solvolysis of anthraquinone (AQ) under strong basic conditions in acetonitrile (see the ESI†). The resulting AQH–CH2CN was successfully crystallized to reveal a C–C bond (dc–c = 1.56 Å) between the CH2CN moiety and the carbon atom of the anthrone ring at the connected position (Scheme 1a). Although that C–C bond is slightly longer than a conventional C–C bond (≤1.54 Å), it is not considered as a significant high-energy bond. Density functional theory (DFT) calculations [DFT/B3LYP-6-31G+(d,p)] predict that the dissociated product (i.e., AQ + CH3CN) is 13.0 kcal mol−1 lower in energy than AQH–CH2CN, while AQH–CH2CN itself is stable in the long term, thus indicating a relatively large activation barrier for the conversion of AQH–CH2CN to AQ and CH3CN before electron injection.Fig. 1 shows the cyclic voltammograms of AQ and AQH–CH2CN in deaerated acetonitrile. In contrast to the reversible cyclic voltammogram of AQ (Fig. 1a), the cyclic voltammogram of AQH–CH2CN shows an irreversible redox wave (Fig. 1b), suggesting that the one-electron reduction of AQH–CH2CN was associated with an irreversible process (vide infra). The one-electron reduction potential of AQH–CH2CN was then determined as E0red = −1.10 V (vs. Ag/Ag+) using differential pulse voltammetry (Fig. 1c), which is +0.15 V higher than the one-electron reduction potential of AQ [E0red = −1.25 V (vs. Ag/Ag+)]. Not surprisingly, AQH–CH2CN containing the central sp3 carbon finds it rather difficult to accept an electron. Indeed, the optimized structure [DFT/UB3LYP-6-31G+(d,p)] of AQH–CH2CN˙− suggests that the electron density of the singly occupied molecular orbital (SOMO) is low at the central sp3 carbon (Fig. 1d), while the SOMO orbital of AQ˙− is fully delocalized across the entire molecule (Fig. 1e). Consequently, the SOMO energy level of AQH–CH2CN˙− is 0.55 eV (12.7 kcal mol−1) higher than that of AQ˙−. Conversely, a fully dissociated state (i.e., AQ˙− + CH3CN) is 1.39 eV (32.1 kcal mol−1) lower than AQH–CH2CN˙− (Fig. 1f).25,26 Therefore, the coupling of the dissociation of CH3CN to the one-electron reduction of AQH–CH2CN (inset of Fig. 1c) should result in a significant shift of its one-electron reduction potential to the positive direction.
Using electron spin resonance (ESR) spectroscopy, we then detected the product after electron injection to AQH–CH2CN by addition of 1 equivalent of sodium naphthalenide (Np˙−·Na+).27 The ESR spectrum for AQ˙− was observed, which is identical to that obtained by the one-electron reduction of AQ (Fig. 1gvs.Fig. 1h), while no AQH–CH2CN˙− species was detected (Fig. 1g).
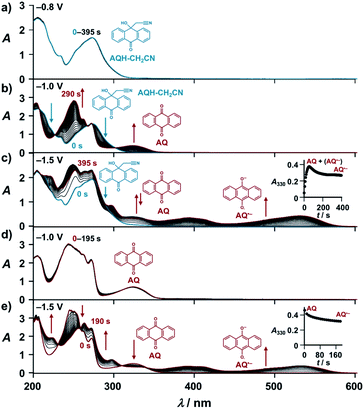
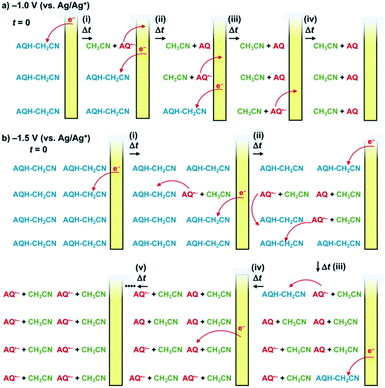
With these results, we then obtained the UV/Vis absorption spectra of AQH–CH2CN with applied voltages of −0.8, −1.0, and −1.5 V (vs. Ag/Ag+) [Fig. 2a–c, respectively]. When the voltage of −0.8 V (vs. Ag/Ag+) was continuously applied to AQH–CH2CN, no spectral change was observed (Fig. 2a). However, when the potential of −1.0 V (vs. Ag/Ag+) was applied to AQH–CH2CN, UV/Vis absorption spectral changes were clearly observed with several isosbestic points (Fig. 2b). The resulting UV/Vis absorption spectrum after 290 s of applied voltage of −1.0 V (vs. Ag/Ag+) is identical to that of AQ (Fig. 2b red line vs.Fig. 2d), suggesting a quantitative conversion of AQH–CH2CN to AQ (AQH–CH2CN → AQ + CH3CN), while no UV/Vis absorption bands due to AQ˙− were observed (Fig. 2b). The one-electron oxidation potential of AQ˙− [E0ox = −1.25 V (vs. Ag/Ag+)] is lower than the applied potential [−1.0 V (vs. Ag/Ag+)], leading to rapid electron transfer to the working electrode and conversion of the temporarily generated AQ˙− to AQ (Fig. 3a). In fact, the current flow was very low under these conditions (Fig. S3†).28 No UV/Vis absorption spectral change took place for AQ under the −1.0 V (vs. Ag/Ag+) voltage (Fig. 2d), which is much higher than its one-electron reduction potential [E0red = −1.25 V (vs. Ag/Ag+)]. Conversely, AQ was quantitatively converted to AQ˙− under the more negative applied potential of −1.5 V (vs. Ag/Ag+) [Fig. 2e]. Then, the −1.5 V (vs. Ag/Ag+) potential was applied to AQH–CH2CN, where AQH–CH2CN also exhibited UV/Vis absorption spectral changes (Fig. 2c). The UV/Vis absorption spectrum of AQH–CH2CN after 395 s of applied voltage of −1.5 V (vs. Ag/Ag+) is identical to that of AQ˙− (Fig. 2c red line vs.Fig. 2e), suggesting that AQH–CH2CN was directly converted to AQ˙− (i.e., AQH–CH2CN + e− → AQ˙− + CH3CN) in this case. Here, the absorbance at 330 nm (due to AQ) increased upon applying the voltage of −1.5 V (vs. Ag/Ag+) to AQH–CH2CN at t = 0–55 s, after which the absorbance decreased and reached saturation at t = 395 s (inset of Fig. 2c). The reactant of AQH–CH2CN gave no appreciable absorption at 330 nm  , and the molar absorption coefficient of AQ was larger than that of AQ˙− at 330 nm (
 , inset of Fig. 2e). Hence, the initial increase and the subsequent decrease of absorbance observed at 330 nm (inset of Fig. 2c) indicated temporary generation of AQ and its subsequent conversion into AQ˙− as explained below. Because the applied voltage of −1.5 V (vs. Ag/Ag+) is sufficiently lower than the one-electron oxidation potential of AQ˙− [E0ox = −1.25 V (vs. Ag/Ag+)], no further electron transfer to the electrode was expected (Fig. 3b(i)). The resulting AQ˙− [E0ox = −1.25 V (vs. Ag/Ag+)] has sufficient reducing power to reduce AQH–CH2CN [E0red = −1.10 V (vs. Ag/Ag+)], generating the secondary AQ˙−, while the original AQ˙− was oxidized to AQ (Fig. 3b(ii)). Conversely, AQH–CH2CN is easier to be reduced than AQ, and hence AQH–CH2CN will more preferentially undergo one-electron reduction by the electrode than the subsequently formed AQ. In addition, chain electron transfer from AQ˙− to AQH–CH2CN also takes place to increase the concentration of AQ around the surface of the working electrode (Fig. 3b(i)–(iv)). When all the AQH–CH2CN molecules were consumed, the AQ molecules generated by the electrocatalytic chain reactions started to be reduced by the electrode (Fig. 3b(v)).
The electrocatalytic chain reaction was initiated by chemical reduction of AQH–CH2CN (5.0 × 10⁻² M) using only 0.1 equivalent of Np˙−·Na+ (5.0 × 10⁻³ M) in deaerated THF (Fig. 4 and ESI Movie S1†). Before addition of Np˙−·Na+, the THF solution of AQH–CH2CN was colorless and transparent; however, upon addition of Np˙−·Na+ (0.1 eq.), the solution color immediately turned red (Fig. 4b to c). The resulting red color corresponds to AQ˙−, whose red color was confirmed by electrochemical reduction of AQ (Fig. 4a). Then, the solution was suspended for 10 min after the Np˙−·Na+ addition, and the reaction was complete within 60 min under these conditions. The red color arising from AQ˙− was maintained during the reaction (Fig. 4d and S4†). The resulting yellow precipitate was AQ that was not completely soluble in THF under the high concentration conditions employed ([C]0 = 5.0 × 10⁻² M).
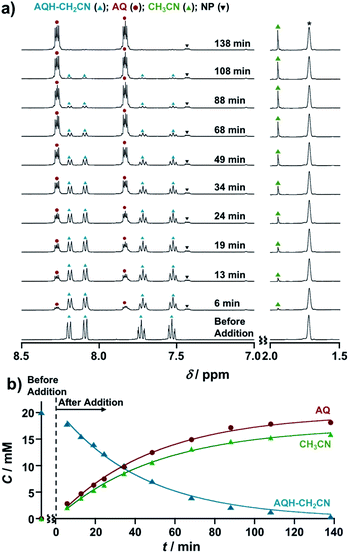
The CH3CN generated during the electrocatalytic chain reactions was monitored by NMR spectroscopy (Fig. 5). Upon introduction of 0.1 equivalent of Np˙−·Na+ (2.0 × 10⁻³ M) into AQH–CH2CN (2.0 × 10⁻² M) in deaerated THF-d8, 1H NMR signals corresponding to AQH–CH2CN (blue triangles) gradually decreased and a concomitant increase of signals arising from the formation of AQ (red circles) and CH3CN (green triangles) was observed (Fig. 5a and S5†). The corresponding time course curves (Fig. 5b) showed that the initial 20 mM of AQH–CH2CN (blue triangles) was almost completely consumed at t = 138 min, where the formation of AQ (red circles) and the associated CH3CN released (green triangles) reached saturation.29
In light of these results, we can summarize the electrocatalytic chain reaction (Scheme 1) as follows: at the initial step, electron injection to AQH–CH2CN produces AQ˙−, with the process driven by bond breaking associated with proton migration. The initially formed AQ˙− can subsequently reduce the AQH–CH2CN reactant to generate secondary AQ˙− and CH3CN, while the initial AQ˙− is oxidized to AQ (Scheme 1a). Then, the secondary-formed AQ˙− is also capable of reducing the reactant of AQH–CH2CN to generate a next AQ˙− associated with the concomitant release of CH3CN (Scheme 1a). Thus, conversion of AQH–CH2CN to AQ and CH3CN is the electrocatalytic chain reaction process mediated by AQ˙− (Scheme 1a). The electrocatalytic chain reactions are terminated when all the AQH–CH2CN is consumed, while the concentration of AQ˙− remains unchanged during the chain reaction. If the present electrocatalytic chain reaction mechanism is valid, the rates of the concentration changes (|dC/dt|) of AQ, CH3CN, and AQH–CH2CN would obey pseudo-first-order kinetics because the observed rate (|dC/dt|) can be represented as ket[AQ˙−][C], where the [AQ˙−] term is constant during the chain reaction. This was confirmed by time course curves obtained from the above 1H NMR kinetics experiments, where each time course obeyed first-order kinetics with very similar pseudo-first-order rate constants (kobs = ket[AQ˙−] = 3.3–3.9 × 10⁻⁴ s−1) [Fig. 5b]. The observed reaction rate also increased with an increase in the initial concentration of the added Np˙−·Na+ (i.e., [Np˙−·Na+]0 = [AQ˙−]) [Fig. S6†]. Therefore, we can extract the electron-transfer rate constant (ket = 1.6–1.9 × 10⁻¹ M−1 s−1) by using the initial concentration of Np˙−·Na+ (2.0 × 10⁻³ M). The determined ket value (ket = 1.6–1.9 × 10⁻¹ M−1 s−1) is reasonable for slightly exergonic electron transfer with a large reorganization energy arising from the bond breaking/proton migration.30 Moreover, the conversion of AQH–CH2CN to AQ and CH3CN can be completed only with 0.025 equivalent of Np˙−·Na+ used as the initiator (Fig. S7†), suggesting that the turnover number of the electrocatalytic chain reactions is at least greater than 40.
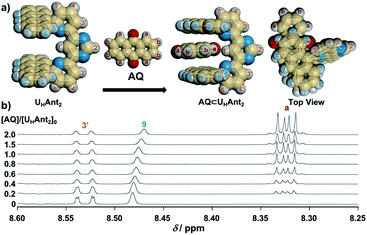
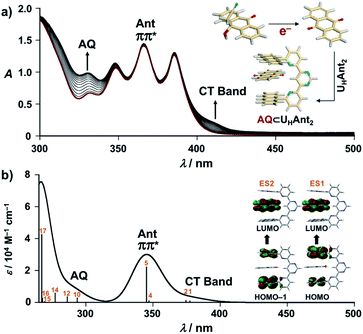
As the present electrocatalytic chain reactions were mild and sustainable, we investigated their application to CT interaction turn-on systems (vide infra). Electron donor host compound UHAnt2, first synthesized by Lehn et al., was used for this purpose.31 UHAnt2 bears anthracene tweezers suitable for insertion of a planar electron-acceptor molecule to form a stable D–A–D-type CT complex.31 The possibility of CT complex formation between UHAnt2 and AQ was predicted by DFT modeling [DFT/CAM-B3LYP-6-31G(d)], which suggested that D–A–D-type CT complex formation (AQ ⊂ UHAnt2) was reasonable (Fig. 6a and S8†). Furthermore, the 1H NMR spectrum of UHAnt2 showed that anthracene aromatic protons (H7, H8, and H9) were shifted upfield upon addition of AQ (Fig. 6b and S9–S13†). This observation was consistent with the stacked D–A–D CT model comprising anthracene rings shielded by the central anthraquinone plane (Fig. 6a). The electrocatalytic conversion of AQH–CH2CN to AQ was then examined by applying a potential of −1.0 V (vs. Ag/Ag+) to AQH–CH2CN in the presence of UHAnt2. The absorption band resulting from AQ formation was successfully observed, along with the appearance of a broad absorption band at around 410 nm (Fig. 7a). Successive addition of AQ to UHAnt2 resulted in appearance of the same broad absorption band in a longer wavelength region (Fig. S14†). Conversely, both UHAnt2 alone and AQ alone showed no absorption band in this longer wavelength region (Fig. S15 and S16†). Time-dependent (TD) DFT of AQ ⊂ UHAnt2 indicated that the newly observed broad absorption band was attributed to the CT transition from the anthracene tweezers to the inserted central AQ molecule (Fig. 7b). Further assignment of the CT band was performed with quinones having different one-electron reduction potentials (see details in Fig. S17–S20†). During the electrocatalytic conversion, UHAnt2 showed no degradation (Fig. 7a). Besides, DFT and electrochemical studies (Fig. S8, S21 and S22†) revealed that the mediator AQ˙− (reduced form) has no interaction with UHAnt2, enabling the sustainable electrocatalytic chain reaction even in the presence of UHAnt2. In contrast, a mixture of UHAnt2 and AQH–CH2CN provided no CT absorption band (Fig. S23†), suggesting no effective CT interaction between them. Reactant AQH–CH2CN is a non-planar molecule containing several sp3 carbon atoms, making it unsuitable for CT interaction with the anthracene tweezers of UHAnt2. Furthermore, the CT interactions could also be turned on by electrocatalytic conversion of AQH–CH2CN to AQ initiated by chemical reduction using Np˙−·Na+ (Fig. S24†). Therefore, the CT interactions could be turned on by electrocatalytic conversion of AQH–CH2CN to AQ for CT complex (AQ ⊂ UHAnt2) formation (Scheme 1c; inset of Fig. 7a).32
Conclusions
In conclusion, we successfully demonstrated the electron injection-triggered solvent (CH3CN) molecular release associated with formation of a redox active quinone derivative (AQ) through sustainable electrocatalytic chain reactions. The presented electrocatalytic chain reactions enable guest molecular release and should be mild enough to apply to a wide range of host–guest systems. This study reports a first example of successful catalytic electron-triggered CT complex formation. These findings provide new opportunities for creating a “one-electron switch” (Scheme 2) in association with catalytic electrons as the input dots to trigger specific molecular recognition.Author contributions
Y. O. and S. I. performed the synthesis and characterization of materials, and also contributed the titration experiments. D. O. contributed the analysis of the experimental data. J. Y. designed the study, analysed the experimental data and wrote the manuscript.Conflicts of interest
There are no conflicts to declare.Acknowledgements
This work was partly supported by JSPS KAKENHI, Grant Numbers: JP19H02693, JP19K22207, and JP21H05404 in Scientific Research on Innovative Areas “Dynamic Exciton”, a Grant-in-Aid for the ASAHI Glass Foundation, and the Iketani Foundation. We thank Iain Mackie, PhD, and Simon Partridge, PhD, from Edanz (https://jp.edanz.com/ac) for editing a draft of this manuscript.Notes and references
- (a) A. Studer and D. P. Curran, Nat. Chem., 2014, 6, 765 CrossRef CAS PubMed; (b) A. Studer and D. P. Curran, Angew. Chem., Int. Ed., 2016, 55, 58 CrossRef CAS PubMed.
- M. A. Syroeshkin, F. Kuriakose, E. A. Saverina, V. A. Timofeeva, M. P. Egorov and I. V. Alabugin, Angew. Chem., Int. Ed., 2019, 58, 5532 CrossRef CAS PubMed.
- C. Costentin, M. Robert and J.-M. Saveant, Chem. Phys., 2006, 324, 40 CrossRef CAS.
- M. A. Syroeshkin, I. B. Krylov, A. M. Hughes, I. V. Alabugin, D. V. Nasybullina, M. Y. Sharipov, V. P. Gultyai and A. O. Terent'ev, J. Phys. Org. Chem., 2017, 30, e3744 CrossRef.
- X. Tang and A. Studer, Angew. Chem., Int. Ed., 2018, 57, 814 CrossRef CAS PubMed.
- M. Vacher, I. F. Galvan, B.-W. Ding, S. Schramm, R. Berraud-Pache, P. Naumov, N. Ferre, Y.-J. Liu, I. Navizet, D. Roca-Sanjuan, W. J. Baader and R. Lindh, Chem. Rev., 2018, 118, 6927 CrossRef CAS PubMed.
- D. Davis, V. P. Vysotskiy, Y. Sajeev and L. S. Cederbaum, Angew. Chem., Int. Ed., 2012, 51, 8003 CrossRef CAS PubMed.
- (a) A. Studer and D. P. Curran, Angew. Chem., Int. Ed., 2011, 50, 5018 CrossRef CAS PubMed; (b) S. Zhou, G. M. Anderson, B. Mondal, E. Doni, V. Ironmonger, M. Kranz, T. Tuttle and J. A. Murphy, Chem. Sci., 2014, 5, 476 RSC; (c) J. P. Barham, G. Coulthard, R. G. Kane, N. Delgado, M. P. John and J. A. Murphy, Angew. Chem., Int. Ed., 2016, 55, 4492 CrossRef CAS PubMed.
- J. Kim, D. J. Darley, W. Buckel and A. J. Pierik, Nature, 2008, 452, 239 CrossRef CAS PubMed.
- M. Majek and A. Jacobi von Wangelin, Angew. Chem., Int. Ed., 2015, 54, 2270 CrossRef CAS PubMed.
- J. Du, K. L. Skubi, D. M. Schultz and T. P. Yoon, Science, 2014, 344, 392 CrossRef CAS PubMed.
- Similar situations can be found in oxidant upconversion, where hole catalysis has been utilized as an alternative input to induce the isomerization of photochromic compounds, see: (a) T. Nakashima, Y. Kajiki, S. Fukumoto, M. Taguchi, S. Nagao, S. Hirota and T. Kawai, J. Am. Chem. Soc., 2012, 134, 19877 CrossRef CAS PubMed; (b) S. Lee, Y. You, K. Ohkubo, S. Fukuzumi and W. Nam, Chem. Sci., 2014, 5, 1463 RSC; (c) A. Goulet-Hanssens, C. Rietze, E. Titov, L. Abdullahu, L. Grubert, P. Saalfrank and S. Hecht, Chem, 2018, 4, 1740 CrossRef CAS.
- J. Yuasa and S. Fukuzumi, J. Am. Chem. Soc., 2007, 129, 12912 CrossRef CAS PubMed.
- (a) V. Croue, S. Goeb, G. Szaloki, M. Allain and M. Salle, Angew. Chem., Int. Ed., 2016, 55, 1746 CrossRef CAS PubMed; (b) G. Szaloki, V. Croue, V. Carre, F. Aubriet, O. Aleveque, E. Levillain, M. Allain, J. Arago, E. Orti, S. Goeb and M. Salle, Angew. Chem., Int. Ed., 2017, 56, 16272 CrossRef CAS PubMed.
- (a) D. Ogata and J. Yuasa, Angew. Chem., Int. Ed., 2019, 58, 18424 CrossRef CAS PubMed; (b) Y. Imai and J. Yuasa, Chem. Sci., 2019, 10, 4236 RSC; (c) K. Hamashima and J. Yuasa, Angew. Chem., Int. Ed., 2022, 61, e202113914 CrossRef CAS PubMed.
- M. Han, R. Michel, B. He, Y.-S. Chen, D. Stalke, M. John and G. H. Clever, Angew. Chem., Int. Ed., 2013, 52, 1319 CrossRef CAS PubMed.
- S. Hiraoka, K. Harano, M. Shiro and M. Shionoya, Angew. Chem., Int. Ed., 2005, 44, 2727 CrossRef CAS PubMed.
- L. S. Lisboa, J. A. Findlay, L. J. Wright, C. G. Hartinger and J. D. Crowley, Angew. Chem., Int. Ed., 2020, 59, 11101 CrossRef CAS PubMed.
- After we submitted this manuscript, Stoddart et al. reported an important and excellent example, which also underlined the importance of an electron as a catalyst (trigger) of molecular recognition, see: Y. Jiao, Y. Qiu, L. Zhang, W.-G. Liu, H. Mao, H. Chen, Y. Feng, K. Cai, D. Shen, B. Song, X.-Y. Chen, X. Li, X. Zhao, R. M. Young, C. L. Stern, M. R. Wasielewski, R. D. Astumian, W. A. Goddard III and J. F. Stoddart, Nature, 2022, 603, 265 CrossRef CAS PubMed.
- C. C. Moser, J. M. Keske, K. Warncke, R. S. Farid and P. L. Dutton, Nature, 1992, 355, 796 CrossRef CAS PubMed.
- S. Iseki, K. Nonomura, S. Kishida, D. Ogata and J. Yuasa, J. Am. Chem. Soc., 2020, 142, 15842 CrossRef CAS PubMed.
- (a) D. P. August, G. S. Nichol and P. J. Lusby, Angew. Chem., Int. Ed., 2016, 55, 15022 CrossRef CAS PubMed; (b) V. Martí-Centelles, A. L. Lawrence and P. J. Lusby, J. Am. Chem. Soc., 2018, 140, 2862 CrossRef PubMed.
- S. Sugiura and H. Maeda, Chem. Commun., 2021, 57, 6983 RSC.
- S. M. Lukonina, S. V. Mikhailova, I. K. Korobeinicheva, v. A. Loskutov and E. P. Fokin, Russ. Chem. Bull., 1983, 32, 2379 CrossRef.
- The free energy change
 of radical-anionic version of the fragmentation should be much smaller in the real system (see details in Fig. S1†).
 - Although the detailed mechanism of the fragmentation of acetonitrile in AQH–CH2CN˙− could not be established, DFT study indicates that the fragmentation is likely to be triggered by the intramolecular proton transfer (see details in Fig. S2†).
- Y. Inui, S. Miyazaki, K. Ohkubo, S. Fukuzumi and T. Kojima, Angew. Chem., Int. Ed., 2012, 51, 4623 CrossRef CAS PubMed.
- Accurate determination of the coulombic efficiency could be difficult in this system, because the current flow was extremely low under the potential of −1.0 V (vs. Ag/Ag+) (Fig. S3†).
- The remaining (ungenerated) 2 mM of AQ should still exist as AQ˙− formed by the initial electron transfer from Np˙−·Na+ to AQH–CH2CN. Conversely, undetected remaining CH3CN may result from volatilization.
- J. Yuasa, S. Yamada and S. Fukuzumi, J. Am. Chem. Soc., 2008, 130, 5808 CrossRef CAS PubMed.
- A. Petitjean, R. G. Khoury, N. Kyritsakas and J.-M. Lehn, J. Am. Chem. Soc., 2004, 126, 6637 CrossRef CAS PubMed.
- The titration experiment indicated that the binding constant (KCT) between UHAnt2 and AQ is 140 M−1 (Fig. S25†).
Footnote |
| † Electronic supplementary information (ESI) available. CCDC 2096046. For ESI and crystallographic data in CIF or other electronic format see https://doi.org/10.1039/d2sc01342h |
| This journal is © The Royal Society of Chemistry 2022 |

