 Open Access Article
Creative Commons Attribution 3.0 Unported Licence
Isolable acetylene complexes of copper and silver†
Anurag
Noonikara-Poyil
 a,
Shawn G.
Ridlen
a,
Israel
Fernández
a,
Shawn G.
Ridlen
a,
Israel
Fernández
 *b and
H. V. Rasika
Dias
 *a
*a
aDepartment of Chemistry and Biochemistry, The University of Texas at Arlington, Arlington, Texas 76019, USA. E-mail: dias@uta.edu
bDepartamento de Química Orgánica I and Centro de Innovación en Química Avanzada (ORFEO-CINQA), Facultad de Ciencias Químicas, Universidad Complutense de Madrid, 28040-Madrid, Spain. E-mail: israel@quim.ucm.es
First published on 20th May 2022
Abstract
Copper and silver play important roles in acetylene transformations but isolable molecules with acetylene bonded to Cu(I) and Ag(I) ions are scarce. This report describes the stabilization of π-acetylene complexes of such metal ions supported by fluorinated and non-fluorinated, pyrazole-based chelators. These Cu(I) and Ag(I) complexes were formed readily in solutions under an atmosphere of excess acetylene and the appropriate ligand supported metal precursor, and could be isolated as crystalline solids, enabling complete characterization using multiple tools including X-ray crystallography. Molecules that display κ2-or κ3-ligand coordination modes and trigonal planar or tetrahedral metal centers have been observed. Different trends in coordination shifts of the acetylenic carbon resonance were revealed by 13C NMR spectroscopy for the Cu(I) and Ag(I) complexes. The reduction in acetylene ![[small nu, Greek, macron]](https://www.rsc.org/images/entities/i_char_e0ce.gif) C
C![[triple bond, length as m-dash]](https://www.rsc.org/images/entities/char_e002.gif) C due to metal ion coordination is relatively large for copper adducts. Computational tools were also used to quantitatively understand in detail the bonding situation in these species. It is found that the interaction between the transition metal fragment and the acetylene ligand is significantly stronger in the copper complexes, which is consistent with the experimental findings. The C
C due to metal ion coordination is relatively large for copper adducts. Computational tools were also used to quantitatively understand in detail the bonding situation in these species. It is found that the interaction between the transition metal fragment and the acetylene ligand is significantly stronger in the copper complexes, which is consistent with the experimental findings. The C![[triple bond, length as m-dash]](https://www.rsc.org/images/entities/char_e002.gif) C distance of these copper and silver acetylene complexes resulting from routine X-ray models suffers due to incomplete deconvolution of thermal smearing and anisotropy of the electron density in acetylene, and is shorter than expected. A method to estimate the C
C distance of these copper and silver acetylene complexes resulting from routine X-ray models suffers due to incomplete deconvolution of thermal smearing and anisotropy of the electron density in acetylene, and is shorter than expected. A method to estimate the C![[triple bond, length as m-dash]](https://www.rsc.org/images/entities/char_e002.gif) C distance of these metal complexes based on their experimental
C distance of these metal complexes based on their experimental ![[small nu, Greek, macron]](https://www.rsc.org/images/entities/i_char_e0ce.gif) C
C![[triple bond, length as m-dash]](https://www.rsc.org/images/entities/char_e002.gif) C is also presented.
C is also presented.
Introduction
Acetylene (C2H2) is a useful building block in organic and industrial chemistry.1 It is usually obtained from coal via a process involving calcium carbide (which is different from the petroleum-based, other important C2-feedstock, ethylene).1c,2 However, compared to ethylene, the applications involving acetylene are somewhat challenging due to its fire and explosion risks, especially under high-pressure conditions and in purified form.1c Furthermore, additional care must be taken when certain metals such as copper and silver are involved because they are known to form explosive acetylides and carbides with acetylene.1a,3 Nevertheless, transition metals, including copper and silver, have been utilized successfully in many acetylene transformations.1a,b,4 Selective semi-hydrogenation of acetylene in ethylene-rich gas streams to produce ethylene is one such application with great industrial importance, as it serves as an effective method to remove acetylene impurities in ethylene feedstocks. Silver-modified palladium is the most commonly used catalyst for this purpose.5 Various other silver and copper containing materials and copper complexes are also known to facilitate this process.5a,6 Silver mediated addition7 and carboxylation8 reactions of acetylene and use in acetylene sensing9 have been reported. Copper and/or copper salts also play diverse roles in acetylene chemistry as in the ethynylation (e.g., in the 1,4-butynedione synthesis), hydrochlorination, carbonylation, cross-couplings, and azide–alkyne cycloaddition reactions, as well as vinylacetylene and cuprene synthesis.1,10 Acetylene has also been separated very effectively from CO2 using copper containing materials.11 The metal carbide formations noted above could be considered as “C–H activation” processes.12 Although limitations must be considered, the advancements stated herein show that copper and silver play an integral role in the acetylene chemistry.The fundamental chemistry such as structures and bonding of π-acetylene complexes of copper and silver are of significant interest because they provide useful information for the design and development of processes for separation,13 activation, and utilization of this important C2-feedstock chemical.1 However, despite over a 100 year history of coinage metal (Cu, Ag, Au) chemistry of acetylene,3b,14 and the current importance,1a,4 well-characterized molecules featuring terminal Cu(η2-HC![[triple bond, length as m-dash]](https://www.rsc.org/images/entities/char_e002.gif) CH) and Ag(η2-HC
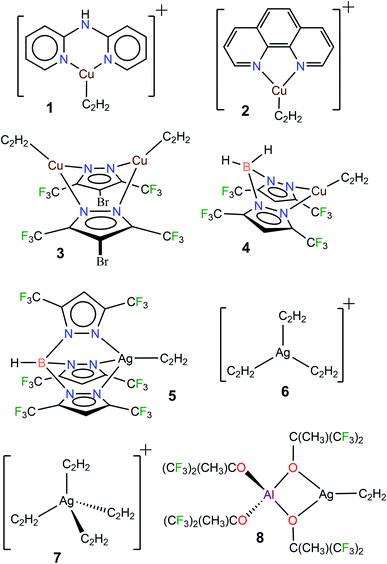
CH) and Ag(η2-HC![[triple bond, length as m-dash]](https://www.rsc.org/images/entities/char_e002.gif) CH) bonds are still very limited. For example, a search of the Cambridge Structural Database15 revealed only four copper complexes, [Cu{NH(Py)2}(C2H2)][BF4] (1[BF4]),16 [Cu(phen)(C2H2)][ClO4] (2[ClO4]),17 Cu2(μ-[4-Br-3,5-(CF3)2Pz])2(C2H2)2 (3),10a and [H2B(3,5-(CF3)2Pz)2]Cu(C2H2) (4),18 and four silver complexes [HB(3,5-(CF3)2Pz)3]Ag(C2H2) (5),19 [Ag(C2H2)3][Al(OC(CF3)3)4] (6[Al(OC(CF3)3)4]),20 [Ag(C2H2)4][Al(OC(CF3)3)4] (7[Al(OC(CF3)3)4]),20 and [Al(OC(CH3)(CF3)2)4]Ag(C2H2) (8)20 containing terminal M(η2-HC
CH) bonds are still very limited. For example, a search of the Cambridge Structural Database15 revealed only four copper complexes, [Cu{NH(Py)2}(C2H2)][BF4] (1[BF4]),16 [Cu(phen)(C2H2)][ClO4] (2[ClO4]),17 Cu2(μ-[4-Br-3,5-(CF3)2Pz])2(C2H2)2 (3),10a and [H2B(3,5-(CF3)2Pz)2]Cu(C2H2) (4),18 and four silver complexes [HB(3,5-(CF3)2Pz)3]Ag(C2H2) (5),19 [Ag(C2H2)3][Al(OC(CF3)3)4] (6[Al(OC(CF3)3)4]),20 [Ag(C2H2)4][Al(OC(CF3)3)4] (7[Al(OC(CF3)3)4]),20 and [Al(OC(CH3)(CF3)2)4]Ag(C2H2) (8)20 containing terminal M(η2-HC![[triple bond, length as m-dash]](https://www.rsc.org/images/entities/char_e002.gif) CH) bonds (Fig. 1, M = Cu, Ag). It is also noteworthy that these few isolable species differ in terms of charge, coordination number and/or supporting ligands, and therefore are of limited use for comparisons. Even the gas-phase studies of Cu and Ag acetylene species are quite limited.21 This scarcity is perhaps due to challenges such as facile loss of coordinated acetylene, metal acetylide and carbide formation, and the potential safety hazards associated with this work.3
CH) bonds (Fig. 1, M = Cu, Ag). It is also noteworthy that these few isolable species differ in terms of charge, coordination number and/or supporting ligands, and therefore are of limited use for comparisons. Even the gas-phase studies of Cu and Ag acetylene species are quite limited.21 This scarcity is perhaps due to challenges such as facile loss of coordinated acetylene, metal acetylide and carbide formation, and the potential safety hazards associated with this work.3
Considering the importance of copper and silver in acetylene chemistry, we set out to uncover and characterize a group of molecules suitable for detailed comparisons and analysis. Herein we report the successful stabilization of several π-acetylene complexes of copper(I) and silver(I) and their spectroscopic features and X-ray crystal structures (Fig. 2). Furthermore, in this work, we demonstrate the utility of bis- and tris(pyrazolyl)borate ligands, [Ph2B(3-(CF3)Pz)2]−, [HB(3,5-(CF3)2Pz)3]−, and [HB(3-(CF3),5-(Ph)Pz)3]− to stabilize neutral, and bis(pyrazolyl)methane H2C(3,5-(CH3)2Pz)2 to isolate cationic, copper and silver acetylene complexes. A complete, comparative analysis of the bonding situation of these metal-acetylene complexes using density functional theory (DFT) calculations is also presented.
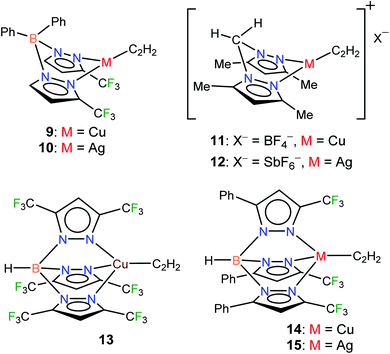 | ||
| Fig. 2 Structures of stabilized π-acetylene complexes of copper(I) and silver(I) described in this work. | ||
Results and discussion
Synthesis of copper and silver complexes of acetylene supported by scorpionates
Fluorinated scorpionates22 have been quite useful in producing isolable molecules of reactive and/or labile organometallic fragments, including ethylene complexes of coinage metal ions.23 Thus, we turned to the same family of supporting ligands as the starting point for this challenging endeavor to stabilize molecules with Cu(η2-HC![[triple bond, length as m-dash]](https://www.rsc.org/images/entities/char_e002.gif) CH) and Ag(η2-HC
CH) and Ag(η2-HC![[triple bond, length as m-dash]](https://www.rsc.org/images/entities/char_e002.gif) CH) bonds. Indeed, the fluorinated bis(pyrazolyl)borate copper(I) complex [Ph2B(3-(CF3)Pz)2]Cu(C2H4)23g undergoes a displacement reaction quite readily with purified acetylene (∼1 atm)1a,24 in CH2Cl2, affording [Ph2B(3-(CF3)Pz)2]Cu(C2H2) (9) as a white solid in 98% yield (Scheme 1). The related silver(I) complex [Ph2B(3-(CF3)Pz)2]Ag(C2H2) (10) has been synthesized from [Ph2B(3-(CF3)Pz)2]Tl,23g silver triflate and purified C2H2 (∼1 atm) and isolated as a white powder in 52% yield. Synthesis of the silver–acetylene complex supported by [H2B(3,5-(CF3)2Pz)2]− was also attempted but the target product could not be isolated due to the decomposition in solution, likely caused by the reduction of Ag(I) to silver metal by the BH2 group. Note however that the copper complex [H2B(3,5-(CF3)2Pz)2]Cu(C2H2) (4) is isolable.18
CH) bonds. Indeed, the fluorinated bis(pyrazolyl)borate copper(I) complex [Ph2B(3-(CF3)Pz)2]Cu(C2H4)23g undergoes a displacement reaction quite readily with purified acetylene (∼1 atm)1a,24 in CH2Cl2, affording [Ph2B(3-(CF3)Pz)2]Cu(C2H2) (9) as a white solid in 98% yield (Scheme 1). The related silver(I) complex [Ph2B(3-(CF3)Pz)2]Ag(C2H2) (10) has been synthesized from [Ph2B(3-(CF3)Pz)2]Tl,23g silver triflate and purified C2H2 (∼1 atm) and isolated as a white powder in 52% yield. Synthesis of the silver–acetylene complex supported by [H2B(3,5-(CF3)2Pz)2]− was also attempted but the target product could not be isolated due to the decomposition in solution, likely caused by the reduction of Ag(I) to silver metal by the BH2 group. Note however that the copper complex [H2B(3,5-(CF3)2Pz)2]Cu(C2H2) (4) is isolable.18
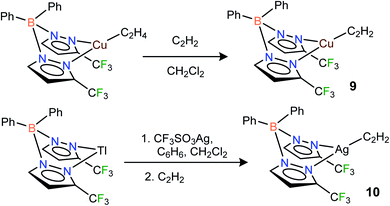 | ||
| Scheme 1 Structures and synthetic routes to bis(pyrazolyl)borate complexes [Ph2B(3-(CF3)Pz)2]Cu(C2H2) (9), [Ph2B(3-(CF3)Pz)2]Ag(C2H2)(10). | ||
Neutral bis(pyrazolyl)methane donors are close relatives of the anionic, bis(pyrazolyl)borates.22b,23a We discovered that even the non-fluorinated and easily accessible H2C(3,5-(CH3)2Pz)2 can be employed to stabilize copper and silver acetylene complexes successfully. For example, the cationic, bis(pyrazolyl)methane copper(I) complex [{H2C(3,5-(CH3)2Pz)2}Cu(C2H2)][BF4] (11) can be obtained as a white solid in 97% yield by treating the copper(I) acetonitrile complex [{H2C(3,5-(CH3)2Pz)2}Cu(CH3CN)][BF4]23i with purified acetylene in CH2Cl2 (Scheme 2). The bis(pyrazolyl)methane silver(I) complex [{H2C(3,5-(CH3)2Pz)2}Ag(C2H2)][SbF6] (12) was synthesized from [{H2C(3,5-(CH3)2Pz)2}Ag(C2H4)][SbF6]23i by displacing ethylene with acetylene in CH2Cl2 and isolated in 93% yield as a white powder.
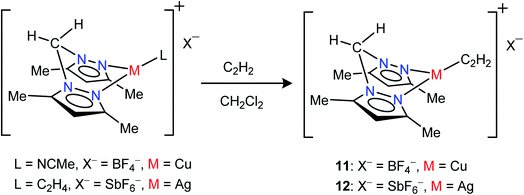 | ||
| Scheme 2 Structures and synthetic routes to bis(pyrazolyl)methane complexes [{H2C(3,5-(CH3)2Pz)2}Cu(C2H2)][BF4] (11) and [{H2C(3,5-(CH3)2Pz)2}Ag(C2H2)][SbF6](12). | ||
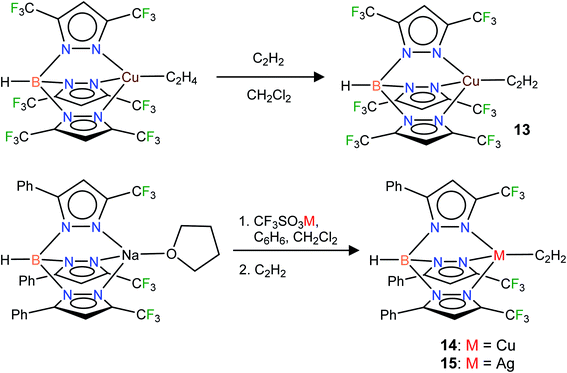
In addition to the 3-coordinate species described above, we also wanted to isolate 4-coordinate Cu(I) and Ag(I) acetylene complexes using tridentate chelators and probe their chemistry. As apparent from the list of molecules illustrated in Fig. 1, such species are the minority. We found that [HB(3,5-(CF3)2Pz)3]Cu(C2H2) (13) supported by a highly fluorinated tris(pyrazolyl)borate can be obtained in essentially quantitative yield from the corresponding ethylene complex [HB(3,5-(CF3)2Pz)3]Cu(C2H4)23c (Scheme 3). It is the copper analog of the silver-η2-acetylene complex [HB(3,5-(CF3)2Pz)3]Ag(C2H2) (5).19 Furthermore, the copper(I) and silver(I) complexes [HB(3-(CF3),5-(Ph)Pz)3]Cu(C2H2) (14) and [HB(3-(CF3),5-(Ph)Pz)3]Ag(C2H2) (15) supported by a relatively less fluorinated tris(pyrazolyl)borate have been synthesized starting from the ligand sodium salt [HB(3-(CF3),5-(Ph)Pz)3]Na(THF)25 and the corresponding metal triflate and acetylene (Scheme 3), and isolated as solids in 69% and 71% yield, respectively. Molecular pairs such as 13, 14 and 5, 15 serve as ideal systems to investigate ligand effects on spectroscopic and structural features of the M(η2-HC![[triple bond, length as m-dash]](https://www.rsc.org/images/entities/char_e002.gif) CH) group. We have also attempted the synthesis of gold(I)-acetylene analogs using several supporting ligands. However, no isolable molecules could be obtained thus far due to facile decomposition.
CH) group. We have also attempted the synthesis of gold(I)-acetylene analogs using several supporting ligands. However, no isolable molecules could be obtained thus far due to facile decomposition.
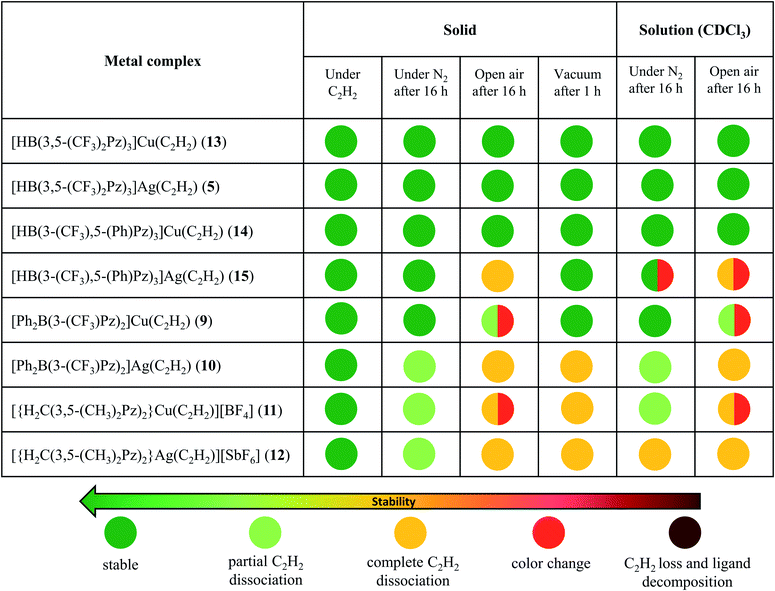
Copper and silver complexes 9–15 are thermally stable solids at room temperature under an acetylene atmosphere. They can be handled, even in air, for brief periods (e.g., to prepare NMR samples) without signs of decomposition. Solid samples of 10–12 show some acetylene loss under nitrogen after several hours (Table 1) but lose acetylene rapidly and completely under reduced pressure. They all however retain the intact scorpionate ligands even after the acetylene loss, as evident from the NMR data. In fact, except in 10, the original acetylene complexes can be regenerated by exposing acetylene-free solids to C2H2 gas in solution. Compound 10 forms a somewhat insoluble solid (presumably a polymeric material generated as observed with {[PhB(3-(CF3)Pz)3]Ag}∞)26 with the loss of C2H2, impeding the reverse, acetylene fixing process. The tris(pyrazolyl)borate complexes 13, 14 and 5 are notably stable copper and silver acetylene complexes under a variety of conditions. The 1H NMR data of 9 and 11–15 taken immediately after preparing solutions in CDCl3 show the expected products without signs of decomposition or C2H2 loss (while compound 10 indicates some C2H2 loss). Additional details on the stability of copper and silver acetylene complex pairs in the solid form and solution (CDCl3) at room temperature are presented in Table 1 (and ESI†).
Table 2 shows available, albeit limited, key 1H and 13C NMR data and C![[triple bond, length as m-dash]](https://www.rsc.org/images/entities/char_e002.gif) C stretch of structurally characterized copper and silver complexes 1–8 and those of the newly synthesized complexes 9–15. A copper complex Cu4(μ-[3,5-(CF3)2Pz])4(μ-HC
C stretch of structurally characterized copper and silver complexes 1–8 and those of the newly synthesized complexes 9–15. A copper complex Cu4(μ-[3,5-(CF3)2Pz])4(μ-HC![[triple bond, length as m-dash]](https://www.rsc.org/images/entities/char_e002.gif) CH)2 containing a μ2-η2,η2-(HC
CH)2 containing a μ2-η2,η2-(HC![[triple bond, length as m-dash]](https://www.rsc.org/images/entities/char_e002.gif) CH) (which is a bridging acetylene)10a has also been included for comparisons. The 1H NMR spectra of copper(I) complexes in general show a larger downfield shift (shift towards the typical alkene region) of acetylenic proton signal from the free acetylene resonance, whereas the silver analog shows only a smaller congruent shift. For example, the room temperature 1H NMR spectrum of 9 in CDCl3 exhibited the acetylenic proton resonance at δ 4.22 ppm which is a significant downfield shift relative to the corresponding signal of the free acetylene (δ 1.91 ppm). Furthermore, the acetylenic protons of cationic 11 in (CD3)2CO were observed at δ 5.14 ppm. This also indicates that the acetylene on [{H2C(3,5-(CH3)2Pz)2}Cu]+ does not get displaced by acetone. The corresponding resonance of silver complexes 10 and 12 was observed at δ 2.13 and 2.25 ppm, respectively, closer to the free acetylene peak position. The 13C NMR resonances of the copper(I) and silver(I) coordinated acetylene carbons are interesting in the sense that they show shifts in opposite directions from that of the free acetylene carbon signal (Table 2). For example, 13C NMR resonance of the acetylenic carbons of free acetylene, copper complex 9 and silver complex 10 has been observed at δ 72.0, 78.7, and 70.9 ppm, respectively. Note that there are other d-block metal-acetylene complexes with comparatively larger shifts in acetylenic proton and carbon signals.27 For example, (Ph3P)2Ni(HC
CH) (which is a bridging acetylene)10a has also been included for comparisons. The 1H NMR spectra of copper(I) complexes in general show a larger downfield shift (shift towards the typical alkene region) of acetylenic proton signal from the free acetylene resonance, whereas the silver analog shows only a smaller congruent shift. For example, the room temperature 1H NMR spectrum of 9 in CDCl3 exhibited the acetylenic proton resonance at δ 4.22 ppm which is a significant downfield shift relative to the corresponding signal of the free acetylene (δ 1.91 ppm). Furthermore, the acetylenic protons of cationic 11 in (CD3)2CO were observed at δ 5.14 ppm. This also indicates that the acetylene on [{H2C(3,5-(CH3)2Pz)2}Cu]+ does not get displaced by acetone. The corresponding resonance of silver complexes 10 and 12 was observed at δ 2.13 and 2.25 ppm, respectively, closer to the free acetylene peak position. The 13C NMR resonances of the copper(I) and silver(I) coordinated acetylene carbons are interesting in the sense that they show shifts in opposite directions from that of the free acetylene carbon signal (Table 2). For example, 13C NMR resonance of the acetylenic carbons of free acetylene, copper complex 9 and silver complex 10 has been observed at δ 72.0, 78.7, and 70.9 ppm, respectively. Note that there are other d-block metal-acetylene complexes with comparatively larger shifts in acetylenic proton and carbon signals.27 For example, (Ph3P)2Ni(HC![[triple bond, length as m-dash]](https://www.rsc.org/images/entities/char_e002.gif) CH)28 complex involving the significantly better backbonding Ni(0) displays its proton and carbon signals for the nickel-bound η2-(HC
CH)28 complex involving the significantly better backbonding Ni(0) displays its proton and carbon signals for the nickel-bound η2-(HC![[triple bond, length as m-dash]](https://www.rsc.org/images/entities/char_e002.gif) CH) in 1H and 13C NMR spectra at δ 6.41, 122 ppm, respectively.
CH) in 1H and 13C NMR spectra at δ 6.41, 122 ppm, respectively.
![[small nu, Greek, macron]](https://www.rsc.org/images/entities/i_char_e0ce.gif) C
C![[triple bond, length as m-dash]](https://www.rsc.org/images/entities/char_e002.gif) C =
C = ![[small nu, Greek, macron]](https://www.rsc.org/images/entities/i_char_e0ce.gif) C
C![[triple bond, length as m-dash]](https://www.rsc.org/images/entities/char_e002.gif) C (metal complex) –
C (metal complex) – ![[small nu, Greek, macron]](https://www.rsc.org/images/entities/i_char_e0ce.gif) C
C![[triple bond, length as m-dash]](https://www.rsc.org/images/entities/char_e002.gif) C (free acetylene))a
C (free acetylene))a
| Compound | Raman/IR (cm−1) (C![[triple bond, length as m-dash]](https://www.rsc.org/images/entities/char_e002.gif) C) C) |
Δ![[small nu, Greek, macron]](https://www.rsc.org/images/entities/i_char_e0ce.gif) C C![[triple bond, length as m-dash]](https://www.rsc.org/images/entities/char_e002.gif) C (cm−1) C (cm−1) |
1H NMR (ppm) (C2H2) | Δδ (ppm) |
13C{1H} NMR (ppm) (C![[triple bond, length as m-dash]](https://www.rsc.org/images/entities/char_e002.gif) C) C) |
Δδ (ppm) | Ref. |
|---|---|---|---|---|---|---|---|
| a Some NMR data in solvents other than CDCl3. b (CD3)2CO. c CD2Cl2. d A copper complex featuring a bridging acetylene ligand (serving as a formally 4e-donor) for comparisons. e NMR data collected at −70 °C. | |||||||
| [Ph2B(3-(CF3)Pz)2]Cu(C2H2) (9) | 1807 | −167 | 4.22 | 2.31 | 78.7 | 6.7 | This work |
| [HB(3-(CF3),5-(Ph)Pz)3]Cu(C2H2) (14) | 1829 | −145 | 4.66 | 2.75 | 76.5 | 4.5 | This work |
| [HB(3,5-(CF3)2Pz)3]Cu(C2H2) (13) | 1845 | −129 | 4.50 | 2.59 | 75.8 | 3.8 | This work |
| [{H2C(3,5-(CH3)2Pz)2}Cu(C2H2)][BF4] (11) | 1812 | −162 | 5.14b | 2.73 | 79.5b | 5.9 | This work |
| [H2B(3,5-(CF3)2Pz)2]Cu(C2H2) (4) | 1819 | −155 | 4.70 | 2.79 | 80.2 | 8.2 | 18 |
| Cu2(μ-[4-Br-3,5-(CF3)2Pz])2(C2H2)2 (3) | 1811 | −163 | 4.75c,e | 2.95 | — | — | 10a |
| [Cu{NH(Py)2}(C2H2)][BF4] (1[BF4]) | 1795 | −179 | 5.59b | 3.18 | — | — | 16 |
| [Cu(phen)(C2H2)][ClO4] (2[ClO4]) | 1800 | −174 | — | — | — | — | 17 |
| Cu4(μ-[3,5-(CF3)2Pz])4(μ-C2H2)2d | 1638 | −336 | 6.16 | 4.25 | 79.2 | 7.2 | 10a |
| [Ph2B(3-(CF3)Pz)2]Ag(C2H2) (10) | — | — | 2.13 | 0.22 | 70.9 | −1.1 | This work |
| [HB(3-(CF3),5-(Ph)Pz)3]Ag(C2H2) (15) | 1895 | −79 | 3.59c | 1.79 | 66.7c | −5.2 | This work |
| [HB(3,5-(CF3)2Pz)3]Ag(C2H2) (5) | 1905 | −69 | 3.48 | 1.57 | 66.3 | −5.6 | 19 |
| [{H2C(3,5-(CH3)2Pz)2}Ag(C2H2)][SbF6] (12) | — | — | 2.25c | 0.45 | 71.7c | −0.2 | This work |
| [Al(OC(CH3)(CF3)2)4]Ag(C2H2) (8) | 1914 | −60 | 3.03c | 1.23 | 69.7c | −2.3 | 20 |
| [Ag(C2H2)3][Al(OC(CF3)3)4] (6[Al(OC(CF3)3)4]) | 1925 | −49 | 2.87c | 1.07 | 72.8c | 0.9 | 20 |
| [Ag(C2H2)4][Al(OC(CF3)3)4] (7[Al(OC(CF3)3)4]) | 1940 | −34 | 2.66c | 0.86 | 72.7c | 0.8 | 20 |
| Free C2H2 | 1974 | 0 | 1.91 (CDCl3) | 0 | 72.0 (CDCl3) | 0 | This work, 20 and 29 |
| 2.41 ((CD3)2CO) | 73.6 ((CD3)2CO) | ||||||
| 1.80 (CD2Cl2) | 71.9 (CD2Cl2) | ||||||
The Raman and IR data of the η2-(HC![[triple bond, length as m-dash]](https://www.rsc.org/images/entities/char_e002.gif) CH) copper(I) complexes show a reduction of C
CH) copper(I) complexes show a reduction of C![[triple bond, length as m-dash]](https://www.rsc.org/images/entities/char_e002.gif) C stretch by over >100 cm−1 with an average of reduction of 160 cm−1 relative to that of the free acetylene stretch observed at 1974 cm−1.29 This implies a weakening of the C
C stretch by over >100 cm−1 with an average of reduction of 160 cm−1 relative to that of the free acetylene stretch observed at 1974 cm−1.29 This implies a weakening of the C![[triple bond, length as m-dash]](https://www.rsc.org/images/entities/char_e002.gif) C bond due to σ/π-interaction between copper(I) and acetylene (both components reduce the CC bond order) in terms of the Dewar–Chatt–Duncanson picture.30 However, the reduction in wavenumber is not as high as that observed with Cu4(μ-[3,5-(CF3)2Pz])4(μ-HC
C bond due to σ/π-interaction between copper(I) and acetylene (both components reduce the CC bond order) in terms of the Dewar–Chatt–Duncanson picture.30 However, the reduction in wavenumber is not as high as that observed with Cu4(μ-[3,5-(CF3)2Pz])4(μ-HC![[triple bond, length as m-dash]](https://www.rsc.org/images/entities/char_e002.gif) CH)2 containing bridging acetylenes, which is understandable. Furthermore, ligand effects on
CH)2 containing bridging acetylenes, which is understandable. Furthermore, ligand effects on ![[small nu, Greek, macron]](https://www.rsc.org/images/entities/i_char_e0ce.gif) C
C![[triple bond, length as m-dash]](https://www.rsc.org/images/entities/char_e002.gif) C are also apparent from some related complexes in which weakly donating ligand support on copper(I) produces molecules that display relatively higher HC
C are also apparent from some related complexes in which weakly donating ligand support on copper(I) produces molecules that display relatively higher HC![[triple bond, length as m-dash]](https://www.rsc.org/images/entities/char_e002.gif) CH stretch, e.g., 9vs.4 or 14vs.13. Compared to Cu(I), the effect of Ag(I) on η2-(HC
CH stretch, e.g., 9vs.4 or 14vs.13. Compared to Cu(I), the effect of Ag(I) on η2-(HC![[triple bond, length as m-dash]](https://www.rsc.org/images/entities/char_e002.gif) CH) is relatively small as evident from a significantly smaller reduction (average 60 cm−1 reduction from the corresponding stretch of the free C2H2). This is in agreement with silver(I) being a weaker σ-bonding and π-backbonding metal ion compared to copper(I) atom (e.g., d10 → d10s1 electron affinities of Cu(I) and Ag(I) ions are 7.72 and 7.57 eV, in terms of energy released, respectively, and d10 → d9p1 promotional energies of Cu(I) and Ag(I) are 8.25 and 9.94 eV, respectively).31 A much more detailed analysis of metal-acetylene bonding using DFT is also given below. Unfortunately, the background fluorescence and acetylene loss prevented the observation of the
CH) is relatively small as evident from a significantly smaller reduction (average 60 cm−1 reduction from the corresponding stretch of the free C2H2). This is in agreement with silver(I) being a weaker σ-bonding and π-backbonding metal ion compared to copper(I) atom (e.g., d10 → d10s1 electron affinities of Cu(I) and Ag(I) ions are 7.72 and 7.57 eV, in terms of energy released, respectively, and d10 → d9p1 promotional energies of Cu(I) and Ag(I) are 8.25 and 9.94 eV, respectively).31 A much more detailed analysis of metal-acetylene bonding using DFT is also given below. Unfortunately, the background fluorescence and acetylene loss prevented the observation of the ![[small nu, Greek, macron]](https://www.rsc.org/images/entities/i_char_e0ce.gif) C
C![[triple bond, length as m-dash]](https://www.rsc.org/images/entities/char_e002.gif) C band of some silver complexes reported in this manuscript.
C band of some silver complexes reported in this manuscript.
X-ray crystal structures of copper and silver acetylene complexes supported by scorpionates
The copper and silver acetylene complexes, [Ph2B(3-(CF3)Pz)2]Cu(C2H2) (9) and [Ph2B(3-(CF3)Pz)2]Ag(C2H2) (10) afforded excellent single crystals and were characterized by X-ray crystallography. Fig. 3 depicts the molecular structures of these molecules. They are three-coordinate, trigonal planar metal complexes with κ2-bound [Ph2B(3-(CF3)Pz)2]− ligands. The acetylene ligand coordinates to the metal in a familiar η2-fashion. The M(NN)2B core (M = Cu, Ag) adopts a boat conformation. These molecules feature a flanking phenyl group above the metal-acetylene moiety with closest M⋯C(phenyl) separations of 3.01 and 2.88 Å in the Cu and Ag complex, respectively. Although these atoms are within the Bondi's van der Waals separation distances of 3.10 and 3.42 Å (or 4.15 and 4.30 Å proposed by Álvarez)32 for Cu⋯C and Ag⋯C,33 any interactions present between the metal and phenyl group do not affect the trigonal planar geometry at the metal (see also the computational section, below).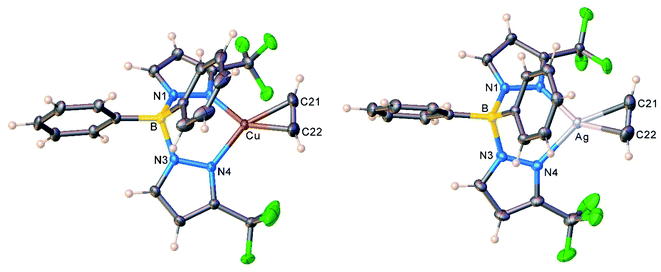 | ||
| Fig. 3 Molecular structures of [Ph2B(3-(CF3)Pz)2]Cu(C2H2) (9, left) and [Ph2B(3-(CF3)Pz)2]Ag(C2H2) (10, right). | ||
The molecular structures of the cationic acetylene complexes [{H2C(3,5-(CH3)2Pz)2}Cu(C2H2)][BF4] (11) and [{H2C(3,5-(CH3)2Pz)2}Ag(C2H2)][SbF6] (12) involving a bis(pyrazolyl)methane ligand are illustrated in Fig. 4. The M(NN)2C core of the bis(pyrazolyl)methane ligand in 11 and 12 adopts a flat boat conformation. The key difference between bis(pyrazolyl)borate and bis(pyrazolyl)methane backbone shapes is reflected in the larger MN⋯NM separation of the pyrazolyl groups of the latter (see ESI Fig. S43†).
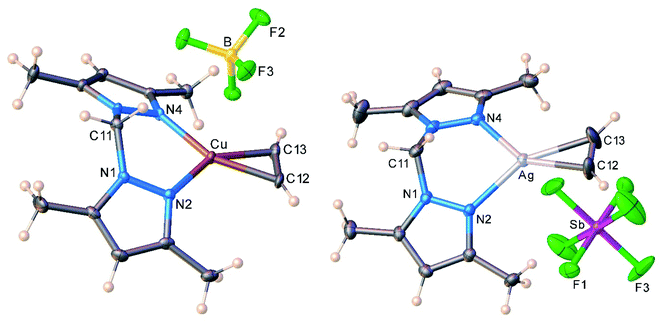 | ||
| Fig. 4 Molecular structures of [{H2C(3,5-(CH3)2Pz)2}Cu(C2H2)][BF4] (11, left) and [{H2C(3,5-(CH3)2Pz)2}Ag(C2H2)][SbF6] (12, right). | ||
As evident from the data presented in Table 3, Cu–N and Cu–C distances of 9 and 11 are shorter than the related separations involving silver in 10 and 12, which is expected as Ag is the largest metal of the coinage metal triad.34 Consequently, the C–Cu–C and N–Cu–N angles are significantly larger than those parameters involving silver. The acetylene ligands of 9 and 10 are essentially coplanar with the N–M–N plane (M = Cu, Ag; silver complex shows the larger twist angle of 3° but it is still minor). This parallel orientation of NMN and CMC planes is the best for maximizing metal-(η2-ligand) backbonding interactions, rather than the orthogonal conformation.35 However in contrast to 9 and 10, C–M–C and N–M–N planes of 11 and 12 deviate somewhat from co-planarity with the copper and silver adducts showing 8.8° and 11.9° inter-planar twist angles. Crystal packing diagrams indicate that one of the fluorine atoms of [BF4]− in 11 sits near Cu at 2.8842(12) Å, while two fluorine atoms of two different [SbF6]− counter-ions are closer to the silver center (at 3.364(4), 3.439(3) Å) of 12. These separations are longer than the Bondi's van der Waals contact separation of F with Cu (2.87 Å) and Ag (3.19 Å), and do not distort the trigonal planar geometry at copper and silver, as evident from the sum of angles at M (M = Cu, Ag) of 360°.
![[small nu, Greek, macron]](https://www.rsc.org/images/entities/i_char_e0ce.gif) C
C![[triple bond, length as m-dash]](https://www.rsc.org/images/entities/char_e002.gif) C data (see Table 2 and eqn. (1)). The CC distance of free ethylene for comparison is 1.3305(10) Å from gas phase data and 1.313 Å from X-ray data38
C data (see Table 2 and eqn. (1)). The CC distance of free ethylene for comparison is 1.3305(10) Å from gas phase data and 1.313 Å from X-ray data38
| Compound | π-CC (Å) | C–M–C (°) | N–M–N (°) | M–N (Å) | C–M (Å) | CN at Ma | Ref. |
|---|---|---|---|---|---|---|---|
| a Coordination number at M. b Two molecules in the asymmetric unit. | |||||||
| [Ph2B(3-(CF3)Pz)2]Cu(C2H2) (9) | 1.217(3) | 36.17(8) | 95.51(4) | 1.9714(10) | 1.9629(14) | 3 | This work |
| 1.236 | 1.9697(10) | 1.9567(15) | |||||
| [{H2C(3,5-(CH3)2Pz)2}Cu(C2H2)][BF4] (11) | 1.203(4) | 35.55(13) | 97.14(9) | 1.978(2) | 1.970(3) | 3 | This work |
| 1.235 | 1.977(2) | 1.971(3) | |||||
| [Ph2B(3-(CF3)Pz)2]Ag(C2H2) (10) | 1.193(3) | 30.63(8) | 82.76(5) | 2.2665(12) | 2.2653(19) | 3 | This work |
| 2.2415(14) | 2.2531(19) | ||||||
| [{H2C(3,5-(CH3)2Pz)2}Ag(C2H2)][SbF6] (12) | 1.203(5) | 31.10(14) | 88.66(9) | 2.220(2) | 2.251(3) | 3 | This work |
| 2.235(2) | 2.237(4) | ||||||
| [HB(3,5-(CF3)2Pz)3]Cu(C2H2) (13) | 1.134(7) | 33.16(19) | 90.17(10) | 2.0466(17) | 1.986(3) | 4 | This work |
| 1.228 | 88.25(7) | 2.0466(17) | 1.986(3) | ||||
| 88.25(7) | 2.179(3) | ||||||
| [HB(3,5-(CF3)2Pz)3]Ag(C2H2) (5) | 1.143(14) | 28.9(4) | 80.99(11) | 2.293(4) | 2.293(4), | 4 | 19 |
| 1.216 | 80.99(11) | 2.347(3) | 2.293(4) | ||||
| 81.1(2) | 2.364(4) | ||||||
![[thin space (1/6-em)]](https://www.rsc.org/images/entities/char_2009.gif) |
|||||||
| [Ph2B(3-(CF3)Pz)2]Cu(C2H4)b | 1.369(2) | 39.59(6) | 93.05(4) | 1.9937(10) | 2.0199(13) | 3 | 23g |
| 1.353(2) | 39.00(6) | 92.30(4) | 1.9870(10) | 2.0225(13) | |||
| 1.9980(10) | 2.0307(14) | ||||||
| 2.0075(10) | 2.0230(15) | ||||||
| [{H2C(3,5-(CH3)2Pz)2}Cu(C2H4)][n-BuBF3] | 1.361(2) | 39.44(6) | 94.45(4) | 1.9885(11) | 2.0153(13) | 3 | 23i |
| 1.9896(11) | 2.0181(13) | ||||||
| [{H2C(3,5-(CH3)2Pz)2}Ag(C2H4)][SbF6] | 1.350(5) | 34.96(12) | 88.96(9) | 2.223(2) | 2.243(3) | 3 | 23i |
| 2.232(2) | 2.253(3) | ||||||
| [{H2C(3,5-(CF3)2Pz)2}Ag(C2H4)][SbF6]b | 1.340(4) | 33.67(11) | 86.44(6) | 2.3306(18) | 2.309(3) | 3 | 23i |
| 1.340(4) | 33.69(11) | 86.49(6) | 2.3328(18) | 2.319(3) | |||
| 2.3330(18) | 2.312(3) | ||||||
| 2.3293(18) | 2.313(3) | ||||||
Interestingly, metrical parameters such as Cu–N and Cu–C distances and N–Cu–N and C–Cu–C angles involving the copper center are quite similar between the cationic [{H2C(3,5-(CH3)2Pz)2}Cu(C2H2)][BF4] (11) and the neutral complexes [Ph2B(3-(CF3)Pz)2]Cu(C2H2) (9). The [{H2C(3,5-(CH3)2Pz)2}Ag(C2H2)][SbF6] (12) and [Ph2B(3-(CF3)Pz)2]Ag(C2H2) (10) also show analogous features at silver. The anionic but weakly coordinating ligand [Ph2B(3-(CF3)Pz)2]− therefore appears to produce the same net result as the neutral and electron-rich H2C(3,5-(CH3)2Pz)2 on the bond distances and angles associated with copper(I) or silver(I).
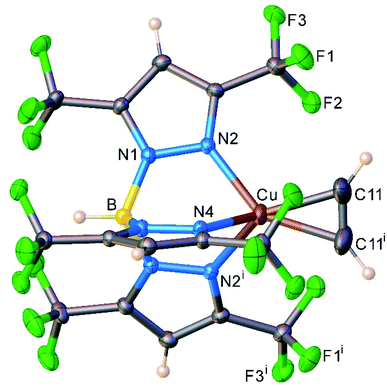
We also managed to characterize [HB(3,5-(CF3)2Pz)3]Cu(C2H2) (13) that has a highly fluorinated tris(pyrazolyl)borate supporting ligand, [HB(3,5-(CF3)2Pz)3]− using single-crystal X-ray crystallography (Fig. 5). Interestingly, 13 is the first four-coordinate, structurally authenticated Cu(η2-HC![[triple bond, length as m-dash]](https://www.rsc.org/images/entities/char_e002.gif) CH) complex. It has a tetrahedral metal site. The copper atom and the centroid of the acetylene group sit on a crystallographic mirror plane. Basic structural features are similar between these copper(I) complexes and the analogous [HB(3,5-(CF3)2Pz)3]Ag(C2H2) (5), but as expected 13 has relatively shorter M–N and M–C distances relative to those of 5 with the larger metal ion.
CH) complex. It has a tetrahedral metal site. The copper atom and the centroid of the acetylene group sit on a crystallographic mirror plane. Basic structural features are similar between these copper(I) complexes and the analogous [HB(3,5-(CF3)2Pz)3]Ag(C2H2) (5), but as expected 13 has relatively shorter M–N and M–C distances relative to those of 5 with the larger metal ion.
The molecular structures of [HB(3-(CF3),5-(Ph)Pz)3]Cu(C2H2) (14) and [HB(3-(CF3),5-(Ph)Pz)3]Ag(C2H2) (15) have also been investigated using X-ray crystallography (see ESI†). Unfortunately, the M(η2-HC![[triple bond, length as m-dash]](https://www.rsc.org/images/entities/char_e002.gif) CH) moieties of these molecules suffer significant positional disorder and therefore are not suitable for the analysis of metrical parameters. We have also observed a similar disorder in copper and silver ethylene complexes of the analogous tripodal scorpionates.23c,39 These molecules possess pockets that allow significant degrees of free motion for the small π-ligands bonded to the metal sites. Nevertheless, basic structural features and atom connectivities of 14 and 15 are clear and indicate the presence of η2-(HC
CH) moieties of these molecules suffer significant positional disorder and therefore are not suitable for the analysis of metrical parameters. We have also observed a similar disorder in copper and silver ethylene complexes of the analogous tripodal scorpionates.23c,39 These molecules possess pockets that allow significant degrees of free motion for the small π-ligands bonded to the metal sites. Nevertheless, basic structural features and atom connectivities of 14 and 15 are clear and indicate the presence of η2-(HC![[triple bond, length as m-dash]](https://www.rsc.org/images/entities/char_e002.gif) CH) moieties, consistent with the spectroscopic data, and tetrahedral metal sites.
CH) moieties, consistent with the spectroscopic data, and tetrahedral metal sites.
As noted above, X-ray crystallographic data on a limited number of copper(I) and silver(I) acetylene complexes are available for comparison. The C![[triple bond, length as m-dash]](https://www.rsc.org/images/entities/char_e002.gif) C bond distance of those compounds and the five uncovered in this work (Table 3 and ESI Table S19†) range from 1.092(7) Å in 7[Al(OC(CF3)3)4]20 to 1.227(4) Å in Cu2(μ-[4-Br-3,5-(CF3)2Pz])2(C2H2)2 (3).10a The C
C bond distance of those compounds and the five uncovered in this work (Table 3 and ESI Table S19†) range from 1.092(7) Å in 7[Al(OC(CF3)3)4]20 to 1.227(4) Å in Cu2(μ-[4-Br-3,5-(CF3)2Pz])2(C2H2)2 (3).10a The C![[triple bond, length as m-dash]](https://www.rsc.org/images/entities/char_e002.gif) C bond distance of Cu(I) and Ag(I) bound acetylene complexes is expected to be longer than that of the free acetylene (which is 1.20286(3) Å based on gas-phase experimental data36 and 1.193(6) Å from neutron diffraction data on solid acetylene),37 as both the σ-donation and π-backdonation interactions between the metal and acetylene causes a reduction in CC bond-order and a lengthening of the C
C bond distance of Cu(I) and Ag(I) bound acetylene complexes is expected to be longer than that of the free acetylene (which is 1.20286(3) Å based on gas-phase experimental data36 and 1.193(6) Å from neutron diffraction data on solid acetylene),37 as both the σ-donation and π-backdonation interactions between the metal and acetylene causes a reduction in CC bond-order and a lengthening of the C![[triple bond, length as m-dash]](https://www.rsc.org/images/entities/char_e002.gif) C bond distance relative to that of the free acetylene. The Raman and IR data (Table 2) also support this expectation. However, most of the metal-bound C
C bond distance relative to that of the free acetylene. The Raman and IR data (Table 2) also support this expectation. However, most of the metal-bound C![[triple bond, length as m-dash]](https://www.rsc.org/images/entities/char_e002.gif) C bond distances of these silver and copper acetylene complexes resulting from X-ray crystallographic studies (Table 3 and ESI Table S19†) are lower than that of the free ligand. As Krossing, Scherer and co-workers have pointed out, this apparent contradiction is a result of systematic errors associated with the measurement.20 In small molecules such as acetylene involving multiple covalent bonds between light atoms, libration effects, incomplete deconvolution of thermal smearing and anisotropy of the electron density tend to produce bond distances that are too short from standard X-ray models.20,40 Such effects can be minimized by collecting data closer to absolute zero temperature and to very high angles (e.g., 2θ = 100°).41 For example, the collection and analysis of the very high-resolution X-ray diffraction data of [Al(OC(CH3)(CF3)2)4]Ag(C2H2) (8) (to resolution d = 0.476 Å) at 10 K has produced a C
C bond distances of these silver and copper acetylene complexes resulting from X-ray crystallographic studies (Table 3 and ESI Table S19†) are lower than that of the free ligand. As Krossing, Scherer and co-workers have pointed out, this apparent contradiction is a result of systematic errors associated with the measurement.20 In small molecules such as acetylene involving multiple covalent bonds between light atoms, libration effects, incomplete deconvolution of thermal smearing and anisotropy of the electron density tend to produce bond distances that are too short from standard X-ray models.20,40 Such effects can be minimized by collecting data closer to absolute zero temperature and to very high angles (e.g., 2θ = 100°).41 For example, the collection and analysis of the very high-resolution X-ray diffraction data of [Al(OC(CH3)(CF3)2)4]Ag(C2H2) (8) (to resolution d = 0.476 Å) at 10 K has produced a C![[triple bond, length as m-dash]](https://www.rsc.org/images/entities/char_e002.gif) C bond distance of 1.209(1) Å,20 which is in good agreement with the theoretical model (1.213 Å), while the same molecule at d = 0.84 Å and 90 K resulted in a length that is 0.063 Å shorter at 1.146(4) Å. This also shows the relative impact of core and valence electrons on the X-ray scattering factors (i.e., scattered X-rays at higher angles are relatively less affected by the valence electrons, and therefore produce more precise nuclear or core-electron positions).42 Although X-ray crystal structures of 9–13 reported here do not reach the resolution level of the specialized work noted above for 8, they are quite respectable (d (resolution) of 0.73 to 0.60 Å at 100 K) for standard X-ray crystallography. Indeed, the analysis of the data of 9-13 at lower resolution levels (e.g., using d = 0.84 Å, 2θ = 50° cut-off) produced relatively shorter C
C bond distance of 1.209(1) Å,20 which is in good agreement with the theoretical model (1.213 Å), while the same molecule at d = 0.84 Å and 90 K resulted in a length that is 0.063 Å shorter at 1.146(4) Å. This also shows the relative impact of core and valence electrons on the X-ray scattering factors (i.e., scattered X-rays at higher angles are relatively less affected by the valence electrons, and therefore produce more precise nuclear or core-electron positions).42 Although X-ray crystal structures of 9–13 reported here do not reach the resolution level of the specialized work noted above for 8, they are quite respectable (d (resolution) of 0.73 to 0.60 Å at 100 K) for standard X-ray crystallography. Indeed, the analysis of the data of 9-13 at lower resolution levels (e.g., using d = 0.84 Å, 2θ = 50° cut-off) produced relatively shorter C![[triple bond, length as m-dash]](https://www.rsc.org/images/entities/char_e002.gif) C bond distances (see ESI, Table S20†). Minor libration effects are also evident even at 100 K based on the TLS analysis (see ESI†).43 Overall, due to a combination of factors noted above, acetylene C
C bond distances (see ESI, Table S20†). Minor libration effects are also evident even at 100 K based on the TLS analysis (see ESI†).43 Overall, due to a combination of factors noted above, acetylene C![[triple bond, length as m-dash]](https://www.rsc.org/images/entities/char_e002.gif) C bond distances based solely on routine X-ray crystallography are not suitable for discussions of metal–ligand bonding in most Cu(I) and Ag(I) complexes, and to parse out the metal and supporting ligand effects on the acetylene moiety. Furthermore, some of the C
C bond distances based solely on routine X-ray crystallography are not suitable for discussions of metal–ligand bonding in most Cu(I) and Ag(I) complexes, and to parse out the metal and supporting ligand effects on the acetylene moiety. Furthermore, some of the C![[triple bond, length as m-dash]](https://www.rsc.org/images/entities/char_e002.gif) C bond distance changes as a result of Cu(I) and especially Ag(I) ion coordination are also expected to be small. They are often overshadowed by the relatively high estimated standard deviations (esds) associated with the measurement and are not significantly different at the 3σ limit of estimated standard deviations. Similar issues have been noted also with ethylene complexes, particularly those involving silver(I).41,44 It is however, possible to estimate the C
C bond distance changes as a result of Cu(I) and especially Ag(I) ion coordination are also expected to be small. They are often overshadowed by the relatively high estimated standard deviations (esds) associated with the measurement and are not significantly different at the 3σ limit of estimated standard deviations. Similar issues have been noted also with ethylene complexes, particularly those involving silver(I).41,44 It is however, possible to estimate the C![[triple bond, length as m-dash]](https://www.rsc.org/images/entities/char_e002.gif) C bond distances of the metal complexes utilizing changes in C
C bond distances of the metal complexes utilizing changes in C![[triple bond, length as m-dash]](https://www.rsc.org/images/entities/char_e002.gif) C vibration. As noted below in the computational section, this technique produces a more realistic estimate of the C
C vibration. As noted below in the computational section, this technique produces a more realistic estimate of the C![[triple bond, length as m-dash]](https://www.rsc.org/images/entities/char_e002.gif) C bond distance for copper and silver acetylene complexes.
C bond distance for copper and silver acetylene complexes.
Table 3 also includes structural data on a select group of Cu(I) and Ag(I) η2-ethylene complexes. With the availability of the analogous acetylene complexes, it is now possible to make a meaningful comparison between the two families. As expected, and despite the issues noted above with CC bond distances based on routine crystallography, the metal-bound acetylene bond distances are significantly shorter than the related ethylene bond lengths. The Cu–C and Cu–N bond distances are also shorter in the copper(I) acetylene complexes compared to their ethylene analogs. Interestingly, however, Ag–N and Ag–C distances are essentially the same in the two families. It would be interesting to see if this difference holds true also for a larger dataset.
Computational analysis of the copper and silver acetylene complexes
Density Functional Theory (DFT) calculations at the relativistic ZORA-BP86-D3/TZ2P//RI-BP86-D3/def2-TZVPP level (see computational details in the ESI†) were carried out to understand the chemical bonding between the scorpionate-M moieties and acetylene in the above-described LM-(C2H2) complexes (L = supporting ligand; M = Cu, Ag). To this end, the combination of the Energy Decomposition Analysis (EDA) and the Natural Orbitals for Chemical Valence (NOCV) methods were applied to gain a detailed quantitative insight into the interaction between the LM and C2H2 fragments. From the data in Table 4, it becomes clear that in all cases the main contribution to the interaction between the LM and C2H2 fragments comes from the electrostatic attractions (measured by the ΔEelstat term), which represents ca. 60% of the total attractive contribution. This indicates that the nature of the LM–acetylene bond is markedly ionic. Despite that, the orbital interactions (measured by the ΔEorb term) are also significant as they contribute ca. 35–40% to the total interaction energy. At variance, the interactions coming from dispersion forces are much less important in the description of the bonding (<5%) and can be considered negligible.| compound | ΔEint | ΔEPauli | ΔEelstata | ΔEorba | ΔEorb(1) | ΔEorb(2) | ΔErest | ΔEdispa |
|---|---|---|---|---|---|---|---|---|
| a The percentage values within parenthesis give the contribution to the total attractive interactions, ΔEelstat+ ΔEorb + ΔEdisp. | ||||||||
| [H2B(3,5-(CF3)2Pz)2]Cu(C2H2) (4) | −55.2 | 133.9 | −109.5 (57.9%) | −73.4 (38.8%) | −19.5 | −41.9 | −12.0 | −6.2 (3.3%) |
| [H2B(3,5-(CF3)2Pz)2]Ag(C2H2) (4-Ag) | −32.8 | 115.1 | −93.7 (63.3%) | −50.5 (34.1%) | −16.4 | −27.5 | −6.6 | −3.8 (2.6%) |
| [H2B(3,5-(CH3)2Pz)2]Cu(C2H2) (4’) | −56.5 | 152.3 | −119.9 (57.4%) | −83.3 (39.9%) | −18.4 | −53.5 | −11.4 | −5.6 (2.7%) |
| [H2B(3,5-(CH3)2Pz)2]Ag(C2H2) (4'-Ag) | −37.1 | 131.7 | −104.0 (61.6%) | −61.8 (36.6%) | −16.8 | −35.7 | −9.3 | −3.0 (1.8%) |
| [Ph2B(3-(CF3)Pz)2]Cu(C2H2) (9) | −55.3 | 136.0 | −110.4 (57.7%) | −73.4 (38.4%) | −19.1 | −42.3 | −12.0 | −7.5 (3.9%) |
| [Ph2B(3-(CF3)Pz)2]Ag(C2H2) (10) | −35.9 | 119.9 | −96.8 (62.1%) | −54.7 (35.1%) | −17.1 | −28.2 | −9.4 | −4.3 (2.8%) |
| [{H2C(3,5-(CH3)2Pz)2}Cu(C2H2)]+ (11+) | −57.2 | 131.6 | −108.4 (57.4%) | −75.2 (39.8%) | −20.4 | −42.4 | −12.4 | −5.3 (2.8%) |
| [{H2C(3,5-(CH3)2Pz)2}Ag(C2H2)]+ (12+) | −37.0 | 111.6 | −91.6 (61.6%) | −54.1 (36.4%) | −18.9 | −25.8 | −9.4 | −2.9 (2.0%) |
| [HB(3,5-(CF3)2Pz)3]Cu(C2H2) (13) | −48.6 | 124.6 | −100.1 (57.8%) | −64.7 (37.4%) | −18.6 | −35.5 | −10.6 | −8.4 (4.8%) |
| [HB(3,5-(CF3)2Pz)3]Ag(C2H2) (5) | −30.9 | 104.7 | −84.3 (62.2%) | −46.4 (34.2%) | −16.6 | −21.2 | −8.8 | −4.9 (3.6%) |
| [HB(3-(CF3),5-(Ph)Pz)3]Cu(C2H2) (14) | −48.6 | 127.6 | −102.0 (57.9%) | −66.1 (37.5%) | −18.0 | −37.5 | −10.6 | −8.1 (4.6%) |
| [HB(3-(CF3),5-(Ph)Pz)3]Ag(C2H2) (15) | −30.8 | 109.0 | −87.1 (62.3%) | −48.0 (34.3%) | −16.1 | −23.4 | −8.5 | −4.7 (3.4%) |
| [Cu(C2H2)]+ (16+) | −64.7 | 92.1 | −86.8 (55.3%) | −68.4 (43.6%) | −20.7 | −30.9 | −16.8 | −1.7 (1.1%) |
| [Ag(C2H2)]+ (17+) | −39.8 | 68.6 | −63.2 (58.3%) | −44.5 (41.1%) | −9.4 | −25.1 | −10.0 | −0.7 (0.6%) |
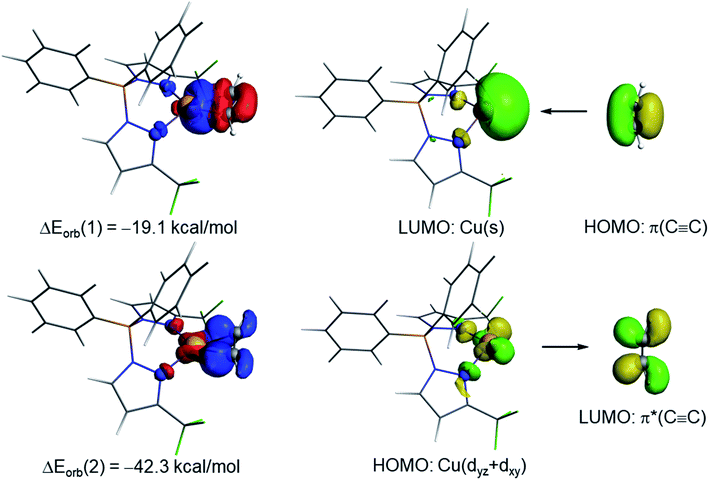
The NOCV extension of the EDA method allows us to not only identify but also quantify the main orbital interactions contributing to the total ΔEorb term. According to the NOCV method, two main donor–acceptor orbital interactions dominate the orbital interactions in these acetylene complexes. On one hand, the σ-donation from the doubly-occupied π(C![[triple bond, length as m-dash]](https://www.rsc.org/images/entities/char_e002.gif) C) molecular orbital of the acetylene ligand to the empty s atomic orbital of the transition metal (denoted as ΔEorb(1)) and, on the other hand, the backdonation from a doubly-occupied d atomic orbital of the transition metal to the vacant π*(C
C) molecular orbital of the acetylene ligand to the empty s atomic orbital of the transition metal (denoted as ΔEorb(1)) and, on the other hand, the backdonation from a doubly-occupied d atomic orbital of the transition metal to the vacant π*(C![[triple bond, length as m-dash]](https://www.rsc.org/images/entities/char_e002.gif) C) molecular orbital of acetylene (denoted as ΔEorb(2), see Fig. 6 for complex 9). Interestingly, our NOCV calculations indicate that, in all cases, the backdonation from the transition metal fragment is significantly stronger (ca. twice as strong) than the donation from the acetylene ligand (ΔEorb(2) > ΔEorb(1)), regardless of the transition metal and the supporting ligand. In addition, our EDA-NOCV calculations confirm that both orbital interactions are stronger (in particular, the LM→ π*(C
C) molecular orbital of acetylene (denoted as ΔEorb(2), see Fig. 6 for complex 9). Interestingly, our NOCV calculations indicate that, in all cases, the backdonation from the transition metal fragment is significantly stronger (ca. twice as strong) than the donation from the acetylene ligand (ΔEorb(2) > ΔEorb(1)), regardless of the transition metal and the supporting ligand. In addition, our EDA-NOCV calculations confirm that both orbital interactions are stronger (in particular, the LM→ π*(C![[triple bond, length as m-dash]](https://www.rsc.org/images/entities/char_e002.gif) C) backdonation) in the Cu(I)-complexes as compared to their Ag(I)-analogues, which is in agreement with the above-commented weaker σ-bonding and π-backbonding ability of Ag(I) as compared to copper(I).31 Despite that, the bonding situation in these acetylene complexes can be safely described in terms of the Dewar–Chatt–Duncanson model involving two donor–acceptor interactions (σ-donation from the acetylene ligand and π-backdonation from the transition metal fragment). Note that the acetylene π/π*-orbitals perpendicular to the MC2 plane form only relatively weaker interactions with the transition metal fragment in these scorpionate ligand supported copper and silver complexes.
C) backdonation) in the Cu(I)-complexes as compared to their Ag(I)-analogues, which is in agreement with the above-commented weaker σ-bonding and π-backbonding ability of Ag(I) as compared to copper(I).31 Despite that, the bonding situation in these acetylene complexes can be safely described in terms of the Dewar–Chatt–Duncanson model involving two donor–acceptor interactions (σ-donation from the acetylene ligand and π-backdonation from the transition metal fragment). Note that the acetylene π/π*-orbitals perpendicular to the MC2 plane form only relatively weaker interactions with the transition metal fragment in these scorpionate ligand supported copper and silver complexes.
Interesting trends emerge from a closer inspection of the data gathered in Table 4. First, when comparing the copper complexes with their silver counterparts, it is found that, regardless of the supporting ligand, the interaction between the transition metal fragment and the acetylene ligand is clearly stronger in the corresponding copper complexes (ΔEint ∼ 20 kcal mol−1). This is consistent with above-commented higher NMR-downfield shifts (or redshifts of the C![[triple bond, length as m-dash]](https://www.rsc.org/images/entities/char_e002.gif) C stretch), with respect to free acetylene, observed experimentally for the copper complexes. According to the data in Table 4, the enhanced interaction in the copper(I) complexes is the result of an enhancement of all the main attractive interactions (ΔEelstat, ΔEorb(1) and ΔEorb(2)) as compared to the corresponding silver(I) complexes. This finding suggests that the observed experimental shifts of these mono-acetylene complexes are closely related to the computed interaction energies (as well as their main energy contributors). To our delight, we found that indeed good linear correlations are obtained when plotting these experimental values versus not only the computed total interaction energies (ΔEint) but also their main EDA-NOCV contributors (see Fig. 7 for the linear relationships involving the 13C-NMR shifts, Δδ). From the data in Fig. 7, there appears to exist a limit defining the observed shift in the 13C-NMR spectra with respect to free acetylene: while complexes having a LM–(C2H2) interaction ΔEint ≥ −40 kcal mol−1 lead to a positive (i.e., downfield) shift with respect to free acetylene (Δδ > 0 ppm), complexes exhibiting lower LM–(C2H2) interaction energies provoke the opposite (i.e., upfield shift) effect (Δδ < 0 ppm).
C stretch), with respect to free acetylene, observed experimentally for the copper complexes. According to the data in Table 4, the enhanced interaction in the copper(I) complexes is the result of an enhancement of all the main attractive interactions (ΔEelstat, ΔEorb(1) and ΔEorb(2)) as compared to the corresponding silver(I) complexes. This finding suggests that the observed experimental shifts of these mono-acetylene complexes are closely related to the computed interaction energies (as well as their main energy contributors). To our delight, we found that indeed good linear correlations are obtained when plotting these experimental values versus not only the computed total interaction energies (ΔEint) but also their main EDA-NOCV contributors (see Fig. 7 for the linear relationships involving the 13C-NMR shifts, Δδ). From the data in Fig. 7, there appears to exist a limit defining the observed shift in the 13C-NMR spectra with respect to free acetylene: while complexes having a LM–(C2H2) interaction ΔEint ≥ −40 kcal mol−1 lead to a positive (i.e., downfield) shift with respect to free acetylene (Δδ > 0 ppm), complexes exhibiting lower LM–(C2H2) interaction energies provoke the opposite (i.e., upfield shift) effect (Δδ < 0 ppm).
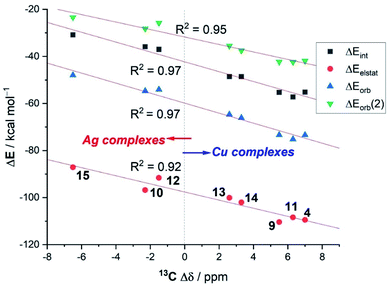 | ||
| Fig. 7 Correlations between the experimental 13C-NMR shifts of the acetylene carbon atom in LM–(C2H2) complexes with respect to free acetylene (Δδ) versus the computed EDA-NOCV energy terms. | ||
Data in Table 4 also indicates that the nature of the supporting ligand also affects the LM−(C2H2) interaction. Regardless of the involved transition metal, it is found that complexes having a bidentate bis(pyrazolyl)borate/methane supporting ligand (complexes 4, 4-Ag, 9, 10, 11+, 12+) exhibit stronger LM-(C2H2) interactions than the analogous systems having a tridentate tris(pyrazolyl)borate ligand (complexes 5, 13, 14, 15). For instance, when comparing bidentate complexes 4 or 4-Ag with their tridentate counterparts 13 or 5, it becomes clear that the weaker interaction computed for the latter complexes finds its origin in the lower electrostatic and orbital (mainly the LM → π*(C![[triple bond, length as m-dash]](https://www.rsc.org/images/entities/char_e002.gif) C) backdonation, ΔEorb(2)) interactions computed for these species. Therefore, it can be concluded that supporting ligands having a lower number of donor sites lead to stronger LM-(C2H2) interactions. This is also supported by the calculations on the naked [Cu(C2H2)]+ and [Ag(C2H2)]+ cations, which exhibit the highest ΔEint values of their corresponding series (see Table 4). Furthermore, it is found that the replacement of bidentate fluorinated bis(pyrazolyl)borate ligand (which is anionic) by the analogous non-fluorinated and neutral bis(pyrazolyl)methane ligand provokes an almost negligible effect on the LM-(C2H2) interaction (e.g., compare 4 and 11+ or 4-Ag and 12+).
C) backdonation, ΔEorb(2)) interactions computed for these species. Therefore, it can be concluded that supporting ligands having a lower number of donor sites lead to stronger LM-(C2H2) interactions. This is also supported by the calculations on the naked [Cu(C2H2)]+ and [Ag(C2H2)]+ cations, which exhibit the highest ΔEint values of their corresponding series (see Table 4). Furthermore, it is found that the replacement of bidentate fluorinated bis(pyrazolyl)borate ligand (which is anionic) by the analogous non-fluorinated and neutral bis(pyrazolyl)methane ligand provokes an almost negligible effect on the LM-(C2H2) interaction (e.g., compare 4 and 11+ or 4-Ag and 12+).
We have also examined the C![[triple bond, length as m-dash]](https://www.rsc.org/images/entities/char_e002.gif) C bond distances and the C
C bond distances and the C![[triple bond, length as m-dash]](https://www.rsc.org/images/entities/char_e002.gif) C stretching frequencies of the copper(I) and silver(I) complexes, computationally. The expected changes to the CC distance are especially useful considering the challenges associated with measuring this parameter precisely noted above. Table 5 shows the computed C
C stretching frequencies of the copper(I) and silver(I) complexes, computationally. The expected changes to the CC distance are especially useful considering the challenges associated with measuring this parameter precisely noted above. Table 5 shows the computed C![[triple bond, length as m-dash]](https://www.rsc.org/images/entities/char_e002.gif) C distances and the corresponding stretching frequencies for the considered Cu(I) and Ag(I)-complexes together with their Au(I)-counterparts and representative group 1 and group 10 analogues.
C distances and the corresponding stretching frequencies for the considered Cu(I) and Ag(I)-complexes together with their Au(I)-counterparts and representative group 1 and group 10 analogues.
![[triple bond, length as m-dash]](https://www.rsc.org/images/entities/char_e002.gif) C bond lengths and corresponding stretching frequencies in the Cu(I), Ag(I) and Au(I)-scorpionate complexes together with representative group 10 analogues and including group 1 complexes 4-Li and 4-Na. All data have been computed at the RI-BP86/def2-TZVPP level. For comparisons, the computed CC distance of free acetylene is 1.207 Å and the frequency is 2007 cm−1
C bond lengths and corresponding stretching frequencies in the Cu(I), Ag(I) and Au(I)-scorpionate complexes together with representative group 10 analogues and including group 1 complexes 4-Li and 4-Na. All data have been computed at the RI-BP86/def2-TZVPP level. For comparisons, the computed CC distance of free acetylene is 1.207 Å and the frequency is 2007 cm−1
| compound |
r
C![[triple bond, length as m-dash]](https://www.rsc.org/images/entities/char_e002.gif) C/Å C/Å |
![[small nu, Greek, macron]](https://www.rsc.org/images/entities/i_char_e0ce.gif) C
C![[triple bond, length as m-dash]](https://www.rsc.org/images/entities/char_e002.gif) C/cm−1 C/cm−1 |
Δ![[small nu, Greek, macron]](https://www.rsc.org/images/entities/i_char_e0ce.gif) C C![[triple bond, length as m-dash]](https://www.rsc.org/images/entities/char_e002.gif) C/cm−1a C/cm−1a |
|---|---|---|---|
a Δ![[small nu, Greek, macron]](https://www.rsc.org/images/entities/i_char_e0ce.gif) C C![[triple bond, length as m-dash]](https://www.rsc.org/images/entities/char_e002.gif) C = C = ![[small nu, Greek, macron]](https://www.rsc.org/images/entities/i_char_e0ce.gif) C C![[triple bond, length as m-dash]](https://www.rsc.org/images/entities/char_e002.gif) C (metal complex) – C (metal complex) – ![[small nu, Greek, macron]](https://www.rsc.org/images/entities/i_char_e0ce.gif) C C![[triple bond, length as m-dash]](https://www.rsc.org/images/entities/char_e002.gif) C (free acetylene). C (free acetylene).
|
|||
| [H2B(3,5-(CF3)2Pz)2]Cu(C2H2) (4) | 1.247 | 1811 | −196 |
| [H2B(3,5-(CF3)2Pz)2]Ag(C2H2) (4-Ag) | 1.240 | 1835 | −172 |
| [H2B(3,5-(CH3)2Pz)2]Cu(C2H2) (4’) | 1.255 | 1778 | −229 |
| [H2B(3,5-(CH3)2Pz)2]Ag(C2H2) (4'-Ag) | 1.248 | 1798 | −209 |
| [Ph2B(3-(CF3)Pz)2]Cu(C2H2) (9) | 1.248 | 1808 | −199 |
| [Ph2B(3-(CF3)Pz)2]Ag(C2H2) (10) | 1.242 | 1829 | −178 |
| [{H2C(3,5-(CH3)2Pz)2}Cu(C2H2)]+ (11+) | 1.249 | 1806 | −201 |
| [{H2C(3,5-(CH3)2Pz)2}Ag(C2H2)]+ (12+) | 1.240 | 1836 | −171 |
| [HB(3,5-(CF3)2Pz)3]Cu(C2H2) (13) | 1.241 | 1841 | −166 |
| [HB(3,5-(CF3)2Pz)3]Ag(C2H2) (5) | 1.235 | 1861 | −146 |
| [HB(3-(CF3),5-(Ph)Pz)3]Cu(C2H2) (14) | 1.242 | 1833 | −174 |
| [HB(3-(CF3),5-(Ph)Pz)3]Ag(C2H2) (15) | 1.237 | 1852 | −155 |
| [H2B(3,5-(CF3)2Pz)2]Au(C2H2) (4-Au) | 1.268 | 1726 | −280 |
| [H2B(3,5-(CH3)2Pz)2]Au(C2H2) (4’-Au) | 1.276 | 1695 | −312 |
| [Ph2B(3-(CF3)Pz)2]Au(C2H2) (9-Au) | 1.269 | 1723 | −284 |
| [{H2C(3,5-(CH3)2Pz)2}Au(C2H2)]+ (11+-Au) | 1.268 | 1729 | −278 |
| [HB(3,5-(CF3)2Pz)3]Au(C2H2) (13-Au) | 1.265 | 1741 | −265 |
| [HB(3-(CF3),5-(Ph)Pz)3]Au(C2H2) (14-Au) | 1.266 | 1737 | −269 |
| [{H2B(3,5-(CF3)2Pz)2}Ni(C2H2)]− (4-Ni-) | 1.287 | 1651 | −356 |
| [{H2B(3,5-(CF3)2Pz)2}Ni(C2H2)]− (4-Pd-) | 1.285 | 1656 | −351 |
| [{H2B(3,5-(CF3)2Pz)2}Ni(C2H2)]− (4-Pt-) | 1.304 | 1594 | −412 |
| [{H2C(3,5-(CH3)2Pz)2}Ni(C2H2)] (11-Ni) | 1.291 | 1638 | −369 |
| [{H2C(3,5-(CH3)2Pz)2}Pd(C2H2)] (11-Pd) | 1.285 | 1656 | −350 |
| [{H2C(3,5-(CH3)2Pz)2}Pt(C2H2)] (11-Pt) | 1.305 | 1592 | −415 |
| [H2B(3,5-(CF3)2Pz)2]Li(C2H2) (4-Li) | 1.210 | 1989 | −18 |
| [H2B(3,5-(CF3)2Pz)2]Na(C2H2) (4-Na) | 1.209 | 1995 | −12 |
From the data in Table 5, it becomes evident that, in all cases, the Cu(I)-complexes exhibit longer C![[triple bond, length as m-dash]](https://www.rsc.org/images/entities/char_e002.gif) C distances than their corresponding Ag(I)-analogues, which is translated into a higher redshift of the
C distances than their corresponding Ag(I)-analogues, which is translated into a higher redshift of the ![[small nu, Greek, macron]](https://www.rsc.org/images/entities/i_char_e0ce.gif) C
C![[triple bond, length as m-dash]](https://www.rsc.org/images/entities/char_e002.gif) C stretching frequency. This is therefore fully consistent with the experimental findings and with the higher LM-(C2H2) interaction energies computed for the Cu(I)-complexes as compared to their Ag(I)-congeners (see above). This effect is even higher in the corresponding Au(I)-complexes which exhibit the longest C
C stretching frequency. This is therefore fully consistent with the experimental findings and with the higher LM-(C2H2) interaction energies computed for the Cu(I)-complexes as compared to their Ag(I)-congeners (see above). This effect is even higher in the corresponding Au(I)-complexes which exhibit the longest C![[triple bond, length as m-dash]](https://www.rsc.org/images/entities/char_e002.gif) C distances in the entire group 11 series. Not surprisingly, even longer distances (associated with higher redshifts, i.e., larger negative Δ
C distances in the entire group 11 series. Not surprisingly, even longer distances (associated with higher redshifts, i.e., larger negative Δ![[small nu, Greek, macron]](https://www.rsc.org/images/entities/i_char_e0ce.gif) C
C![[triple bond, length as m-dash]](https://www.rsc.org/images/entities/char_e002.gif) C values) are found when considering the neutral group 10 transition metal as a consequence of a significantly stronger π-backdonation. In contrast, the analogous group 1 complexes, where the backbonding is minimal, present values rather similar to free acetylene. In addition, data presented in Table 5 show that fluorinated substituents on the supporting ligand L have a noticeable effect on
C values) are found when considering the neutral group 10 transition metal as a consequence of a significantly stronger π-backdonation. In contrast, the analogous group 1 complexes, where the backbonding is minimal, present values rather similar to free acetylene. In addition, data presented in Table 5 show that fluorinated substituents on the supporting ligand L have a noticeable effect on ![[small nu, Greek, macron]](https://www.rsc.org/images/entities/i_char_e0ce.gif) C
C![[triple bond, length as m-dash]](https://www.rsc.org/images/entities/char_e002.gif) C (see for example 4vs.4’; 4-Agvs.4'-Ag). For this reason, it is not surprising that an excellent correlation was found when plotting the difference in the computed C
C (see for example 4vs.4’; 4-Agvs.4'-Ag). For this reason, it is not surprising that an excellent correlation was found when plotting the difference in the computed C![[triple bond, length as m-dash]](https://www.rsc.org/images/entities/char_e002.gif) C distances vs. the shift in the
C distances vs. the shift in the ![[small nu, Greek, macron]](https://www.rsc.org/images/entities/i_char_e0ce.gif) C
C![[triple bond, length as m-dash]](https://www.rsc.org/images/entities/char_e002.gif) C stretching mode with respect to free acetylene (correlation coefficient of 0.999, see Fig. 8), including Δ
C stretching mode with respect to free acetylene (correlation coefficient of 0.999, see Fig. 8), including Δ![[small nu, Greek, macron]](https://www.rsc.org/images/entities/i_char_e0ce.gif) C
C![[triple bond, length as m-dash]](https://www.rsc.org/images/entities/char_e002.gif) C = 0 and ΔrC
C = 0 and ΔrC![[triple bond, length as m-dash]](https://www.rsc.org/images/entities/char_e002.gif) C = 0 for free acetylene. The computed relationship presented in Fig. 8 can be then used to estimate the C
C = 0 for free acetylene. The computed relationship presented in Fig. 8 can be then used to estimate the C![[triple bond, length as m-dash]](https://www.rsc.org/images/entities/char_e002.gif) C distances in the real systems (r(spec), where spec = spectroscopic, eqn (1)) and check the reliability of the X-ray derived data by simply adding the experimental C
C distances in the real systems (r(spec), where spec = spectroscopic, eqn (1)) and check the reliability of the X-ray derived data by simply adding the experimental C![[triple bond, length as m-dash]](https://www.rsc.org/images/entities/char_e002.gif) C distance in acetylene to the calculated distance change (Δr(calc)) using the equation in Fig. 8 and the experimental Δ
C distance in acetylene to the calculated distance change (Δr(calc)) using the equation in Fig. 8 and the experimental Δ![[small nu, Greek, macron]](https://www.rsc.org/images/entities/i_char_e0ce.gif) C
C![[triple bond, length as m-dash]](https://www.rsc.org/images/entities/char_e002.gif) C value (Excel file to compute r(spec) from Δ
C value (Excel file to compute r(spec) from Δ![[small nu, Greek, macron]](https://www.rsc.org/images/entities/i_char_e0ce.gif) C
C![[triple bond, length as m-dash]](https://www.rsc.org/images/entities/char_e002.gif) C is provided in ESI†). A similar method has been utilized successfully by Krossing and co-workers41 to estimate the C
C is provided in ESI†). A similar method has been utilized successfully by Krossing and co-workers41 to estimate the C![[double bond, length as m-dash]](https://www.rsc.org/images/entities/char_e001.gif) C bond distances (i.e., to obtain spectroscopically assessed bond distances, r(spec)), of silver ethylene complexes.
C bond distances (i.e., to obtain spectroscopically assessed bond distances, r(spec)), of silver ethylene complexes.
| r(spec) = 1.20286 + Δr(calc) | (1) |
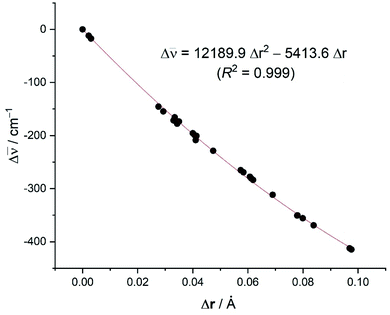 | ||
Fig. 8 Plot of the computed difference in the C![[triple bond, length as m-dash]](https://www.rsc.org/images/entities/char_e002.gif) C bond distances versus the shift of the C bond distances versus the shift of the ![[small nu, Greek, macron]](https://www.rsc.org/images/entities/i_char_e0ce.gif) (C (C![[triple bond, length as m-dash]](https://www.rsc.org/images/entities/char_e002.gif) C) stretch (with respect to free acetylene: rC C) stretch (with respect to free acetylene: rC![[triple bond, length as m-dash]](https://www.rsc.org/images/entities/char_e002.gif) C = 1.207 Å; C = 1.207 Å; ![[small nu, Greek, macron]](https://www.rsc.org/images/entities/i_char_e0ce.gif) C C![[triple bond, length as m-dash]](https://www.rsc.org/images/entities/char_e002.gif) C = 2007 cm−1). C = 2007 cm−1). | ||
As an example, the estimated C![[triple bond, length as m-dash]](https://www.rsc.org/images/entities/char_e002.gif) C bond distances (r(spec)) of 9 and 13 based on the experimental Raman data (Table 2, Δ
C bond distances (r(spec)) of 9 and 13 based on the experimental Raman data (Table 2, Δ![[small nu, Greek, macron]](https://www.rsc.org/images/entities/i_char_e0ce.gif) C
C![[triple bond, length as m-dash]](https://www.rsc.org/images/entities/char_e002.gif) C = −167 and −129 cm−1, respectively) are 1.236 and 1.228 Å, respectively. They are longer than that of the free acetylene, which is more reasonable and expected based on vibrational and computational data. The eqn (1) can also be used to estimate the C
C = −167 and −129 cm−1, respectively) are 1.236 and 1.228 Å, respectively. They are longer than that of the free acetylene, which is more reasonable and expected based on vibrational and computational data. The eqn (1) can also be used to estimate the C![[triple bond, length as m-dash]](https://www.rsc.org/images/entities/char_e002.gif) C bond distance of 8 (i.e., using experimentally observed Δ
C bond distance of 8 (i.e., using experimentally observed Δ![[small nu, Greek, macron]](https://www.rsc.org/images/entities/i_char_e0ce.gif) C
C![[triple bond, length as m-dash]](https://www.rsc.org/images/entities/char_e002.gif) C = −60 cm−1 to afford r(spec) = 1.214 Å), which is very close to the experimental X-ray model value of 1.209(1) Å based on high-resolution data.
C = −60 cm−1 to afford r(spec) = 1.214 Å), which is very close to the experimental X-ray model value of 1.209(1) Å based on high-resolution data.
Finally, we were curious to analyze the nature of the weak yet noticeable interaction between one of the phenyl groups attached to the boron atom and the transition metal in complexes 9 and 10 (see above). The NCIPLOT45 method clearly confirms the occurrence of a significant noncovalent attractive interaction (greenish surface in Fig. 9) between this aryl group and the transition metal. According to the Natural Orbital Bond (NBO)46 method, this stabilizing noncovalent interaction finds its origin in the donation of electron density from the closest π(C![[double bond, length as m-dash]](https://www.rsc.org/images/entities/char_e001.gif) C) molecular orbital of the phenyl group to the vacant s atomic orbital of the transition metal (associated stabilizing energy, ΔE(2) = −1.2 and −1.1 kcal mol−1, for complexes 9 and 10, respectively).
C) molecular orbital of the phenyl group to the vacant s atomic orbital of the transition metal (associated stabilizing energy, ΔE(2) = −1.2 and −1.1 kcal mol−1, for complexes 9 and 10, respectively).
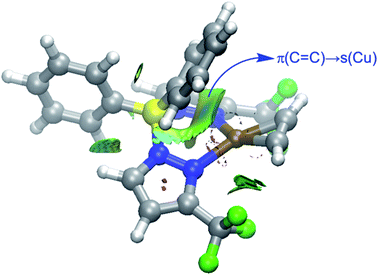 | ||
| Fig. 9 Contour plots of the reduced density gradient isosurfaces (density cutoff of 0.04 a.u.) for complex 9. The green surfaces indicate attractive noncovalent interactions. | ||
Summary and conclusions
In summary, we have presented the isolation and complete characterization of several new acetylene adducts of Cu(I) and Ag(I) supported by [Ph2B(3-(CF3)Pz)2]−, [HB(3,5-(CF3)2Pz)3]−, [HB(3-(CF3),5-(Ph)Pz)3]−, and bis(pyrazolyl)methane H2C(3,5-(CH3)2Pz)2, as well as details on their 1H, 13C, and 19F NMR spectroscopy, Raman spectroscopy, and X-ray crystallography. According to our DFT calculations, the bonding situation in these complexes can be described in terms of the traditional Dewar–Chatt–Duncanson model involving two donor–acceptor interactions, namely σ-donation from the acetylene ligand to the transition metal and π-backdonation from the transition metal fragment to the π*(C![[triple bond, length as m-dash]](https://www.rsc.org/images/entities/char_e002.gif) C) molecular orbital of acetylene (the latter being markedly stronger than the former). Interestingly, the copper complexes exhibit a downfield shift for acetylenic carbons in their 13C NMR spectra and a more notable reduction in
C) molecular orbital of acetylene (the latter being markedly stronger than the former). Interestingly, the copper complexes exhibit a downfield shift for acetylenic carbons in their 13C NMR spectra and a more notable reduction in ![[small nu, Greek, macron]](https://www.rsc.org/images/entities/i_char_e0ce.gif) C
C![[triple bond, length as m-dash]](https://www.rsc.org/images/entities/char_e002.gif) C relative to the free acetylene. This can be ascribed to a stronger interaction between the transition metal fragment and the acetylene ligand in the Cu(I)-complexes than that in their Ag(I)-counterparts as confirmed by our EDA-NOCV calculations (ΔEint ∼ 20 kcal mol−1). Furthermore, it is found that while the replacement of bidentate fluorinated bis(pyrazolyl)borate ligand by the analogous non-fluorinated bis(pyrazolyl)methane ligand on M(I) ions provokes an almost negligible effect on the LM-(C2H2) interaction, the related tridentate tris(pyrazolyl)borate supporting ligand weakens the LM-(C2H2) interaction, which is reflected into less significant NMR/Raman shifts. The C
C relative to the free acetylene. This can be ascribed to a stronger interaction between the transition metal fragment and the acetylene ligand in the Cu(I)-complexes than that in their Ag(I)-counterparts as confirmed by our EDA-NOCV calculations (ΔEint ∼ 20 kcal mol−1). Furthermore, it is found that while the replacement of bidentate fluorinated bis(pyrazolyl)borate ligand by the analogous non-fluorinated bis(pyrazolyl)methane ligand on M(I) ions provokes an almost negligible effect on the LM-(C2H2) interaction, the related tridentate tris(pyrazolyl)borate supporting ligand weakens the LM-(C2H2) interaction, which is reflected into less significant NMR/Raman shifts. The C![[triple bond, length as m-dash]](https://www.rsc.org/images/entities/char_e002.gif) C distance of these copper and silver acetylene complexes resulting from routine X-ray models suffers due to incomplete deconvolution of thermal smearing and anisotropy of the electron density in acetylene and is shorter than expected. Although it is possible to minimize this issue by collecting X-ray data at near absolute zero and to very high angles, it is not practical for routine work. However, the experimentally observed
C distance of these copper and silver acetylene complexes resulting from routine X-ray models suffers due to incomplete deconvolution of thermal smearing and anisotropy of the electron density in acetylene and is shorter than expected. Although it is possible to minimize this issue by collecting X-ray data at near absolute zero and to very high angles, it is not practical for routine work. However, the experimentally observed ![[small nu, Greek, macron]](https://www.rsc.org/images/entities/i_char_e0ce.gif) C
C![[triple bond, length as m-dash]](https://www.rsc.org/images/entities/char_e002.gif) C values can be utilized to provide C
C values can be utilized to provide C![[triple bond, length as m-dash]](https://www.rsc.org/images/entities/char_e002.gif) C bond distances of Cu(I) and Ag(I) complexes that are more realistic. Molecules presented herein represent the largest collection of isolable copper(I) and silver(I) complexes featuring the terminal, η2-HC
C bond distances of Cu(I) and Ag(I) complexes that are more realistic. Molecules presented herein represent the largest collection of isolable copper(I) and silver(I) complexes featuring the terminal, η2-HC![[triple bond, length as m-dash]](https://www.rsc.org/images/entities/char_e002.gif) CH ligand. We believe that the contents of the present work contribute significantly to the development of acetylene chemistry.
CH ligand. We believe that the contents of the present work contribute significantly to the development of acetylene chemistry.
Data availability
The details and data supporting this article have been uploaded as the ESI.† Crystallographic data can be obtained from the CCDC.Author contributions
Project administration and conceptualization: HVRD; Writing – original draft and funding: HVRD and IF; Synthesis and spectroscopic characterizations: AN-P and SGR; X-ray crystallography: HVRD; Computational work: IF; Data analysis, review and editing: all authors.Conflicts of interest
There are no conflicts to declare.Acknowledgements
This work was supported by the Robert A. Welch Foundation (Grant Y-1289 to H.V.R.D.) and the Spanish MCIN/AEI/10.13039/501100011033 (Grants PID2019-106184GB-I00 and RED2018-102387 T to I. F.). Partial support by Americal Floral Endowment (to H.V.R.D.) is also acknowledged.References
- (a) I.-T. Trotuş, T. Zimmermann and F. Schüth, Chem. Rev., 2014, 114, 1761–1782 CrossRef; (b) V. V. Voronin, M. S. Ledovskaya, A. S. Bogachenkov, K. S. Rodygin and V. P. Ananikov, Molecules, 2018, 23, 1–82 CrossRef CAS; (c) H. Schobert, Chem. Rev., 2014, 114, 1743–1760 CrossRef CAS PubMed.
- K. S. Rodygin, G. Werner, F. A. Kucherov and V. P. Ananikov, Chem. Asian J., 2016, 11, 965–976 CrossRef CAS PubMed.
- (a) R. Buschbeck, P. J. Low and H. Lang, Coord. Chem. Rev., 2011, 255, 241–272 CrossRef CAS; (b) J. F. Durand and M. Banos, Bull. Soc. Chim. Fr., 1927, 41, 1294–1299 CAS.
- P. Johnston, N. Carthey and G. J. Hutchings, J. Am. Chem. Soc., 2015, 137, 14548–14557 CrossRef CAS PubMed.
- (a) L. Zhang, M. Zhou, A. Wang and T. Zhang, Chem. Rev., 2020, 120, 683–733 CrossRef CAS; (b) G. X. Pei, X. Y. Liu, A. Wang, A. F. Lee, M. A. Isaacs, L. Li, X. Pan, X. Yang, X. Wang, Z. Tai, K. Wilson and T. Zhang, ACS Catal., 2015, 5, 3717–3725 CrossRef CAS; (c) M. R. Ball, K. R. Rivera-Dones, E. B. Gilcher, S. F. Ausman, C. W. Hullfish, E. A. Lebron and J. A. Dumesic, ACS Catal., 2020, 10, 8567–8581 CrossRef CAS; (d) X.-T. Li, L. Chen, C. Shang and Z.-P. Liu, J. Am. Chem. Soc., 2021, 143, 6281–6292 CrossRef CAS PubMed.
- (a) J. Bu, Z. Liu, W. Ma, L. Zhang, T. Wang, H. Zhang, Q. Zhang, X. Feng and J. Zhang, Nat. Catal., 2021, 4, 557–564 CrossRef CAS; (b) X. Shi, Y. Lin, L. Huang, Z. Sun, Y. Yang, X. Zhou, E. Vovk, X. Liu, X. Huang, M. Sun, S. Wei and J. Lu, ACS Catal., 2020, 10, 3495–3504 CrossRef CAS; (c) A. Sarkany and Z. Revay, Appl. Catal., A, 2003, 243, 347–355 CrossRef CAS; (d) L. Zhang, Z. Chen, Z. Liu, J. Bu, W. Ma, C. Yan, R. Bai, J. Lin, Q. Zhang, J. Liu, T. Wang and J. Zhang, Nat. Commun., 2021, 12, 6574 CrossRef CAS.
- T. G. Back and K. R. Muralidharan, J. Org. Chem., 1991, 56, 2781–2787 CrossRef CAS.
- H. Diaz Velazquez, Z.-X. Wu, M. Vandichel and F. Verpoort, Catal. Lett., 2017, 147, 463–471 CrossRef CAS.
- A. S. M. I. Uddin, D.-T. Phan and G.-S. Chung, Sens. Actuators, B, 2015, 207, 362–369 CrossRef.
- (a) D. Parasar, T. T. Ponduru, A. Noonikara-Poyil, N. B. Jayaratna and H. V. R. Dias, Dalton Trans., 2019, 48, 15782–15794 RSC; (b) T. Bruhm, A. Abram, J. Häusler, O. Thomys and K. Köhler, Chem. –Eur. J., 2021, 27, 16834–16839 CrossRef CAS PubMed.
- (a) L. Zhang, K. Jiang, L. Yang, L. Li, E. Hu, L. Yang, K. Shao, H. Xing, Y. Cui, Y. Yang, B. Li, B. Chen and G. Qian, Angew. Chem., Int. Ed., 2021, 60, 15995–16002 CrossRef CAS PubMed; (b) S. Chen, N. Behera, C. Yang, Q. Dong, B. Zheng, Y. Li, Q. Tang, Z. Wang, Y. Wang and J. Duan, Nano Res., 2021, 14, 546–553 CrossRef CAS.
- O. Daugulis, J. Roane and L. D. Tran, Acc. Chem. Res., 2015, 48, 1053–1064 CrossRef CAS PubMed.
- (a) T. C. Merkel, R. Blanc, I. Ciobanu, B. Firat, A. Suwarlim and J. Zeid, J. Membr. Sci., 2013, 447, 177–189 CrossRef CAS; (b) A. Roy, S. R. Venna, G. Rogers, L. Tang, T. C. Fitzgibbons, J. Liu, H. McCurry, D. J. Vickery, D. Flick and B. Fish, Proc. Natl. Acad. Sci., 2021, 118, e2022194118 CrossRef CAS PubMed; (c) D. J. Safarik and R. B. Eldridge, Ind. Eng. Chem. Res., 1998, 37, 2571–2581 CrossRef CAS.
- (a) P. Cazeneuve, Bulletin de la Societe Chimique de Paris, 1884, 106 Search PubMed; (b) O. Makowka, Ber. Dtsch. Chem. Ges., 1908, 41, 824–829 CrossRef CAS; (c) J. A. Mathews and L. L. Watters, J. Am. Chem. Soc., 1900, 22, 108–111 CrossRef.
- F. H. Allen, Acta Crystallogr., Sect. B: Struct. Sci., 2002, 58, 380–388 CrossRef.
- J. S. Thompson and J. F. Whitney, Inorg. Chem., 1984, 23, 2813–2819 CrossRef CAS.
- M. Munakata, S. Kitagawa, I. Kawada, M. Maekawa and H. Shimono, J. Chem. Soc., Dalton Trans., 1992, 2225–2230 RSC.
- A. Noonikara-Poyil, A. Munoz-Castro and H. V. R. Dias, Molecules, 2022, 27, 16 CrossRef CAS PubMed.
- H. V. R. Dias, Z. Wang and W. Jin, Inorg. Chem., 1997, 36, 6205–6215 CrossRef CAS.
- A. Reisinger, N. Trapp, I. Krossing, S. Altmannshofer, V. Herz, M. Presnitz and W. Scherer, Angew. Chem., Int. Ed., 2007, 46, 8295–8298 CrossRef CAS.
- (a) A. D. Brathwaite, T. B. Ward, J. H. Marks and M. A. Duncan, J. Phys. Chem. A, 2020, 124, 8562–8573 CrossRef CAS PubMed; (b) A. D. Brathwaite, T. B. Ward, R. S. Walters and M. A. Duncan, J. Phys. Chem. A, 2015, 119, 5658–5667 CrossRef CAS PubMed; (c) S. L. Stephens, D. M. Bittner, V. A. Mikhailov, W. Mizukami, D. P. Tew, N. R. Walker and A. C. Legon, Inorg. Chem., 2014, 53, 10722–10730 CrossRef CAS; (d) S. L. Stephens, W. Mizukami, D. P. Tew, N. R. Walker and A. C. Legon, J. Chem. Phys., 2012, 137, 174302/174301–174302/174313 CrossRef PubMed.
- (a) S. Trofimenko, Chem. Rev., 1993, 93, 943–980 CrossRef CAS; (b) C. Pettinari and C. Santini, Compr. Coord. Chem. II, 2004, 1, 159–210 CAS.
- (a) H. V. R. Dias and C. J. Lovely, Chem. Rev., 2008, 108, 3223–3238 CrossRef CAS; (b) H. V. R. Dias, S. A. Polach, S.-K. Goh, E. F. Archibong and D. S. Marynick, Inorg. Chem., 2000, 39, 3894–3901 CrossRef CAS PubMed; (c) H. V. R. Dias, H.-L. Lu, H.-J. Kim, S. A. Polach, T. K. H. H. Goh, R. G. Browning and C. J. Lovely, Organometallics, 2002, 21, 1466–1473 CrossRef CAS; (d) H. V. R. Dias and J. Wu, Angew. Chem., Int. Ed., 2007, 46, 7814–7816 CrossRef CAS; (e) A. Noonikara-Poyil, S. G. Ridlen and H. V. R. Dias, Inorg. Chem., 2020, 59, 17860–17865 CrossRef CAS PubMed; (f) A. Noonikara-Poyil, H. Cui, A. A. Yakovenko, P. W. Stephens, R.-B. Lin, B. Wang, B. Chen and H. V. R. Dias, Angew. Chem., Int. Ed., 2021, 60, 27184–27188 CrossRef CAS PubMed; (g) A. Noonikara-Poyil, A. Munoz-Castro, A. Boretskyi, P. K. Mykhailiuk and H. V. R. Dias, Chem. Sci., 2021, 12, 14618–14623 RSC; (h) M. Vanga, A. Munoz-Castro and H. V. R. Dias, Dalton Trans., 2022, 51, 1308–1312 RSC; (i) J. Mehara, B. T. Watson, A. Noonikara-Poyil, A. O. Zacharias, J. Roithova and H. V. R. Dias, Chem.–Eur. J., 2022 DOI:10.1002/chem.202103984.
- M. R. Hyman and D. J. Arp, Appl. Environ. Microbiol., 1987, 53, 298–303 CrossRef CAS PubMed.
- H. V. R. Dias and T. K. H. H. Goh, Polyhedron, 2004, 23, 273–282 CrossRef CAS.
- H. V. R. Dias, J. Wu, X. Wang and K. Rangan, Inorg. Chem., 2007, 46, 1960–1962 CrossRef CAS PubMed.
- N. L. Wieder, P. J. Carroll and D. H. Berry, Organometallics, 2011, 30, 2125–2136 CrossRef CAS.
- K. R. Pörschke, Y.-H. Tsay and C. Krüger, Angew. Chem., Int. Ed., 1985, 24, 323–324 CrossRef.
- H. Fast and H. L. Welsh, J. Mol. Spectrosc., 1972, 41, 203–221 CrossRef CAS.
- (a) J. Chatt and L. A. Duncanson, J. Chem. Soc., 1953, 2939–2947 RSC; (b) M. J. S. Dewar, Bull. Soc. Chim. Fr., 1951, C71–C79 CAS.
- (a) R. S. Nyholm, Proc. Chem. Soc., 1961, 273–296 Search PubMed; (b) C. Elschenbroich, Organometallics, 3rd, Completely Revised and Extended Edition, Wiley, Weinheim, 3rd edn., 2006 Search PubMed.
- S. Alvarez, Dalton Trans., 2013, 42, 8617–8636 RSC.
- A. Bondi, J. Phys. Chem., 1964, 68, 441–451 CrossRef CAS.
- (a) B. Cordero, V. Gómez, A. E. Platero-Prats, M. Revés, J. Echeverría, E. Cremades, F. Barragán and S. Alvarez, Dalton Trans., 2008, 2832–2838 RSC; (b) M. A. Omary, M. A. Rawashdeh-Omary, M. W. A. Gonser, O. Elbjeirami, T. Grimes, T. R. Cundari, H. V. K. Diyabalanage, C. S. P. Gamage and H. V. R. Dias, Inorg. Chem., 2005, 44, 8200–8210 CrossRef CAS PubMed.
- T. A. Albright, R. Hoffmann, J. C. Thibeault and D. L. Thorn, J. Am. Chem. Soc., 1979, 101, 3801–3812 CrossRef CAS.
- J. Liévin, J. Demaison, M. Herman, A. Fayt and C. Puzzarini, J. Chem. Phys., 2011, 134, 064119 CrossRef PubMed.
- R. K. McMullan, A. Kvick and P. Popelier, Acta Crystallogr., Sect. B, 1992, 48, 726–731 CrossRef.
- (a) N. C. Craig, P. Groner and D. C. McKean, J. Phys. Chem. A, 2006, 110, 7461–7469 CrossRef CAS PubMed; (b) G. J. H. van Nes and F. van Bolhuis, Acta Crystallogr., B, 1979, 35, 2580–2593 CrossRef CAS.
- S. G. Ridlen, J. Wu, N. V. Kulkarni and H. V. R. Dias, Eur. J. Inorg. Chem., 2016, 2573–2580 CrossRef CAS.
- Crystal Structure Refinement: A Crystallographer's Guide to SHELXL. IUCr Texts on Crystallography, ed., P. Muller, Oxford University Press, New York, 2006, ch. 8, pp. 150–158 Search PubMed.
- A. Reisinger, N. Trapp, C. Knapp, D. Himmel, F. Breher, H. Rüegger and I. Krossing, Chem. – Eur. J., 2009, 15, 9505–9520 CrossRef CAS PubMed.
- S. Kitou, Y. Hosogi, R. Kitaura, T. Naito, T. Nakamura and H. Sawa, Crystals, 2020, 10, 998 CrossRef CAS.
- V. Schomaker and K. N. Trueblood, Acta Crystallogr., 1968, 24, 63–76 CrossRef CAS.
- H. V. R. Dias and J. Wu, Eur. J. Inorg. Chem., 2008, 509–522 CrossRef CAS.
- E. R. Johnson, S. Keinan, P. Mori-Sánchez, J. Contreras-García, A. J. Cohen and W. Yang, J. Am. Chem. Soc., 2010, 132, 6498–6506 CrossRef CAS PubMed.
- E. D. Glendening, C. R. Landis and F. Weinhold, J. Comput. Chem., 2013, 34, 1429–1437 CrossRef CAS PubMed.
Footnote |
| † Electronic supplementary information (ESI) available. CCDC 2152321–2152325. For ESI and crystallographic data in CIF or other electronic format see https://doi.org/10.1039/d2sc02377f |
| This journal is © The Royal Society of Chemistry 2022 |

