
 Open Access Article
 This Open Access Article is licensed under a
 Creative Commons Attribution 3.0 Unported Licence
Jahn-Teller distortion and dissociation of CCl4+ by transient X-ray spectroscopy simultaneously at the carbon K- and chlorine L-edge†
Andrew D.
Ross‡
ab,
Diptarka
Hait‡
 ab,
Valeriu
Scutelnic
ab,
Eric A.
Haugen
ab,
Enrico
Ridente
a,
Mikias B.
Balkew
ca,
Daniel M.
Neumark
ab,
Martin
Head-Gordon
ab and
Stephen R.
Leone
*abd
ab,
Valeriu
Scutelnic
ab,
Eric A.
Haugen
ab,
Enrico
Ridente
a,
Mikias B.
Balkew
ca,
Daniel M.
Neumark
ab,
Martin
Head-Gordon
ab and
Stephen R.
Leone
*abd
aDepartment of Chemistry, University of California, Berkeley, 94720, CA, USA. E-mail: diptarka@stanford.edu
bChemical Sciences Division, Lawrence Berkeley National Laboratory, Berkeley, 94720, CA, USA
cSchool of Physics, Georgia Institute of Technology, Atlanta, 30332, GA, USA
dDepartment of Physics, University of California, Berkeley, 94720, CA, USA
First published on 19th July 2022
Abstract
X-ray Transient Absorption Spectroscopy (XTAS) and theoretical calculations are used to study CCl4+ prepared by 800 nm strong-field ionization. XTAS simultaneously probes atoms at the carbon K-edge (280–300 eV) and chlorine L-edge (195–220 eV). Comparison of experiment to X-ray spectra computed by orbital-optimized density functional theory (OO-DFT) indicates that after ionization, CCl4+ undergoes symmetry breaking driven by Jahn–Teller distortion away from the initial tetrahedral structure (Td) in 6 ± 2 fs. The resultant symmetry-broken covalently bonded form subsequently separates to a noncovalently bound complex between CCl3+ and Cl over 90 ± 10 fs, which is again predicted by theory. Finally, after more than 800 fs, L-edge signals for atomic Cl are observed, indicating dissociation to free CCl3+ and Cl. The results for Jahn–Teller distortion to the symmetry-broken form of CCl4+ and formation of the Cl–CCl+3 complex characterize previously unobserved new species along the route to dissociation.
1 Introduction
The Jahn–Teller (JT) theorem1 states that degenerate electronic states in non-linear molecules cannot be minima of energy vs. nuclear positions and will therefore undergo nuclear displacements that break the degeneracy. This is often observed in highly symmetric molecules with partial occupation of symmetry equivalent orbitals. A prototypical example of JT distortion is CH4+, which arises from ionization from the triply degenerate highest occupied molecular orbital (HOMO) of CH4. The resulting cation rapidly distorts away from the tetrahedral (Td) geometry of the neutral to a C2v symmetry structure2,3 with two long and two short CH bonds. Baker et al.4 have attempted to measure the time required for the JT process via comparison of high harmonic generation in CH4+ to CD4+, where they report a difference between the relaxation times of geometries of the two molecules up to 1.6 fs with sub-cycle resolution. However, information about longer times was limited by the wavelength of the laser. Recently, Gonçalves et al.5 calculated the JT timescale in CH4+ and found that distortion to C2v occurs as early as 7 fs, while the heavier CD4+ takes longer to relax to the same structure.Ionization of halogenated methanes is expected to lead to slower (and thus easier to measure) JT distortion, due to the larger substituent masses. However, JT distortion has not been observed for such systems, as the resulting cations are quite short-lived and therefore difficult to study.6 Indeed, it has been assumed that dissociation of the Td conformation of CCl4+ to CCl3+ and Cl occurs without any intermediates,7,8 as no stable ion is produced by direct photoionization.9 Theoretical work8,10 has suggested a stable structure of the form [Cl3C–Cl]+, with one Cl 3.5 Å away from the C and weakly coordinating to it. However, there are no experiments that validate the existence of these possible CCl4+ complexes.
The instability of CCl4+ necessitates the use of a technique that is sensitive to changes in nuclear and electronic structure occurring within the first few femtoseconds after formation. X-ray Transient Absorption Spectroscopy (XTAS) is such a method, as its time resolution is only limited by the duration of the pump and probe laser pulses and femtosecond resolution is readily achievable.14–16 Following strong-field ionization by the pump, the X-ray pulse induces transitions from core levels to unoccupied orbitals, which ensures that XTAS is sensitive to the local environment of individual atoms in the probed molecular system.15,17 It is therefore well suited for probing possible JT distorted transient intermediates that may arise during a dissociation. Indeed, XTAS has previously been used to infer JT distortion in the benzene cation18 and ring opening in cyclohexadiene.19 Pertot et al.20 also employed XTAS at the C K-edge to study the dissociation of CF4+, reporting rapid dissociation to CF3+ and F within ∼40 fs.
While several aforementioned studies focused on the C K-edge, HHG X-ray pulses span a relatively broad energy range14,21,22 and can be used to study multiple atomic edges simultaneously. In particular, the Cl L2,3-edge (2p levels, ∼195–220 eV) is a natural complement to the C K-edge (1s level, ∼280–300 eV) for studying chlorinated methanes. Signal from two elements potentially allows for the identification of species whose spectra might be unresolvable or involve forbidden transitions at any one particular edge. It also permits observation of any Cl dissociation both from the perspective of the departing atomic Cl species and the remaining C-containing molecular fragment.
In this paper, we present the results of a time-resolved experimental and theoretical investigation of strong-field ionized CCl4, by tabletop XTAS simultaneously at both the C K-edge and the Cl L2,3-edge. We report evidence for a dissociation pathway of CCl4+, illustrated in Fig. 1, that is initiated by an ultrafast (∼6 fs) JT distortion driven symmetry breaking, away from the parent tetrahedral (Td) geometry to an ensemble of symmetry-broken covalently bonded structures where all four Cl atoms remain covalently bonded to C. All these bonded forms can be viewed as vibrationally excited C2v CCl4+, as this geometry is predicted by theory to be the only stationary point on the cation potential energy surface with four C–Cl covalent bonds. Theory further indicates that the ions are only temporarily trapped in the bonded form, based on ab initio adiabatic quasiclassical trajectory (QCT) calculations and computed X-ray spectral features from orbital optimized density functional theory (OO-DFT23) that can be directly compared to experiment. The experiments corroborate the computed spectral features and identify the timescales for the initial symmetry breaking. Similarly, experiment and theory synergistically describe the evolution of the transient covalently bonded cation to a noncovalently bound complex between CCl3+ and Cl. The latter structure ultimately undergoes irreversible dissociation over relatively long timescales (∼800 fs). We also find evidence for a higher energy channel that results in CCl3 and atomic Cl+, which is expanded upon in the ESI.†
 | ||
| Fig. 1 The sequence of computationally characterized intermediates for the dissociation of CCl4+ identified in this experiment. Geometries were optimized with ωB97M-V11/aug-pcseg-3.12 Zero-point energies were computed at the same level of theory. Electronic energies at these geometries were subsequently found using CCSD(T)13 extrapolated to the complete basis set (CBS) limit. The structures of the closest local minima are used for the symmetry-broken covalently bonded form and non-covalently bonded complex; although, the experiment samples a large range of nuclear configurations, due to vibrational energy. The energy is set to 0 for the dissociated ion. Time constants shown are gathered from the ΔOD data in Fig. 2b and c and their lineouts (as described in the ESI†). We refer to the symmetry-broken covalently bonded form as SBCB and non-covalently bonded complex as NBC, in subsequent figures and tables. | ||
2. Methods
The tabletop experimental apparatus was previously described in ref. 14. We provide a brief summary that also touches on relevant upgrades. The pump pulse that induces strong-field ionization is centered at 800 nm, spectrally broadened, and compressed to about 6 fs in duration (as described in the ESI†). The maximum energy of the compressed pulse at the sample is 150 μJ at 1 kHz repetition rate. It is focused to 65 μm full width at half maximum (FWHM) to achieve an electric field with peak intensity up to 3 ± 1 × 10¹⁴ W cm−2, as estimated by numerical calculations and by observed relative ionization rates of Ar, as explained in the ESI.†The X-ray probe is generated by high harmonic generation (HHG), using a 10 fs pulse, centered at 1300 nm, focused into a semi-infinite gas cell filled with 2.3 bar He. This tabletop setup provides X-ray photons with energies up to 370 eV. The X-ray monochromator has 0.2 eV spectral resolution at the C K-edge and the experimental data are measured as a change in absorbance, or ΔOD, which is separated into spectral components by multivariate fitting, described in detail in the ESI.† The temporal cross-correlation of the experiment is measured to be 8 ± 2 fs by the autoionization in Ar L2,3 lines24 (as discussed in the ESI†). Experiments are performed over different time ranges to cover a wider range of dynamics; the shortest have a step size of 1 fs and extend to 80 fs, and the longest have variable step sizes and extend to 10 ps. Additionally, experiments are run with varying pump power, from ∼1−3 × 10¹⁴ W cm−2, to assess how the power affects the temporal dynamics and final states. These scans are taken as closely in time as possible to make the comparisons between scans more consistent. Timescales are extracted by fitting lineouts in time to unimolecular kinetics (as described in the ESI†). Each fit includes convolution with a Gaussian of 8 ± 2 fs FWHM to account for the cross-correlation of the experiment, using the 95% confidence intervals as error bars. CCl4 was obtained from Sigma-Aldrich at 99.5% purity and was vaporized by exposing the liquid to vacuum at room temperature. The CCl4 was probed in a finite gas cell with a 4 mm pathlength with a foreline pressure of 12 mbar.
Quantum chemical calculations were performed with the Q-Chem 5 software.25 Structures were optimized with the ωB97M-V11 density functional and the aug-pcseg-3 (ref. 12) basis set. Zero-point energies were found at the same level of theory. Relative ground state electronic energies at the optimized geometries were computed with CCSD(T)13 extrapolated to the complete basis set (CBS) limit, as detailed in the ESI.†Ab initio adiabatic trajectory calculations on CCl4+ were performed with ωB97M-V/aug-pcseg-1, starting from the equilibrium CCl4Td structure and with quasiclassical velocities26 for nuclei (this ensures each normal mode of the neutral species has the associated zero point energy). A total of 256 trajectories (out of the 512 possible ones for the CCl4 molecule with 9 normal modes) were run. The trajectory calculations did not incorporate an external electric field and thus can only provide a first estimate of timescales that can be compared to experiment.
X-ray absorption spectra were simulated with OO-DFT,23 utilizing the SCAN27 functional, aug-pcX-2 basis28 on the site of core-excitation, and aug-pcseg-2 basis12 on all other atoms. This approach has been shown to be accurate to ∼0.3 eV root-mean-squared error for the core-level spectra of electronic ground states of both closed-shell29 and open-shell30 species, without any need for empirical energy translation of the spectra. Ref. 29 and 30 provide detailed protocols for running OO-DFT calculations. Excited state orbital optimization was done with the square gradient minimization (SGM31) and initial maximum overlap method (IMOM32) algorithms, for restricted open-shell and unrestricted calculations, respectively.
3. Results and discussion
3.1 General features of experimental spectrum
The ground state static spectrum of CCl4 is presented in Fig. 2a. The Cl L2,3-edge comprises a number of peaks, several of which overlap, largely due to the C l2p spin–orbit splitting of 1.6 eV. The dominant features correspond to excitations to the and
and  symmetry adapted linear combinations (SALCs) of
  antibonding orbitals. Transitions from the L3 (2p3/2) level to
  and
and  occur at 200.4 eV and 203.2 eV respectively.33 The corresponding L2 (2p1/2) transitions occur at 202.0 eV and 204.8 eV. All of these excitations are dipole allowed. Transitions to Rydberg levels lead to additional peaks (such as the one at 205.5 eV (ref. 33)), and a rising ionization edge begins and persists around 207.5 eV. We note that the L3 ionization energy of CCl4 from X-ray photoelectron spectroscopy is 207 eV.34
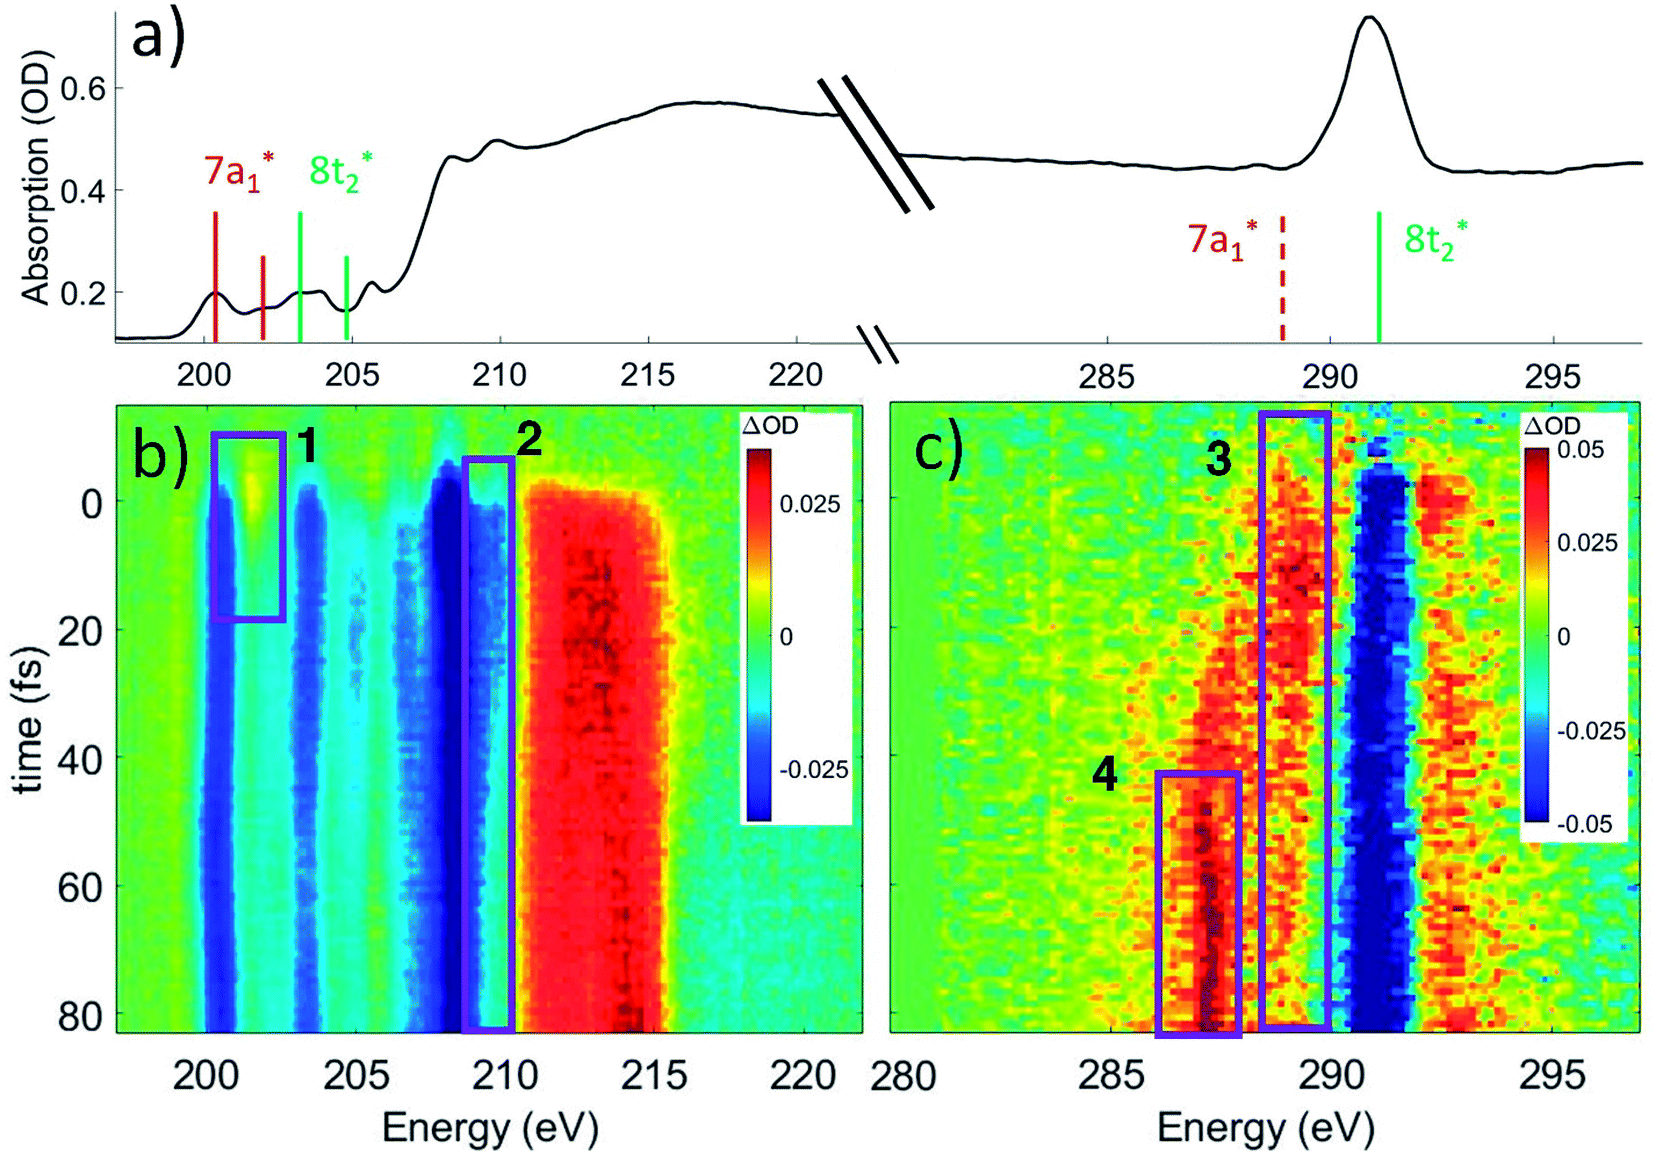 | ||
Fig. 2 (a) Static absorption spectrum of neutral CCl4 at the Cl L2,3- and C K-edges, dominated mostly by transitions to the singly degenerate  and triply degenerate and triply degenerate  levels. The levels. The  transition is dipole forbidden and absent in the static spectrum. (b and c) ΔOD data from the highest pump power (∼3 × 10¹⁴ W cm−2) for the Cl L2,3-edge (b) and C K-edge (c). Positive time corresponds to 800 nm pump first, while negative time is X-ray probe first. Negative ΔOD represents depletion of neutral CCl4, while positive ΔOD features indicate presence of new species that absorb stronger than the parent in that region. Prominent transient features are labeled 1 (201.7 eV), 2 (209.5 eV), 3 (289.2 eV) and 4 (287.1 eV). A discussion of the features and their assignments is presented in the text. Additional data sets are shown in the ESI.† transition is dipole forbidden and absent in the static spectrum. (b and c) ΔOD data from the highest pump power (∼3 × 10¹⁴ W cm−2) for the Cl L2,3-edge (b) and C K-edge (c). Positive time corresponds to 800 nm pump first, while negative time is X-ray probe first. Negative ΔOD represents depletion of neutral CCl4, while positive ΔOD features indicate presence of new species that absorb stronger than the parent in that region. Prominent transient features are labeled 1 (201.7 eV), 2 (209.5 eV), 3 (289.2 eV) and 4 (287.1 eV). A discussion of the features and their assignments is presented in the text. Additional data sets are shown in the ESI.† | ||
In contrast, the C K-edge spectrum of neutral CCl4 consists of a single intense peak at 290.9 eV,35 followed by a rising edge at ∼295 eV. The 290.9 eV peak arises from the  excitation, as the transition to the lower energy
  orbital is dipole forbidden.35 OO-DFT predicts the
  excitation to be at 290.8 eV, in excellent agreement with experiment, and the forbidden
  transition is predicted at 289.0 eV. The HHG process leads to lower photon flux at the higher C K-edge energy range than the Cl L-edge, contributing to less signal-to-noise in the former. There is also significant absorption from the tail of the chlorine edge in the experimental spectrum, which further reduces the signal-to-noise at the C K-edge.
Strong-field ionization by the pump pulse induces dynamics that leads to differences in absorption (ΔOD), as shown in Fig. 2b and c. The many spectral overlaps at the Cl edge (Fig. 2b) make it difficult to identify individual signals in the ΔOD data. Negative signal from ground state bleach is predominant from 200 to 210 eV with positive signal appearing in the 211–216 eV range, possibly due to a positive local charge on the chlorines leading to a net blue shift. The C edge is easier to resolve, with only a ground state bleach at 290.8 eV, and positive absorption at both higher (∼292 eV) and lower (287–290 eV) energies.
Within these broad experimental signals, several notable features can be observed. The first is a small positive feature at the Cl edge, labeled feature 1 in Fig. 2b. This feature appears transiently at early times and rapidly decays within a few femtoseconds. The second is at 209.5 eV, feature 2, which initially drops to a negative ΔOD but decays back towards zero values on the timescale of 100 fs. A similar timescale is observed in the decay of feature 3, at 289.2 eV, which suggests that the two decays measure the same process. Additionally, the positive signal of feature 3 initially rises on the same time scale as the decay observed in feature 1, suggesting that the early time behavior of features 1 and 3 reflect the same process. A fraction of feature 3 undergoes a continuous evolution (289.2 to 287.1 eV) to feature 4 at 287.1 eV after ∼20 fs. Feature 4 continues to grow after that time, concurrent with the decay of feature 3. Finally, at delays of several hundred femtoseconds to a few picoseconds, much longer times than those shown in Fig. 2, a series of sharp spectral features between 204 and 207 eV become resolvable from the broader features, shown more clearly in Fig. 6 and described in Section III.†
Based on the three timescales involved in the evolution of the noted features, few-femtoseconds, tens of femtoseconds, and several hundred femtoseconds, we conclude that three separate processes are responsible for the dynamics of the dissociation of CCl4+. In order to better understand the nature and quantitative times of these processes, these features are averaged and fitted along the time axis, and assignments are made by comparison to theory, as discussed below. In particular, we note that our probe would not be able to directly track a hole in the Cl lone pair levels of pure 3p character. The Cl 2p → 3p transition is dipole forbidden, and the C 1s → Cl 3p process involves local sites on distinct atoms with essentially no overlap. Changes in electronic and nuclear structure arising from such Cl 3p holes would however lead to other transient features, as discussed later. Transitions from Cl 2s levels (L1 edge) to a 3p hole are dipole allowed. However Cl L1 edge transition peaks are very broad and not very intense (as shown through an example in the ESI†). We therefore did not pursue analysis in that regime (∼270 eV).
3.2 General considerations for C K-edge
Any distortion away from Td geometries would alter the symmetry of the levels, which would no longer form the
  and
and  SALCs. The most general symmetry-broken case would be of C1 symmetry, with four unequal bond lengths. This leads to four nondegenerate σ* levels that permit dipole allowed transitions from the C 1s level, although intensities will be lower for the MOs with greater C 2s character. The shorter bonds would feature stronger C–Cl interactions, leading to higher energy σ* MOs, while the longer bonds would conversely lead to lower energy σ* levels. In particular, the lowest energy
  level is expected to be dominated by the longest C–Cl bond, and therefore the lowest energy C K-edge feature in the transient absorption spectrum should correspond to this bond. Conversely, the shortest bonds should lead to the highest energy absorption feature. More symmetric configurations can permit multiple bonds to make comparable contributions to any given σ* MO, preventing assignment of a transition to one particular bond. In general, however, the longest bonds should lead to the lower energy features in the C K-edge spectrum, while the higher energy features should arise from shorter bonds. However, there is no such simple rule of thumb available for the Cl L-edges, due to the complexity of the spectrum.
3.3 Jahn–Teller distortion of CCl4+
Lineouts of the few-femtosecond process are shown in Fig. 3a. These show the decay of feature 1 in 6 ± 2 fs and the rise of feature 3 in 7 ± 3 fs. These lifetimes, along with those extracted from the other fits, are compiled in Table 1 (with further details about the fits being provided in the ESI†). The ground state bleach at 200.4 eV from depletion of the neutral CCl4 represents the instrument response function (i.e., the temporal broadening introduced by the experiment). Comparison of features 1 and 2 to the ground state bleach in Fig. 3a show these lifetimes are significant beyond the experimental cross-correlation. | ||
| Fig. 3 (a) Averaged lineouts of features 1 and 3 in the first 35 fs. Fitting including the 8 ± 2 fs cross-correlation gives a lifetime of 6 ± 2 fs and 7 ± 3 fs for the decay and rise of features 1 and 3, respectively. (b) The longest C–Cl bond length for a set of 100 trajectory calculations, because that bond will correspond to the lowest energy absorption at the C K-edge. It shows that the bond elongates into the symmetry-broken covalently bonded form (labeled SBCB) rapidly, assisting the assignment that feature 1 corresponds to the Td. | ||
| Feature energy (eV) | Assigned transition | Time constant, τ (e−1/τ×t) (fs) |
|---|---|---|
| 1 (201.7 eV) | T d → SBCB | 6 ± 2 |
| 3 (289.2 eV) | T d → SBCB | 7 ± 3 |
| 2 (209.5 eV) | SBCB → NBC | 90 ± 10 |
| 3 (289.2 eV) | SBCB → NBC | 80 ± 30 |
| 4 (287.1 eV) | NBC appearance | τ: 50 ± 20 delay: 23 ± 8 |
| 204.2, 206.6 eV | Atomic Cl appearance | 800 ± 200 |
| 214.7 eV | Cl+ appearance | τ: 85 ± 10 delay: 37 ± 6 |
We assume the strong-field ionization process abruptly populates a CCl4+ cation state or states in a Franck–Condon-like manner, and those states then undergo geometry changes. The states may also have significant internal vibrational excitation. The lowest vertical ionization energy of CCl4 is 11.7 eV,36 corresponding to loss of an electron from the non-bonding t1 SALC of Cl 3p orbitals and forming the cation X state.9,36,37 The electron hole is thus essentially of pure Cl 3p character, and the C 1s → hole transition is consequently of negligible oscillator strength. Indeed, the computed C K-edge XAS of Td CCl4+ is quite similar to neutral CCl4, due to the extensive delocalization of the hole over all four Cl atoms. None of the features of the C K-edge experimental spectrum can therefore be unambiguously assigned to Td CCl4+. At the Cl L2,3-edges, the hole density should blue shift the absorption spectrum,38 and we make a tentative assignment of feature 1 to Td CCl4+.
From theory, the closest local minimum to the Td starting structure is a C2v symmetry distorted tetrahedron with two long (1.82 Å) and two short (1.70 Å) C–Cl bonds. The calculations indicate that a C2v form of CCl4+ is lower in energy by 0.4 eV, and there is no energy barrier between this minimum and the initial Td geometry. This energy stabilization is smaller than the 1.5 eV stabilization observed for the analogous CH4 structure.3 This result is unsurprising as the CCl4 ionization is from Cl lone-pairs while the CH4 electron loss is from bonding orbitals. The energy stabilization from JT distortion will be available to the vibrational modes of the ion, so many different nuclear configurations will be accessible around the C2v local minimum configuration. This range of configurations will be referred to as the symmetry-broken covalently bonded form of CCl4+ (or covalently bonded, for simplicity).
The OO-DFT C K-edge spectrum of the C2v stationary point was computed in order to determine if the covalently bonded forms were contributing to feature 3. At the C2v stationary point, all four σ* SALCs are nondegenerate and the C 1s transitions to these SALCs are all formally dipole allowed. The two lower energy SALCs correspond to the long C–Cl bonds, which is computed to lead to absorption at 289.8 eV, and the shorter bonds lead to higher energy σ* SALCs that are computed to absorb at ∼292 eV. A comparison of these energies in Fig. 4a with the absorption of feature 3, corrected for ground state bleach, shows that the energies match well. This validates the assignment that feature 3 arises from distorted CCl4+ with four covalent bonds.
 | ||
| Fig. 4 (a) The experimental features 3 and 4 as well as the neutral static are disambiguated and corrected for ground state bleach to obtain an absorption spectrum, using a method described in the ESI.† Notably, this shows that feature 3 ΔOD signal at 289.2 eV corresponds to an actual maximum at 289.8 eV. These spectra are compared to OO-DFT calculations for energies and oscillator strengths of the excitations (given by the peak position and heights, respectively). This allows for assignment of feature 3 to the symmetry-broken covalently bonded form (labled SBCB) and feature 4 to the noncovalent Cl–CCl3+ complex (labeled NBC) or CCl3+ moeity. (b) OO-DFT absorption spectra for various CCl4+ geometries. The third plot from the top shows absorption as a function of a single increasing bond distance (and other nuclear coordinates being optimized with this constraint). This shows splitting of absorption energies with the lower energies corresponding to the longest bond and higher energies to the shortest. The region of maximum bond extension without cleavage is roughly shown in the symmetry-broken covalently bonded region. These longer bonds account for the low energy tail in the covalently bonded experimental spectrum. | ||
In order to get an idea of the timescales of this distortion, Fig. 3b shows the longest C–Cl bond distance for a random subset of 100 calculated trajectories. The longest C–Cl bond is used here as a measure of distortion away from Td, for best comparison to the experimental X-ray absorption. It shows that at least one C–Cl bond rapidly elongates to the C2v value of 1.82 Å at ∼5 fs on average.
The ∼5 fs time from the trajectories is comparable to the 6 ± 2 fs decay of feature 1 and the 7 ± 3 fs rise of feature 3. Both time constants should measure the same process, the lifetime of the CCl4+Td geometry, with feature 1 more directly measuring the decay of the initial Td state and feature 3 measuring formation of the distorted state. They confirm the rapidity of the JT process and the barrierless energy surface between the two. We also note that on changing the pump intensity, the lifetimes exhibited no power dependence beyond what is necessary for ionization within the error bounds.
3.4 Covalent bond breakage of CCl4+
The evolution of some fraction of feature 3 to the much lower energy feature 4 in the experimental spectrum suggests further C–Cl bond stretching. OO-DFT calculations confirm this, with Fig. 4b showing the absorption of energy in CCl4+ as a function of the longest C–Cl bond distance (with all other nuclear coordinates being optimized). Fig. 4b further explains the lower energy tail of the experimental covalently bonded form spectrum in Fig. 4a, as the experiment will sample many molecules spanning a wide range of covalently bonded geometries.Feature 4 at 287.1 eV absorbs at the same energies as an extremely elongated C–Cl distance (∼3 Å) in Fig. 4a and b, suggesting that feature 4 corresponds to a CCl3+ moiety. Indeed, this feature corresponds to a transition to the unoccupied 2p orbital in CCl3+. This CCl3+ orbital originates from the lowest energy  level of the covalently bonded form, which has decreasing contribution from the dissociating Cl atom as the C–Cl distance increases. The observed spectrum is thus consistent with the theoretical prediction that the lowest energy forms of CCl4+ are noncovalently bound complexes between atomic Cl and CCl3+. The global energy minimum of CCl4+ is a complex with approximately C3v symmetry, a nearly planar CCl3+ moiety having a Cl atom vertically above the C, at a distance of 3.4 Å. A Cs symmetry minimum with the atomic Cl coordinating to a bonded Cl in the CCl3+ moiety is also found at 0.02 eV above the minimum energy complex, with a Cl–Cl distance of 3.24 Å. Given the only slight energy preference for the minimum energy position of the Cl in the complex and the available vibrational energy, it is likely that the Cl does not stay at this position under experimental conditions and instead samples a wide range of locations around CCl3+. However, the experiment is not directly sensitive to the position of the noncovalently bound Cl. The large distances between CCl3+ and Cl for all such species in fact indicate that C K-edge transitions to valence orbitals would be essentially unaffected by the particulars of the noncovalent interaction.
An energy decomposition analysis (EDA41) calculation reveals that the −0.15 eV interaction energy between atomic Cl and CCl3+ in the minimum energy complex geometry is mostly (56%) from the polarization of the atom by the cation, with a much smaller amount (19%) arising from charge-transfer (the remaining 25% being permanent electrostatics, Pauli repulsion and dispersion). The system effectively acts as a charge-induced dipole complex. It is also worth noting that these noncovalent complex structures do not have any covalent Cl–Cl interactions, contrary to some early assignments.42–44
The timescale of the symmetry-broken covalently bonded CCl4+ species to Cl–CCl3+ complex transition is shown through lineouts of features 2, 3, and 4 in Fig. 5a. This shows decay times of features 2 and 3 in 90 ± 10 fs and 80 ± 30 fs, respectively. Feature 4 appears only after a delay of 23 ± 8 fs, which implies that the nuclear motions take at least 23 fs to get to the point that the ion starts to resemble its dissociated form. After this delay, it has an additional lifetime of 50 ± 20 fs towards reaching its asymptotic value. Because of the delay from nuclear movement, the experimental time for the covalently bonded to noncovalent complex process is taken from the more precise feature 2, 90 ± 10 fs, and no pump power dependence is observed. This time is expected to be significantly longer than the JT distortion due to the computed barrier of 0.17 eV for this process. In varying the pump power, we do not observe a difference in the covalently bonded population decay times, possibly due to the large intensity already required to ionize the CCl4.
 | ||
| Fig. 5 (a) Averaged lineouts of features 2, 3, and 4 out to 350 fs. Fitting gives decay times of features 2 and 3 in 90 ± 10 fs and 80 ± 30 fs, respectively. Feature 4 appears only after a delay of 23 ± 8 fs, followed by a growth signal with a lifetime of 50 ± 20 fs. Acronyms: SBCB = symmetry-broken covalently bonded CCl4+, NBC = non-covalently bonded Cl–CCl3+ complex. (b) A set of 100 trajectory calculations, showing the longest C–Cl bond distance. It shows a population that temporarily remains in the covalently bonded form with longest bonds going between 1.8 and 2.05 Å. It also shows a portion of ions have sufficient velocity in the appropriate chlorine to break the C–Cl covalent bond immediately, while others require additional time to redistribute the energy such that the bond may be broken. The trajectories show more population remaining in the covalently bonded form for a longer time, but the difference is likely due to excess vibrational energy in the experiment or another particular of the strong-field ionization process, which are not included in the trajectories. See Section IX of ESI† for a discussion about the long time behavior of trajectories. | ||
The trajectory calculations in Fig. 5b show that a portion of the ions continue their initial distortion and dissociate immediately, which is observed experimentally by the direct evolution of the feature 3 → feature 4 signal. Indeed, this regime of the experimental signal reports direct dynamics from the covalently bonded form to the complex for a fraction of the molecules. Another portion remains trapped in the covalently bonded form for longer than a vibrational period, showing longest C–Cl distances between 1.8 and 2.05 Å, which serves to define the symmetry-broken covalently bonded region. We however note that the trajectory calculations show a significant population persisting in the covalently bonded form for a longer time than the experimentally measured lifetime. This likely arises from the trajectory calculations not including the excess vibrational energy added by the pump pulse. The calculations only include the zero-point energy of neutral CCl4, leading to the covalently bonded form persisting longer than what is experimentally observed. A further discussion about the long time behavior of the trajectories is given in Section IX of the ESI.†
3.5 Atomic Cl dissociation
Although the C K-edge cannot distinguish between noncovalent complex and free Cl, the Cl L2,3 edge can make this distinction, as atomically sharp Rydberg lines corresponding to atomic Cl become evident upon completion of the dissociation, which is shown in Fig. 6a and b. Very little change is observed in the ΔOD spectra between 250 fs and 3.5 ps at either the C K-edge or chlorine L2,3-edge, other than the appearance of these sharp lines, which is consistent with the previous assignment of the noncovalent complex. While weakly bound in the complex, the atomic lines are broadened by a combination of two factors. Firstly, the transitions are already of low intensity due to their Rydberg character, the lowest energy lines being of 2p → 4s character. Secondly, the diffuse nature of the Rydberg levels means that the excitation energy would be sensitive to the precise position of the CCl3+ entity, and the flatness of the complex ground state potential energy surface permits a large range of accessible nuclear configurations. However, over time, the complex irreversibly dissociates, leading to atomic Cl lines at 204.2 eV and upward from 206 eV, which agrees with previous experimental absorption data.39 Thus, we can use the Cl atomic lines to track the time it takes for the complex species to completely dissociate to CCl3+ and Cl. We note that molecular Cl2 has absorption in this energy range as well;40 however, comparison to experimental atomic absorbance in Fig. 6b shows much better agreement with atomic Cl. | ||
| Fig. 6 (a) Lineouts in energy for 220 fs and 2.5 ps at the Cl L2,3-edges. They show that although the overall shape and intensity of the ΔOD signal remains constant, sharp spectral features appear at longer delays. The difference between 3.5 ps and 220 fs is taken and added to an error function to obtain the spectrum in b. (b) A comparison of the sharp spectral features is made to atomic Cl39 and to molecular Cl2,40 which shows that the features match well with atomic Cl. (c) A high-pass spectral filter is applied to the ΔOD data and an average of the two most prominent lines at 204.2 and 206.6 eV is shown as a lineout against time. A fit is taken starting from t = 0, due to noise preventing a better determination of a start point. This fit with ∼3 × 10¹⁴ W cm−2 pump intensity has a lifetime of 800 ± 200 fs. | ||
A high-pass filter is applied to the transient spectrum to separate the sharp atomic Cl lines from broader molecular signals. A simple exponential fit of these lines in Fig. 6c gives a lifetime longer than 800 fs. The exponential starts at time zero, despite the Cl signal not clearly departing from 0 until ∼300 fs. This may correspond to the minimum time required for atomic Cl to move far enough to show the Rydberg lines, although the signal-to-noise of this experiment is not sufficient to make that distinction.
The 800 fs time scale is much longer than the 90 fs observed for noncovalent complex formation, despite the excess of energy available to the system. However, the interactions and thus rate of energy transfer between the CCl3+ moeity and the neutral Cl are much weaker than a covalent bond. This situation is similar to van der Waals complexes, which sometimes show lifetimes exceeding milliseconds with vibrational energy in the molecular moeity.45,46 The 800 fs value is the fastest Cl formation time and was measured from the most intense pump pulse of 3 × 10¹⁴ W cm−2. Datasets collected at lower pump power show slower dissociation times, and some do not exhibit significant atomic Cl formation up to 3 ps. The noncovalent complex signal from feature 4 at 287.1 eV is still present, suggesting that the strong-field ionization may be capable of forming long-lived noncovalently bound CCl4+ complexes; although times longer than a few ps are outside the scope of this paper. It has been observed that otherwise unstable parent ions can be generated by few-cycle strong field ionizing laser pulses, such as tetramethyl silane and CS2,47,48 and an analogous complex may be a potential explanation of these signals. A quantitative comparison of the power dependence on this timescale was not carried out. We also note that the lifetime of a molecular species against collision with an electron (released by strong-field ionization) is on the order of ∼5 ps with our setup (as discussed in the ESI†), which is an additional factor to consider, but only at very long times.
4 The high intensity case and the formation of Cl+
While the observed dissociation to CCl3+ and Cl can be well explained by the intermediate forms and pathways discussed above, another channel appears to be present in the data. This channel is clearest at the chlorine L2,3-edge where very sharp lines with similar widths to the atomic Cl lines are observed at 214 eV with less obvious components at 212.6 eV, shown in the ESI.† These energies are in the range that the calculations predict for the Rydberg states (2p → 3d, 4s) of Cl+. These atomically sharp peaks begin to appear with a delay of 37 ± 6 fs relative to the onset of the main cationic CCl4 signal, and from that point, they show a time to grow in of 85 ± 10 fs for the best signal-to-noise dataset.Low energy satellite features in the C 1s spectrum ∼285.5 eV are also observed, which can correspond to transitions to the singly occupied level of the CCl3 radical, computed to be at 285.5 eV. These simultaneous features appear to suggest the existence of a channel that results in CCl3 and Cl+. The formation of Cl+ is a much higher energy channel, with final energies about 4.8 eV higher than the normal dissociation channel. Cl+ formation has been observed in previous CCl4 ionization experiments in low quantities from electron impact,49 single-photon ionization9,50 and in higher quantities from strong-field ionization.51 Further discussion about Cl+ formation is provided in the ESI.†
5 Conclusions
In this paper, we have shown experimental and theoretical evidence for both a transient Jahn–Teller distorted symmetry-broken covalently bonded CCl4+, similar to the stable ion of CH4+, and a noncovalently bound complex between CCl3+ and Cl. Neither of these intermediates have been observed previously in experiments. A summary of each of the time constants experimentally extracted is shown in Table 1. The transition from the initial tetrahedral ion to the C2v state occurs in 6 ± 2 fs, showing that the Jahn–Teller distortion is very fast, on the order of the duration of the pump laser pulse. It provides an order of magnitude estimate for other symmetric molecules undergoing JT distortion, which can aid chemical simulations as well as help predict the vibrational energies and nuclear dynamics of those other systems, especially given that this symmetry-broken covalently bonded intermediate was not assumed to exist prior to this work.7,8The noncovalent Cl–CCl3+ complex is bound largely by the polarization of the neutral species, forming an ion-induced dipole complex with a lifetime much longer than the covalent bond cleavage time. The final dissociation time for free Cl or Cl+ seems to be slightly dependent on the strong-field power, but for the highest power used in this experiment, the lifetime is more than 800 fs (vs. 90 fs for noncovalent complex formation). This observed long lifetime is a potential explanation for otherwise unstable parent ions appearing in mass-spectra of ultra-short strong-field ionization.
Data availability
Data are available upon request to the authors.Author contributions
A. D. R. and D. H. contributed equally to this work. A. D. R., V. S., E. A. H., E. R., and M. B. B. performed experiments. A. D. R. analyzed experimental data. D. H. performed calculations. S. R. L., M. H. G., and D. M. N. supervised the project. A. D. R. and D. H. wrote the manuscript, with inputs from all the authors. All authors reviewed the manuscript.Conflicts of interest
The authors declare the following competing interest: M. H.-G. is a part-owner of Q-Chem, which is the software platform in which the quantum chemical calculations were carried out.Acknowledgements
This work is funded by the DOE Office of Science, Basic Energy Science (BES) Program, Chemical Sciences, Geosciences and Biosciences Division under Contract no. DE-AC02-05CH11231, through the Gas Phase Chemical Physics program (A. D. R., V. S., E. A. H., E. R., D. M. N., and S. R. L.) and Atomic, Molecular, and Optical Sciences program (D. H. and M. H. G.). The instrument was built with funds from the National Science Foundation through NSF MRI 1624322 and matching funds from the Lawrence Berkeley National Laboratory, the College of Chemistry, the Department of Physics, and the Vice Chancellor for Research at UC Berkeley. A. D. R. is additionally funded by the U.S. Department of Energy, Office of Science, Office of Basic Energy Sciences, Materials Sciences and Engineering Division, under Contract No. DE-AC02-05-CH11231 within the Physical Chemistry of Inorganic Nanostructures Program (KC3103), by the W. M. Keck Foundation Grant No. 042982, and by the U.S. Army Research Office (ARO) under Grant No. W911NF-20-1-0127. M. B. B. was funded through NSF (REU Site: Engineering Applications of Extreme Ultra-Violet (EUV) Laser Light) Award No. 1852537.References
- H. A. Jahn and E. Teller, Stability of polyatomic molecules in degenerate electronic states-i: Orbital degeneracy, Proc. R. Soc. A: Math. Phys. Eng. Sci., 1937, 161, 220–235 CAS.
- L. B. Knight, J. Steadman, D. Feller and E. R. Davidson, Experimental evidence for a c2v (2b1) ground-state structure of the methane cation radical: Esr and ab initio ci investigations of methane cation radicals (CH4+ and CD2H2+) in neon matrixes at 4 k, J. Am. Chem. Soc., 1984, 106, 3700–3701, DOI:10.1021/ja00324a066.
- R. J. Boyd, K. V. Darvesh and P. D. Fricker, Energy component analysis of the jahn–teller effect in the methane radical cation, J. Chem. Phys., 1991, 94, 8083–8088 CrossRef CAS.
- S. Baker, J. S. Robinson, C. Haworth, H. Teng, R. Smith, C. C. Chirilă, M. Lein, J. Tisch and J. P. Marangos, Probing proton dynamics in molecules on an attosecond time scale, Science, 2006, 312, 424–427 CrossRef CAS PubMed.
- C. E. M. Gonçalves, R. D. Levine and F. Remacle, Ultrafast geometrical reorganization of a methane cation upon sudden ionization: an isotope effect on electronic non-equilibrium quantum dynamics, Phys. Chem. Chem. Phys., 2021, 23, 12051–12059 RSC.
- J. H. Beynon, Mass spectrometry and its applications to organic chemistry, Elsevier Pub. Co., Amsterdam, New York, 1960 Search PubMed.
- H. Tachikawa, Dynamics of electron attachment and ionization processes in the CCl4 molecule: An ab initio mo and direct dynamics study, J. Phys. Chem. A, 1997, 101, 7454–7459 CrossRef CAS.
- J. Harvey, R. P. Tuckett and A. Bodi, Shining new light on the multifaceted dissociative photoionisation dynamics of CCl4, Phys. Chem. Chem. Phys., 2014, 16, 20492–20499 RSC.
- T. Kinugawa, Y. Hikosaka, A. M. Hodgekins and J. H. D. Eland, New results on the dissociative photoionization of CF4 and CCl4, J. Mass Spectrom., 2002, 37, 854–857 CrossRef CAS PubMed.
- J. M. G. de la Vega, B. Miguel and E. San Fabian, Density functional calculations on jahn-teller effect of tetrachloromethane cation, Int. J. Quantum Chem., 1997, 61, 533–540 CrossRef.
- N. Mardirossian and M. Head-Gordon, ω B97M-V: a combinatorially optimized, range-separated hybrid, meta-GGA density functional with VV10 nonlocal correlation, J. Chem. Phys., 2016, 144, 214110 CrossRef PubMed.
- F. Jensen, Unifying general and segmented contracted basis sets. Segmented polarization consistent basis sets, J. Chem. Theory Comput., 2014, 10, 1074–1085 CrossRef CAS PubMed.
- K. Raghavachari, G. W. Trucks, J. A. Pople and M. Head-Gordon, A fifth-order perturbation comparison of electron correlation theories, Chem. Phys. Lett., 1989, 157, 479–483 CrossRef CAS.
- L. Barreau, A. D. Ross, S. Garg, P. M. Kraus, D. M. Neumark and S. R. Leone, Efficient table-top dual-wavelength beamline for ultrafast transient absorption spectroscopy in the soft x-ray region, Sci. Rep., 2020, 10, 5773 CrossRef CAS PubMed.
- Z. Chang and P. Corkum, Attosecond photon sources: the first decade and beyond, J. Opt. Soc. Am. B, 2010, 27, B9–B17 CrossRef CAS.
- J. Li, X. Ren, Y. Yin, K. Zhao, A. Chew, Y. Cheng, E. Cunningham, Y. Wang, S. Hu and Y. Wu, et al., 53-attosecond x-ray pulses reach the carbon k-edge, Nat. Commun., 2017, 8, 1–5 CrossRef.
- R. Geneaux, H. J. B. Marroux, A. Guggenmos, D. M. Neumark and S. R. Leone, Transient absorption spectroscopy using high harmonic generation: a review of ultrafast x-ray dynamics in molecules and solids, Philos. Trans. R. Soc., A, 2019, 377, 20170463 CrossRef CAS PubMed.
- M. Epshtein, V. Scutelnic, Z. Yang, T. Xue, M. L. Vidal, A. I. Krylov, S. Coriani and S. R. Leone, Table-top x-ray spectroscopy of benzene radical cation, J. Phys. Chem. A, 2020, 124, 9524–9531 CrossRef CAS PubMed.
- A. R. Attar, A. Bhattacherjee, C. D. Pemmaraju, K. Schnorr, K. D. Closser, D. Prendergast and S. R. Leone, Femtosecond x-ray spectroscopy of an electrocyclic ring-opening reaction, Science, 2017, 356, 54–59 CrossRef CAS PubMed.
- Y. Pertot, C. Schmidt, M. Matthews, A. Chauvet, M. Huppert, V. Svoboda, A. von Conta, A. Tehlar, D. Baykusheva, J.-P. Wolf and H. J. Wörner, Time-resolved x-ray absorption spectroscopy with a water window high-harmonic source, Science, 2017, 355, 264–267 CrossRef CAS PubMed.
- S. M. Teichmann, F. Silva, S. Cousin, M. Hemmer and J. Biegert, 0.5-kev soft x-ray attosecond continua, Nat. Commun., 2016, 7, 1–6 Search PubMed.
- A. S. Johnson, D. R. Austin, D. A. Wood, C. Brahms, A. Gregory, K. B. Holzner, S. Jarosch, E. W. Larsen, S. Parker and C. S. Strüber, et al., High-flux soft x-ray harmonic generation from ionization-shaped few-cycle laser pulses, Sci. Adv., 2018, 4, eaar3761 CrossRef PubMed.
- D. Hait and M. Head-Gordon, Orbital optimized density functional theory for electronic excited states, J. Phys. Chem. Lett., 2021, 12, 4517–4529 CrossRef CAS PubMed.
- A. P. Fidler, S. J. Camp, E. R. Warrick, E. Bloch, H. J. B. Marroux, D. M. Neumark, K. J. Schafer, M. B. Gaarde and S. R. Leone, Nonlinear xuv signal generation probed by transient grating spectroscopy with attosecond pulses, Nat. Commun., 2019, 10, 1384 CrossRef PubMed.
- E. Epifanovsky, et al., Software for the frontiers of quantum chemistry: An overview of developments in the q-chem 5 package, J. Chem. Phys., 2021, 155, 084801 CrossRef CAS PubMed.
- M. Karplus, R. N. Porter and R. D. Sharma, Exchange reactions with activation energy. i. simple barrier potential for (h, h2), J. Chem. Phys., 1965, 43, 3259–3287 CrossRef CAS.
- J. Sun, A. Ruzsinszky and J. P. Perdew, Strongly Constrained and Appropriately Normed Semilocal Density Functional, Phys. Rev. Lett., 2015, 115, 036402 CrossRef PubMed.
- M. A. Ambroise and F. Jensen, Probing basis set requirements for calculating core ionization and core excitation spectroscopy by the δ self-consistent-field approach, J. Chem. Theory Comput., 2018, 15, 325–337 CrossRef PubMed.
- D. Hait and M. Head-Gordon, Highly accurate prediction of core spectra of molecules at density functional theory cost: Attaining sub-electronvolt error from a restricted open-shell kohn–sham approach, J. Phys. Chem. Lett., 2020, 11, 775–786 CrossRef CAS PubMed.
- D. Hait, E. A. Haugen, Z. Yang, K. J. Oosterbaan, S. R. Leone and M. Head-Gordon, Accurate prediction of core-level spectra of radicals at density functional theory cost via square gradient minimization and recoupling of mixed configurations, J. Chem. Phys., 2020, 153, 134108 CrossRef CAS PubMed.
- D. Hait and M. Head-Gordon, Excited state orbital optimization via minimizing the square of the gradient: General approach and application to singly and doubly excited states via density functional theory, J. Chem. Theory Comput., 2020, 16, 1699–1710 CrossRef CAS PubMed.
- G. M. Barca, A. T. Gilbert and P. M. W. Gill, Simple models for difficult electronic excitations, J. Chem. Theory Comput., 2018, 14, 1501–1509 CrossRef CAS PubMed.
- K. Lu, J. Chen, J. Lee, S. Haw, T. Chou, S. Chen and T. Chen, Core-level anionic photofragmentation of gaseous ccl 4 and solid-state analogs, Phys. Rev. A, 2009, 80, 033406 CrossRef.
- W. Jolly, K. Bomben and C. Eyermann, Core-electron binding energies for gaseous atoms and molecules, At. Data Nucl. Data Tables, 1984, 31, 433–493 CrossRef CAS.
- A. Hitchcock and C. Brion, Inner-shell excitation and exafs-type phenomena in the chloromethanes, J. Electron Spectrosc. Relat. Phenom., 1978, 14, 417–441 CrossRef CAS.
- A. Potts, H. Lempka, D. Streets and W. Price, Photoelectron spectra of the halides of elements in groups iii, iv, v and vi, Philos. Trans. R. Soc., A, 1970, 59–76 CAS.
- R. Dixon, J. Murrell and B. Narayan, The photoelectron spectra of the halomethanes, Mol. Phys., 1971, 20, 611–623 CrossRef.
- J. Vura-Weis, C.-M. Jiang, C. Liu, H. Gao, J. M. Lucas, F. M. F. de Groot, P. Yang, A. P. Alivisatos and S. R. Leone, Femtosecond m2,3-edge spectroscopy of transition-metal oxides: Photoinduced oxidation state change in α-Fe2O3, J. Phys. Chem. Lett., 2013, 4, 3667–3671, DOI:10.1021/jz401997d.
- C. D. Caldwell, M. O. Krause, R. D. Cowan, A. Menzel, S. B. Whitfield, S. Hallman, S. P. Frigo and M. C. Severson, Inner-shell photoexcitation in an open-shell atom: The Cl 2p→ns,md spectrum as a case study, Phys. Rev. A, 1999, 59, R926–R929 CrossRef CAS.
- O. Nayandin, E. Kukk, A. A. Wills, B. Langer, J. D. Bozek, S. Canton-Rogan, M. Wiedenhoeft, D. Cubaynes and N. Berrah, Angle-resolved two-dimensional mapping of electron emission from the inner-shell 2p excitations in Cl2, Phys. Rev. A, 2001, 63, 062719 CrossRef.
- Y. Mao, M. Loipersberger, P. R. Horn, A. Das, O. Demerdash, D. S. Levine, S. Prasad Veccham, T. Head-Gordon and M. Head-Gordon, From intermolecular interaction energies and observable shifts to component contributions and back again: A tale of variational energy decomposition analysis, Annu. Rev. Phys. Chem., 2021, 72, 641–666 CrossRef CAS PubMed.
- T. Drewello, T. Weiske and H. Schwarz, Cl2c-cl-cl+, Cl2c-cl-Br+, and Br2c-b-c+ by gas-phase decarbonylation of Cx3Coy+, Angew. Chem., Int. Ed. Engl., 1985, 24, 869–870 CrossRef.
- Y. J. Kime, D. C. Driscoll and P. A. Dowben, The stability of the carbon tetrahalide ions, J. Chem. Soc., Faraday Trans., 1987, 2 83, 403–410 RSC.
- H. Muto, K. Nunome and M. Iwasaki, An electron spin resonance study of the structure of CCl4+ radical cation in carbon tetrachloride irradiated at low temperatures by powder and single crystal analyses, J. Chem. Phys., 1989, 90, 6827–6832, DOI:10.1063/1.456255.
- D. J. Nesbitt, Toward state-to-state dynamics in ultracold collisions: Lessons from high-resolution spectroscopy of weakly bound molecular complexes, Chem. Rev., 2012, 112, 5062–5072 CrossRef CAS PubMed.
- R. Hernández-Lamoneda, C. Sanz-Sanz, O. Roncero, J. M. Pio, M. A. Taylor and K. C. Janda, A theoretical study on electronic predissociation in the nebr2 van der waals molecule, Chem. Phys., 2012, 399, 86–93 CrossRef.
- K. Dota, M. Garg, A. Tiwari, J. Dharmadhikari, A. Dharmadhikari and D. Mathur, Intense two-cycle laser pulses induce time-dependent bond hardening in a polyatomic molecule, Phys. Rev. Lett., 2012, 108, 073602 CrossRef CAS PubMed.
- D. Mathur, K. Dota, A. Dharmadhikari and J. Dharmadhikari, Carrier-envelope-phase effects in ultrafast strong-field ionization dynamics of multielectron systems: Xe and cs 2, Phys. Rev. Lett., 2013, 110, 083602 CrossRef CAS PubMed.
- B. G. Lindsay, K. F. McDonald, W. S. Yu, R. F. Stebbings and F. B. Yousif, Electron-impact ionization of CCl4 and CCl2F2, J. Chem. Phys., 2004, 121, 1350–1356, DOI:10.1063/1.1761055.
- G. Burton, W. Chan, G. Cooper and C. Brion, Valence-shell and inner-shell (cl 2p, 2s, c 1s) photoabsorption and photoionization of carbon-tetrachloride - absolute oscillator-strengths (5-400 ev) and dipole-induced breakdown pathways, Chem. Phys., 1994, 181, 147–172 CrossRef CAS.
- D. P. M. Geissler, Concerted elimination of Cl2+ from CCl4 and of I2+ from CH2I2 driven by intense ultrafast laser pulses, PhD thesis, The Graduate School, Stony Brook University, Stony Brook, NY, 2007.
Footnotes |
| † Electronic supplementary information (ESI): PDF: more details about experimental protocols, fits, computational details, computed spectral features, discussion about Cl+ formation, changes with varying pump intensity. ZIP: computed geometries of species. XLXS: relative energies of species. See https://doi.org/10.1039/d2sc02402k |
| ‡ These authors contributed equally to this work. |
| This journal is © The Royal Society of Chemistry 2022 |