 Open Access Article
Fingerprint-based deep neural networks can model thermodynamic and optical properties of eumelanin DHI dimers†
Daniel
Bosch
 a,
Jun
Wang
 b and
Lluís
Blancafort
 *a
*a
aDepartament de Química, Institut de Química Computacional i Catàlisi, Universitat de Girona. Facultat de Ciències, C/M. A. Capmany 69, 17003 Girona, Spain. E-mail: lluis.blancafort@udg.edu
bJiangsu Key Laboratory for Chemistry of Low-Dimensional Materials, Jiangsu Engineering Laboratory for Environment Functional Materials, Huaiyin Normal University, No. 111 West Changjiang Road, Huaian 223300, Jiangsu, P. R. China
First published on 4th July 2022
Abstract
Eumelanin is the biopolymer responsible for photoprotection in living beings and holds great promise as a smart biomaterial, but its detailed structure has not been characterized experimentally. Theoretical models are urgently needed to improve our knowledge of eumelanin's function and exploit its properties, but the enormous amount of possible oligomer components has made modelling not possible until now. Here we show that the stability and lowest vertical optical absorption of 5,6-dihydroxyindole (DHI) eumelanin dimer components can be modeled with deep neural networks, using fingerprint-like molecular representations as input. In spite of the modest data set size, average errors of only 6 and 9% for stability and S1 absorption energy are obtained. Our fingerprints code the connectivity and oxidation patterns of the dimers in a straightforward, unambiguous way and can be extended to larger oligomers. This proof-of-principle work shows that machine learning can be applied to help solve the structural challenge of melanin.
Introduction
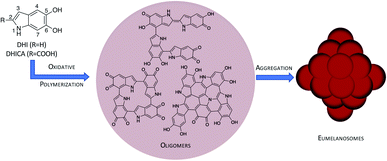
Melanin is the organic biopigment that protects animals from damage by light, thanks to a broad absorption spectrum and the ability to dispose of excitation energy in an ultrafast, harmless way.1,2 Eumelanin, the main melanin representative, also has interesting redox characteristics: it has a persistent EPR signal that indicates a partial radical character, and it can be reversibly reduced and oxidized. This suggests that it may be used as an organoelectronic component. Thanks to this versatility, eumelanin and its synthetic polydopamine (PDA) analogue have attracted increased interest in materials science.3–6 It has been proposed that these materials can be applied as organic supercapacitors,7 electronic transport materials8,9 or additives in solar-thermal conversion devices10 or Li-ion batteries.11In spite of these promising aspects, eumelanin's potential as a smart biomaterial has not been realized yet, mostly because its atomic-level structure is unknown.1 Eumelanin is formed by oligomers of 5,6-dihydroxyindole (DHI) and DHI-2-carboxylic acid (DHICA) that undergo oxidative polymerization to yield linear, macrocyclic or polycyclic oligomers (see Fig. 1). However, the exact oligomer composition and the way the oligomers assemble into eumelanosomes are not known due to the heterogeneous, chemically intractable nature of the biopolymer, which prevents further characterization. It is thought that the heterogeneous nature of the oligomers contributes to the broad absorption spectrum,2 and the redox ability and the ensuing conductive properties are probably related to the presence of readily interconvertible quinone and catechol groups,8,12 but the structural basis of the different functions has not been determined precisely yet. The structural knowledge gap is therefore one of the main obstacles to realizing melanin's potential.
 | ||
| Fig. 1 Hierarchical model of the eumelanin structure: DHI/DHICA monomers and oligomers obtained by oxidative polymerization (only DHI oligomers shown) and further assembly to eumelanosomes. | ||
Theoretical models can help to address the urgent challenge of improving melanin's structural characterization, but generating them is a difficult task because there are hundreds of thousands if not millions of possible oligomers due to the manifold of possible connectivity and oxidation patterns, which leads to combinatorial explosion.13,14 Therefore it has been speculated that machine learning techniques can be applied to advance towards the elucidation of melanin's structure.3 Here we show that it is in fact possible to apply deep neural networks (NNs) to model the main properties of eumelanin DHI dimers: their thermodynamic stability, which is important in order to understand which fragments may be present in the biopolymer, and the lowest vertical electronic absorption, which is related to the broad absorption spectrum and the photoprotecting ability. The key to this application is the use of fingerprint-like representations15,16 that allow to codify the structure of melanin oligomers in a straightforward way. Our work therefore shows how machine learning can contribute to the solution of melanin's pressing structural challenge.
Results and discussion
Our data set is the comprehensive library of 830 DHI dimers introduced in ref. 17, for which we model thermodynamic stability (relative free energy of formation, Grel), and the lowest vertical electronic absorption, Eexc. Grel is indicative of the relevance of the dimers as oxidative polymerization intermediates and possible fragments of larger oligomers, and Eexc is directly related to the broad-band absorption and the photoprotection function as it provides the lowest absorption wavelength of these fragments. The Grel and Eexc endpoints were calculated with density functional theory (DFT) and time-dependent DFT, respectively, and cover a range of 183 kcal mol−1 and 4.25 eV, respectively.17 There are 538 linear dimers and 292 cyclic ones that cover a diversity of connectivity and oxidation patterns. By oxidation we mean whether the heteroatoms are in their reduced (–NH–, –OH) or oxidized (–N![[double bond, length as m-dash]](https://www.rsc.org/images/entities/char_e001.gif) ,
, ![[double bond, length as m-dash]](https://www.rsc.org/images/entities/char_e001.gif) O) form. Two representative dimer examples are given in Fig. 2, and more details about the data set composition are given in the ESI, Section ESI1.†
O) form. Two representative dimer examples are given in Fig. 2, and more details about the data set composition are given in the ESI, Section ESI1.†
 | ||
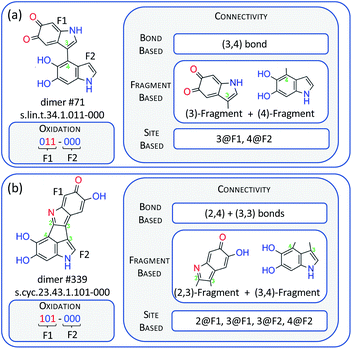
| Fig. 2 Examples of a linear dimer, #71 (a), and a cyclic one, #339 (b), together with their dimer names,17 and codification of their connectivity on the basis of bonds, fragments and sites. F1 and F2 stand for fragment 1 and 2 of the dimer, while 2@F1 represents site 2 on fragment 1, and similar for the other codes. | ||
The structures of the dimers need to be codified into numeric molecular representation strings that provide the input values for the NN. The oxidation pattern can be codified in a straightforward way using six binary digits that represent the six heteroatoms of the dimer. This is illustrated in Fig. 2 with two dimers, a linear (#71) and a cyclic one (#339). We also present the dimer names following the nomenclature of ref. 17. In these digits, a reduced and an oxidized site are codified by ‘0’ and ‘1’, respectively. Codifying connectivity is possible in a number of different ways, and in Fig. 2, we propose three approaches: (a) a bond-based approach where the connectivity is characterized by the numbering of the atoms that form the interfragment bond (see Fig. 1 for the numbering); in the linear #71 dimer, there is one bond between atoms 3 and 4 signified as (3,4), and in the cyclic #339 dimer, there is a bond between atoms 2 and 4, and another one between atoms 3 and 3, signified as (2,4) and (3,3). (b) A fragment-based approach, where every fragment is signified by the atoms that form the interfragment bonds; #71 is composed of fragments (3) and (4), and #339 of fragments (2,3) and (3,4). (c) A site-based approach where the dimers are signified by the sites having an interfragment bond; in #71, this is site 3 on fragment 1 (3@F1) and site 4 on fragment 2 (4@F2), and in #339, they are sites 2 and 3 on fragment 1 (2@F1, 3@F1), and sites 3 and 4 on fragment 2 (3@F2, 4@F2).
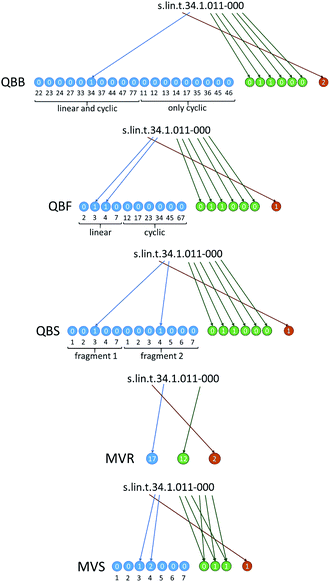
In Fig. 3 we show how these approaches are translated into molecular strings that codify the structure in an unambiguous, unique way. Complete rules to generate the strings are given in ESI, Section ESI2.† The first three are quasi-binary (QB) representations where the digits have possible values of ‘0’ and ‘1’ with exceptions where values of ‘2’ are also possible. The quasi-binary bond-based (QBB) representation has 19 digits codifying the possible interfragment bonds in the dimer. This includes C–C bonds for the linear and cyclic dimers, and also N–C and O–C bonds in the cyclic dimers (O–C bonds are codified using the numbering of the carbon position carrying the corresponding oxygen, i.e. a bond to site 5 or 6 means a bond to the oxygen on C5 or C6). These digits have a value of ‘0’ except for the ones that represent the bonds of the dimer. For instance, dimer #71 has value ‘1’ at the digit corresponding to the (3,4) bond. The quasi-binary fragment based (QBF) representation has 10 connectivity digits that represent the possible fragments of the linear and cyclic dimers, and dimer #71 has value ‘1’ at the digits of the (3) and (4) fragments. Finally, the quasi-binary site-based (QBS) representation has 12 connectivity digits representing possible connectivity sites, and dimer #71 has value ‘1’ at the digits corresponding to site 3 in the first fragment and 4 in the second one. All representations also have 6 digits that codify oxidation in the way explained above. Dimer #71 has two ‘1’ values at the digits that code the oxygen atoms of the first fragment. Finally, there is one additional digit that codifies stereochemistry of the interfragment bond in the linear dimers (cis or trans) or resolves ambiguous regiochemistry in the connectivity of the cyclic dimers.
 | ||
| Fig. 3 Generation of molecular string representations for linear dimer #71 of Fig. 2. The representations of cyclic dimer #339 are given in Fig. S2.† | ||
We have also tested two alternative representations to the QB ones. The first one is a multiple-valued reduced (MVR) representation where we have three digits representing connectivity, oxidation and interfragment stereochemistry, and every possible connectivity, oxidation and stereochemistry pattern is codified by a different value. These digits have 28, 32 and 3 possible values, respectively. The second one is a multiple-valued site-based (MVS) representation where connectivity and oxidation are codified by 7 and 3 digits, respectively. Every single digit signifies connectivity or oxidation in equivalent positions of the two fragments, with possible values of ‘0’ to ‘3’ (e.g. a ‘0’ in connectivity site 2 means that there is no bond at site 2 of either fragment; a ‘1’ means a bond in fragment 1, a ‘2’ means a bond in fragment 2 and a ‘3’ means a bond in both fragments). This scheme is general and can be extended to larger oligomers without changing the number of digits (only the possible values of the digits increase).
Different NNs have been trained using the five representations as input and Grel and Eexc as endpoints. We have trained independent networks for Grel and Eexc. The data set is divided into 60% training, 20% validation and 20% test sets. The details are provided in ESI, Section ESI3,† together with the necessary data set and Python code18 to reproduce the results. The initial tests with a small number of 200 training epochs were carried out to compare the QBB and MVR approaches, using one or two hidden layers with up to 16 nodes per layer. With QBB, the test errors for Grel and Eexc are approximately 12 kcal mol−1 and 0.36–0.40 eV, respectively. With MVR, the errors are significantly higher, 24–34 kcal mol−1 and 0.39–0.55 eV. Therefore, the MVR representation was discarded, and further tests to improve the training conditions were carried out with QBB. The final conditions are two hidden layers of 7 nodes each, 5000 training epochs and a learning rate of 1 × 10⁻². For Eexc, we use an additional transfer learning step (500 initial epochs with a single hidden layer). The details on the initial tests and prediction runs (see below) are given in ESI, Sections ESI4.1 and ESI4.2.†
The prediction capacity of the NN was tested with the QB representations and the MVS one, using the conditions described above. Ten independent runs were carried out for each representation, and in Table 1, we present the average training and prediction errors together with the standard deviation (SD) and the maximal absolute error (MAE). For Grel, the QB representations give training and prediction errors of 6–7 and approximately 9 kcal mol−1, i.e. approximately 5% of the total range. The MAE is 22–27 kcal mol−1. For Eexc, the training and prediction errors are 0.2 and 0.4 eV, i.e. 8–9% relative prediction error. With MVS, the prediction errors are slightly higher than those of the QB models, 6% for Grel and 9% for Eexc, and the MAE, too. The training curves (see the ESI†) show oscillations in the training and validation loss evolution that are probably due to the relatively small size of the training set, which leads to overtraining. Improving the model's performance may be achieved, for instance, with regularization techniques. Such fine-tuning is beyond the scope of the present proof-of-principle work, but it will certainly be necessary to apply the models in real predictions for larger oligomers.
| Endpoint | Input | Training errora | Prediction errorb | MAEc |
|---|---|---|---|---|
| a Average ± standard deviation (SD) of training loss for 10 runs. b Average ± SD of validation and test losses for 10 runs, see Tables S5 and S6 (ESI) for details. c Maximum absolute error. | ||||
| G rel | QBB | 5.8 ± 0.7 (3%) | 9.1 ± 0.9 (5%) | 25.0 (14%) |
| QBF | 6.2 ± 0.7 (3%) | 8.5 ± 0.8 (5%) | 21.6 (12%) | |
| QBS | 6.6 ± 0.8 (4%) | 9.1 ± 1.6 (5%) | 27.2 (15%) | |
| MVS | 8.7 ± 1.0 (5%) | 11.3 ± 2.1 (6%) | 29.2 (16%) | |
| E exc | QBB | 0.25 ± 0.05 (6%) | 0.38 ± 0.02 (9%) | 1.05 (25%) |
| QBF | 0.24 ± 0.03 (6%) | 0.33 ± 0.03 (8%) | 0.83 (20%) | |
| QBS | 0.24 ± 0.02 (6%) | 0.36 ± 0.03 (8%) | 1.04 (24%) | |
| MVS | 0.30 ± 0.03 (7%) | 0.37 ± 0.02 (9%) | 1.29 (30%) | |
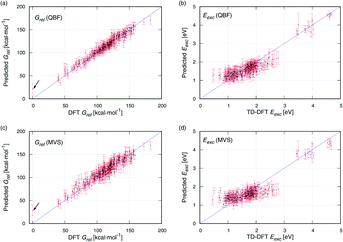
Scatter plots of DFT against the data predicted with QBF and MVS are provided in Fig. 4. For Grel (Fig. 4a and c), the predicted data are evenly distributed around the blue identity line which marks an ideal prediction. MVS has a slightly broader spread than QBF. The molecule with the lowest energy (DFT Grel = 0 kcal mol−1) is highlighted with an arrow. It is the compound with the highest MAE with MVS and QBF because the Grel low energy region is underrepresented in the data set and is difficult to predict, see Fig. S4a.† For Eexc (Fig. 4b and d), the predictions are satisfactory for the group of compounds with Eexc 3.5–4.7 eV (upper right corner of Fig. 4b and d), but for the compounds with Eexc < 3 eV, the prediction is worse. The DFT values cover a range of approximately 2.3 eV (0.5–2.8 eV), but the predictions cover a narrower range (0.9–2.2 eV), and the MAE increases to almost 1 eV. This is consistent with the view that excited-state properties are more difficult to predict than ground-state ones.19
Overall, the NNs have good predictive capacity, with errors smaller than 10%. The performance is good because the structural set is rather homogeneous. Therefore, our fingerprints provide complete, unique molecular representations. This is different from the use of key-based fingerprints in drug design, for example, where they codify the presence of substructures, and different compounds can have the same fingerprint.15 The data set also has underlying trends that correlate the endpoints with the structure, e.g. cyclic and oxidized structures have lower Grel, and fully reduced compounds have higher Eexc. Our representations capture these structural features in a straightforward way, which contributes to their predictive power. Importantly, the fingerprint-type representations can be easily extended to larger structures, either by increasing the number of digits or, following the MVS scheme, increasing the possible values of every digit. The latter option is attractive because it provides the basis for a general representation covering oligomers of different sizes, and in future work, we will assess whether predictions for larger oligomers need new representations with more digits, or the general representation is preferable.
Conclusions
Our work shows the potential of machine-learning models for predicting eumelanin oligomer properties using fingerprint-based representations. We obtain satisfactory results even though the predictive capacity is somewhat limited by the modest size of the DHI dimer data set (830 compounds). In principle, a similar approach should be possible to model DHICA or hybrid DHI/DHICA dimers. This work is currently in progress, and it will be interesting to see if these compound sets need a separate predictive model, or whether it will be possible to build up on the DHI NN to include other dimers.We also plan to extend the work to larger oligomers, where the number of compounds increases exponentially, and larger training sets will become available. In that case, NNs can be used for high-throughput screening of desired oligomer properties. Other possible applications are the use of NNs to correct semiempirical or density functional tight binding methods and develop a fast, eumelanin-specific hybrid quantum-mechanical machine-learning method similar to AIQM1;20,21 or using the fingerprints for clustering-based analyses that may be helpful to prune the vast chemical space of oligomers or generate structure–property relationships with interpretative power. In the long term, these applications shall enable the generation of reliable theoretical melanin models.
Data availability
The data set and code for fingerprint generation and NN training prediction are provided in the ESI† and are publicly available on GitHub (https://www.github.com/llblancafort/dhi_dimers_nn).Author contributions
DB: investigation, methodology, and visualization. JW: data curation. LB: conceptualization, supervision, and writing.Conflicts of interest
There are no conflicts to declare.Acknowledgements
Financial support from the European Commission, project 844230 (MSCA fellowship for JW), and Ministerio de Ciencia, Innovación y Universidades (Spain), project PID-2019-104654GB-I00, and computational time at Red Española de Supercomputación, projects QSB-2019-3-0006, QSB-2020-1-006, QSB-2020-2-0011, and QSB-2020-3-0015, are gratefully acknowledged.References
- M. d'Ischia, K. Wakamatsu, F. Cicoira, E. Di Mauro, J. C. Garcia-Borron, S. Commo, I. Galván, G. Ghanem, K. Kenzo, P. Meredith, A. Pezzella, C. Santato, T. Sarna, J. D. Simon, L. Zecca, F. A. Zucca, A. Napolitano and S. Ito, Pigm. Cell Melanoma Res., 2015, 28, 520–544 CrossRef PubMed.
- F. R. Kohl, C. Grieco and B. Kohler, Chem. Sci., 2020, 11, 1248–1259 RSC.
- M. d'Ischia, A. Napolitano, A. Pezzella, P. Meredith and M. Buehler, Angew. Chem., Int. Ed., 2020, 59, 11196–11205 CrossRef PubMed.
- W. Cao, X. Zhou, N. C. McCallum, Z. Hu, Q. Z. Ni, U. Kapoor, C. M. Heil, K. S. Cay, T. Zand, A. J. Mantanona, A. Jayaraman, A. Dhinojwala, D. D. Deheyn, M. D. Shawkey, M. D. Burkart, J. D. Rinehart and N. C. Gianneschi, J. Am. Chem. Soc., 2021, 143, 2622–2637 CrossRef CAS PubMed.
- M. L. Terranova and E. Tamburri, Polymer, 2021, 229, 123952 CrossRef CAS.
- H. A. Galeb, E. L. Wilkinson, A. F. Stowell, H. Lin, S. T. Murphy, P. L. Martin-Hirsch, R. L. Mort, A. M. Taylor and J. G. Hardy, Global Challenge, 2021, 5, 2000102 CrossRef PubMed.
- E. Di Mauro, R. Xu, G. Soliveri and C. Santato, MRS Commun., 2017, 7, 141–151 CrossRef CAS.
- M. Reali, A. Gouda, J. Bellemare, D. Ménard, J.-M. Nunzi, F. Soavi and C. Santato, ACS Appl. Bio Mater., 2020, 3, 5244–5252 CrossRef CAS PubMed.
- M. Matta, A. Pezzella and A. Troisi, J. Phys. Chem. Lett., 2020, 11, 1045–1051 CrossRef CAS PubMed.
- L. Zong, M. Li and C. Li, Nano Energy, 2018, 50, 308–315 CrossRef CAS.
- W. Jiang, X. Yang, J. Deng, J. Zhang and G. Zhang, J. Mater. Sci., 2021, 56, 19359–19382 CrossRef CAS.
- A. B. Mostert, B. J. Powell, F. L. Pratt, G. R. Hanson, T. Sarna, I. R. Gentle and P. Meredith, Proc. Natl. Acad. Sci., 2012, 109, 8943–8947 CrossRef CAS PubMed.
- C.-T. Chen and M. J. Buehler, Phys. Chem. Chem. Phys., 2018, 20, 28135–28143 RSC.
- C.-T. Chen, F. J. Martin-Martinez, G. S. Jung and M. J. Buehler, Chem. Sci., 2017, 8, 1631–1641 RSC.
- D. Bajusz, A. Rácz and K. Héberger, in Comprehensive Medicinal Chemistry III, ed. S. Chackalamannil, D. Rotella and S. E. Ward, Elsevier, Oxford, 2017, pp. 329–378, DOI:10.1016/B978-0-12-409547-2.12345-5.
- A. R. Leach and V. J. Gillet, An Introduction to Chemoinformatics, Kluwer, 2003 Search PubMed.
- J. Wang and L. Blancafort, Angew. Chem., Int. Ed., 2021, 60, 18800–18809 CrossRef CAS PubMed.
- A. Géron, Hands-On Machine Learning with Scikit-Learn, Keras, and TensorFlow : Concepts, Tools, and Techniques to Build Intelligent Systems, O'Reilly Media, Incorporated, Sebastopol, UNITED STATES, 2019 Search PubMed.
- P. O. Dral and M. Barbatti, Nat. Rev. Chem., 2021, 5, 388–405 CrossRef CAS.
- J. S. Smith, B. T. Nebgen, R. Zubatyuk, N. Lubbers, C. Devereux, K. Barros, S. Tretiak, O. Isayev and A. E. Roitberg, Nat. Commun., 2019, 10, 2903 CrossRef PubMed.
- P. Zheng, R. Zubatyuk, W. Wu, O. Isayev and P. O. Dral, Nat. Commun., 2021, 12, 7022 CrossRef CAS PubMed.
Footnote |
| † Electronic supplementary information (ESI) available: Data set and neural network training details; the data set and code. See https://doi.org/10.1039/d2sc02461f |
| This journal is © The Royal Society of Chemistry 2022 |

