 Open Access Article
Surface coverage control for dramatic enhancement of thermal CO oxidation by precise potential tuning of metal supported catalysts†
Xingyu
Qi
 a,
Tatsuya
Shinagawa
 a,
Xiaofei
Lu
 a,
Yuhki
Yui
 b,
Masaya
Ibe
 b and
Kazuhiro
Takanabe
 *a
*a
aDepartment of Chemical System Engineering, School of Engineering, The University of Tokyo, 7-3-1 Hongo, Bunkyo-ku, Tokyo, Japan. E-mail: takanabe@chemsys.t.u-tokyo.ac.jp
bAdvanced Material Engineering Division, Higashifuji Technical Center, Toyota Motor Corporation, 1200 Mishuku, Susono, Shizuoka, Japan
First published on 11th August 2022
Abstract
Chemical heterogeneous catalysis maximizes performance by controlling the interactions between the catalyst and the substrates. Steady-state catalytic rates depend on the heat of adsorption and the resultant coverage of adsorbates, which in turn reflects the electronic structure of the heterogeneous catalyst surfaces. This study aims to free the surface from high coverage of a kind of substance by externally controlling the electrochemical potential of the catalysts for improved thermal-catalytic rates. We employed aqueous CO oxidation at 295 K as a model reaction, where strong binding of chemisorbed CO (CO*) to the metal surfaces and its high coverage led to inhibition of O2 accessing the surface site. Based on the establishment of coverage–potential–performance correlation, our potential-controlling experiments used an electrochemical configuration to identify the appropriate potentials of Pt/C catalysts that can drastically enhance the CO2 formation rate through the thermal reaction pathway. An anodic potential was applied to suppress the high coverage of chemisorbed CO; consequently, the catalytic testing recorded a 5-fold increase in thermal CO2 formation compared to the open-circuit counterpart with a faradaic efficiency (FE) of over 400%. In situ infrared spectroscopy corroborates the potential–coverage correlation, where the suppression of high CO* coverage due to pinning the catalyst potential triggered the enhancement of thermal-catalytic contribution to CO2 formation. Our extended study employing other metal catalysts also exhibited FEs exceeding unity. This work establishes a universal methodology of electrochemical tools for thermal catalysis to precisely tune the electrochemical potential of solids and achieve green and innovative reactions.
Introduction
Heterogeneous catalytic reactions have enabled fast, selective, and large-scale production of chemicals for centuries;1 these reactions underlie the industrial manufacturing of many common chemical commodities.2 There are now growing concerns regarding sustainable development, and thus, existing catalytic systems are being improved based on a fundamental understanding of their mechanisms.3 From a fundamental perspective, the adsorption of reactant(s) on the catalyst surface is considered one of the core steps of the reaction, whose binding to the surface is expected to be just appropriate to achieve a higher catalytic rate, as suggested by the Sabatier principle.4 In reality, many catalysts exhibit limited activity due to the weak adsorption of reactants such as nitrogen for ammonia synthesis.5 Conversely, when a substance attaches too strongly to the catalyst surface via a chemical bond, it blocks the active sites for the other reactants to approach, thus resulting in low activity.6,7 Therefore, massive efforts have been devoted to optimization of adsorption on the catalyst surface.1,8,9There are multiple factors influencing adsorption of surface species including material-dependent properties, facet selectivity, temperature, and reactant concentrations.10,11 Generally, the electronic state or potential of the catalyst (together with geometric determinants) lays the foundation for how these factors affect the activation of reactants during catalysis,11 and has been considered to be one of the key parameters in assessing catalytic performance.12 Chemical manipulation of the catalyst potential has served as one of the major strategies in the pursuit of improved catalytic activity in the past few decades, mainly known as metal–support interaction (MSI) and the promoter effect.8,13,14 For example, the addition of alkali,8 alkali-earth,15 or rare-earth elements15 to Ru catalysts facilitates catalytic ammonia synthesis due to enhanced nitrogen dissociation and thus optimized adsorption of surface species caused by electron donation to the catalyst.9
Besides promoters, the chemisorption of reactants themselves can also perturb the metal potential.16,17 For instance, Ehsasi et al. reported the dependence of the Pt catalyst's work function on the coverage of surface species (chemisorbed CO (CO*) and oxygen (O*)) during thermal CO oxidation via a Kelvin probe.17 Their study showed that an increase of O* coverage from zero to unity increased the work function (WF) of Pt by almost 800 mV, while full CO* coverage only altered it by ca. 120 mV.17 Studies like this revealed strong correlation between the catalyst potential and coverage of surface species.17,18
In addition to permanent manipulation of the catalyst potential in a chemical manner, in situ perturbation of the catalyst potential has proved effective at equipping the thermal-catalytic system with external electrochemical devices.19 The past few decades have seen extensive studies on the electrochemical promotion of catalysis (EPOC) or non-faradaic electrochemical modification of catalytic activity (NEMCA), e.g., by Vayenas et al.20 In a typical configuration, a solid electrolyte is utilized in the conventional EPOC system and is sandwiched between two catalyst films functioning as a working electrode (WE) and a counter electrode (CE).20 The application of an external electrochemical bias between the WE and the CE drives migration of charge carriers in the solid electrolyte to the surface of the supported catalyst, which functions as a promoter layer and thereby alters the WF of the catalyst.20 The modified surface exhibits adsorption properties distinct from its open-circuit counterpart, i.e., without the applied voltage; the surface catalyzes the reaction with lessened activation energy.20–22 The utilization of such in situ WF alteration enhanced the catalytic performance of thermodynamically-allowed reactions with multi-fold rates and/or selectivity compared to that at open-circuit; representative reactions include (oxygenated) hydrocarbon oxidation,23,24 CO2 hydrogenation,25,26 graphene synthesis,22 and alcohol dehydration.27
The employment of electrochemical promotion was later extended to a few systems consisting of a liquid electrolyte at room temperature.19,28–30 Representatively, the Lercher group reported that the application of cathodic potential induced the in situ removal of surface oxide on the Ni/C catalyst, which made the previously inert Ni/C active for thermal benzaldehyde hydrogenation.31 The Strasser group noted an improved hydrazine decomposition rate over Ni–Co alloys when they applied an anodic potential to the catalyst and attributed this promotion to the facilitated formation of the intermediate that was also involved in the electro-oxidation of hydrazine.32 The Bao group also investigated the promotional effect of external potential on CO2 hydrogenation over the Pd catalyst via a similar mechanism regarding “shared” intermediates by both thermal- and electro-catalytic pathways.33 Additionally, Ryu et al. revealed that for the case of CO2 hydrogenation, the application of a cathodic potential altered the local pH in the vicinity of active sites; this in turn kinetically facilitated thermal hydrogenation.34
However, the comprehensive correlation among adsorbate coverage, catalyst potential and corresponding thermal catalytic performance has not been well paid attention to by the community. Herein, utilizing thermal CO oxidation over Pt at room temperature as a model reaction, we address its coverage–potential–performance correlation and accordingly perturb reactant coverages for an enhanced thermal catalytic rate via the electrochemical potential control in the liquid phase with an external electrochemical device. Prior studies on thermal CO oxidation have revealed that CO* dominates the Pt surface easily at low temperature due to its strong bonding,6,35,36 and made the reaction mechanism change from an oxygen-dissociative pathway to an oxygen-associative pathway, thus resulting in a low reaction rate.6 By electrochemically pinning the potential of the Pt catalyst for the suppression of excessive CO chemisorption and facilitation of activation of the reactant O2, a multi-fold thermal catalytic rate was achieved compared to that at open-circuit.
Results and discussion
Coverage–potential–performance correlation
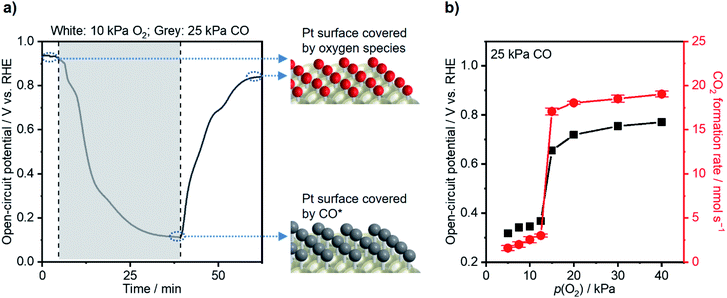
Morphological and electrochemical characterization studies of the commercial Pt/C catalyst were conducted before catalytic performance testing. Transmission electron microscopy (TEM; Fig. S1a†) and energy-dispersive X-ray (EDX; Fig. S1b†) spectroscopy were used to map pristine Pt/C powders. The particles have an average size of 2.5 nm (Fig. S1c†) and are uniformly dispersed on the carbon support. The X-ray diffraction (XRD) pattern of the Pt/C catalyst in Fig. S1d† discloses peaks compatible with metallic Pt and graphite. The WE for subsequent thermal- and electro-catalytic testing was fabricated simply by drop-casting the Pt/C on a carbon paper (CP) substrate. The scanning electron microscopy (SEM) image of the WE in Fig. S1e† shows a microscopically rough surface due to the unevenly dispersed aggregates of Pt/C particles, while Fig. S1f† presents a relatively plain surface of pristine CP.An H-cell consisting of two compartments filled with 0.1 M HClO4 served as the catalytic testing reactor (Fig. S2†), possessing a series resistance of ca. 6 Ω, suggested by potentiostatic electrochemical impedance spectroscopy (PEIS; Fig. S3†). To acquire a general understanding on the decisive effects of adsorbates on the catalyst potential, the WE was first placed under a gas composition of 10 kPa O2 (Ar balance). The sample showed a steady-state open-circuit potential (OCP) of 0.92 V vs. the reversible hydrogen electrode (RHE; Fig. 1a), thus corresponding to a surface covered with oxygen species (OH* and O*).37 Upon changing the gas atmosphere to 25 kPa CO (Ar balance), the WE potential drastically decreased and stabilized at 0.11 V vs. RHE, ascribable to a CO*-covered surface resulting from the consumption of oxygen species and adsorption of CO.35 These simple measurements of electrochemical potential revealed that the change of adsorbate identities significantly altered the electronic state of the catalyst surface. In fact, chemisorption caused a tremendous impact on the catalyst potential; the difference between Pt–CO and Pt–O/Pt–OH at OCP reaches ∼0.8 eV or ∼80 kJ mol−1. When the gas composition changed back to 10 kPa O2, the catalyst potential increased back to 0.86 V vs. RHE, thus suggesting the reversibility of such an OCP shift. The TEM images of the Pt catalysts after the measurement above were taken, and no obvious change was observed (Fig. S4a and b†).
A quantitative estimation of absorbate coverage as a function of catalyst potential was conducted by electrochemical voltammetry. Cyclic voltammetry (CV; Fig. S5† black curve) shows the electrochemical redox feature of the Pt/C catalyst under an Ar atmosphere—the results are consistent with the literature.38 More specifically, at around 0.1 V vs. RHE, one anodic peak and one cathodic peak were observed, assigned to Pt–H desorption and formation, respectively.38 The anodic current increased at around 0.8 V, indicative of the formation of OH*/O*; the broad peak at around 0.8 V in the cathodic scan was attributed to its reduction.38 The red curve in Fig. S5† illustrates the basic electrochemical properties of Pt under 5 kPa CO (Ar balance). With the presence of CO, both Pt–H formation and Pt–H desorption became negligible, thus indicating that CO* occupied active sites of Pt.39 A slight increase in anodic current occurred in the anodic scan from 0.40 V to 0.65 V vs. RHE, which was attributed to the pre-peak of electrochemical CO oxidation.40 When the potential became more positive than 0.65 V vs. RHE, an intense peak appeared and was assigned to the bulk CO electro-oxidation through the following mechanism:40,41
| * + H2O → OH* + H+ + e−, | (1) |
| CO* + OH* → *COOH*, | (2) |
| *COOH* → CO2 + H+ + e− + 2*, | (3) |
| CO* + H2O → CO2 + 2H+ + 2e− + *. | (4) |
In a reverse scan going to a negative potential, the anodic current under diluted CO was observed at potentials more positive than ca. 0.7 V, indicative of electrochemical CO oxidation. Because the bulk CO electro-oxidation occurred at potentials more positive than 0.65 V vs. RHE, a significant CO* coverage (θCO) change was expected to occur. Knowing the electrochemical behavior of Pt under Ar and CO, the CO-stripping method was next used to acquire the quantitative estimation of θCO as a function of Pt potential.42 After CO adsorption on Pt under the CO atmosphere with the targeted potential applied (E1), the gas composition was changed to pure Ar, and then the CV technique was employed to trigger the electrochemical oxidation of pre-adsorbed CO. Fig. S6a–c† show the representative CV profiles with E1 = 0.40 V, 0.61 V and 0.70 V vs. RHE, respectively. An intense anodic peak ascribable to CO stripping was observed with E1 = 0.40 V, and its area decreased with increasing E1 values. By integrating the peak areas of Pt–H desorption (APt–H) and CO* electro-oxidation (APt–CO), θCO at a given potential could be obtained based on the following equation by assuming that adsorption sites for H* and CO* are identical:43
 | (5) |
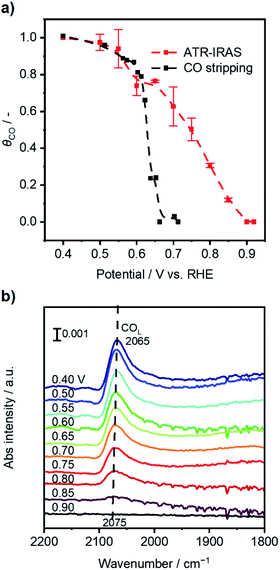
Fig. 2a (black line) shows that the calculated θCO was 1.0 when the potential of Pt/C was 0.40 V vs. RHE, which indicated a fully CO*-covered surface. The result was consistent with previous assignments for OCP of Pt/C under 10 kPa CO (Fig. 1a) and the onset potential of pre-oxidation of CO* observed in CV characterization (Fig. S5†). The increase in the Pt/C potential to 0.60 V vs. RHE resulted in a slight decrease in the θCO of ca. 0.9. A drastic change of θCO occurred when the potential became more positive than 0.60 V, and the θCO reached almost zero at potentials more positive than ca. 0.67 V. These simple electrochemical studies disclosed the coverage–potential correlation in a quantitative manner. However, the θCO at the positive potentials determined by this method was most likely underestimated because holding the potential at E1 prior to CV under Ar could drive electrochemical CO oxidation when E1 is more positive than the onset potential of bulk CO oxidation, i.e., ca. 0.7 V.
In situ attenuated total reflection-infrared absorption spectroscopy (ATR-IRAS) measurement was thus employed for more precise quantification of θCO as a function of OCP of the Pt/C catalyst. There was a negative OCP shift in the WE from a value of over 0.9 V upon placing the Pt/C-deposited internal reflection element (IRE) under a gas composition of 25 kPa CO and 10 kPa O2 (Ar balance). Simultaneously, infrared spectra were recorded at potentials from 0.90 to 0.40 V with an interval of 0.05 V, and the resulting spectra are presented in Fig. 2b. With decreasing Pt/C potential, a band located at ∼2070 cm−1 assigned to the vibration of the C–O bond of linearly-bonded CO (COL) increased its intensity,35 which exhibited a red shift from 2075 cm−1 to 2065 cm−1 due to the Stark tuning effect.44 Based on the results of CO stripping, the θCO at 0.40 V was set to unity, and those at other potentials were calculated according to the following equation:
 | (6) |
An operando measurement of the Pt/C potential was conducted during thermal-catalytic CO oxidation using electrochemical devices, which was investigated by Marin and other researchers and would allow one to link the potential with catalytic performance.19,35,46,47 With the CO partial pressure (p(CO)) fixed at 25 kPa, the O2 partial pressure (p(O2)) varied from 40 kPa to 1 kPa at 295 K. Fig. 1b shows that the CO2 formation rate decreased slightly from ca. 19 to ca. 17 nmol s−1 by decreasing p(O2) from 40 kPa to 15 kPa, and the OCP decreased from ca. 0.77 to 0.66 V vs. RHE. These OCP values corresponded to a θCO of <0.75 according to the potential–θCO correlation in Fig. 2a, suggesting active sites available for oxygen activation. In contrast, the reaction rate significantly declined to ca. 3.0 nmol s−1 when p(O2) decreased to 12.5 kPa. A further decrease in p(O2) did not lead to significant variation of CO oxidation performance. Surfaces with p(O2) < 12.5 kPa experienced an OCP of <0.37 V; according to Fig. 2a, these OCP values coincided with θCO being unity. These analyses established a coverage–potential–performance correlation of thermal CO oxidation over Pt. The results show that the catalyst potential needs to be more positive than 0.6 V to keep the θCO value lower than 0.75; in turn, this leads to a high CO oxidation rate.
Electrochemical potential control for promoted thermal CO oxidation
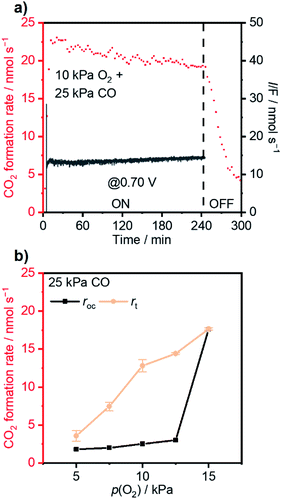
The coverage–potential–performance correlation shows that suppressing θCO was essential to maintain available sites for oxygen activation to achieve a high reaction rate of CO oxidation.6,36,48 Pt/C exhibiting a high rate for CO oxidation had a potential positive of 0.6 V vs. RHE; therefore, it was supposed that pinning the catalyst potential more positive than this threshold could suppress high θCO and facilitate thermal CO oxidation. A reactant composition of 25 kPa CO and 10 kPa O2 (Ar balance) was selected for further study for two reasons: First, the dominant θCO prevailed at this composition (Fig. 1b). Second, the p(O2) was close to a threshold value of 15 kPa so that a relatively slight alteration of potential could trigger large changes in coverage.With co-feeding of both CO (25 kPa) and O2 (10 kPa), CO oxidation performances over Pt with and without application of an external potential were compared. At open-circuit, after the introduction of CO into the O2-filled cell, the CO2 formation rate reached a temporary maximum and then decreased to a steady-state CO2 formation rate of ca. 2.5 nmol s−1 at open-circuit (steady-state OCP measured to be ca. 0.35 V vs. RHE; see also the data in Fig. S8†). However, if an anodic potential of 0.70 V vs. RHE was applied to a fresh WE when the OCP decayed to ca. 0.05 V negative of the targeted potentials, CO oxidation performance drastically changed compared to the open-circuit case. Fig. 3a specifically presents the time–evolution profile of the overall CO2 formation rate and corresponding current under 10 kPa O2 and 25 kPa CO with the application of 0.70 V, showing prevention of deactivation and a steady-state rate of ∼20 nmol s−1, while the recorded electric current was merely ∼1.4 mA. For further analysis, the rates of electrochemical CO oxidation (re) and thermal CO oxidation (rt) were calculated using eqn (7) and (8), respectively, by assuming that all transferred electrons were used for electrochemical CO oxidation (based on the consistent values of the current and electrochemical CO oxidation rate presented in Fig. S9†):
 | (7) |
| rt = r − re, | (8) |
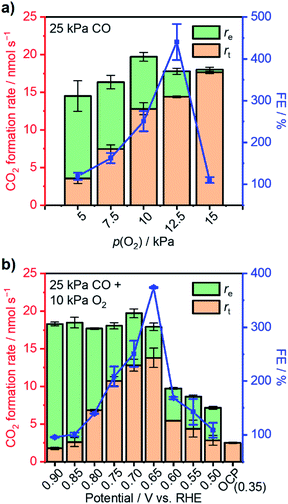
The extent of such promotion depended on the gas-feeding composition. Fig. 3b shows the CO2 formation rate at 25 kPa CO and varied p(O2) with (rt) 0.70 V applied and the rate at open-circuit (rOC). With increasing p(O2) from 5 kPa to 12.5 kPa, rt increased from 3.6 nmol s−1 to 14.4 nmol s−1. Such an increase indicated that, although the variation of p(O2) only caused little difference of rOC, the enhanced supply of O2 could lead to multi-fold enhancement in rt when an external potential was applied. In contrast, such selective enhancement in thermal rate was not observed when p(O2) was increased further to >15 kPa. This behavior likely originated from that the Pt/C catalyst already possessed a high activity for CO oxidation at open-circuit; therefore, the application of an external potential did not result in improvement in performance. The faradaic efficiency (FE) of the reaction was calculated based on the following equation:
 | (9) |
The reliance of enhanced thermal-catalytic performance on the variation of applied potential was also investigated. With co-feeding of 25 kPa CO and 10 kPa O2, external potentials varying from 0.90 V to 0.50 V vs. RHE were applied to the as-prepared WEs separately. With external potentials greater than the threshold of 0.6 V vs. RHE, fresh WEs could avoid performance attenuation after introduction of CO into the reactor. Fig. 4b summarizes CO oxidation performance with varying external potential and corresponding FEs. The overall CO2 formation rate was found to be insensitive to the applied potential at >0.65 V vs. RHE due to diffusion limitation and remained at 19–20 nmol s−1. However, the re and rt varied under these conditions. More specifically, a decrease of re was observed with decreasing potential perhaps due to a lessened overpotential to drive electrocatalytic reactions.19,49 Correspondingly, rt increased significantly and reached its maximum at 0.65 V vs. RHE with a value of 13.8 nmol s−1—more than 5-fold of the rOC (2.5 nmol s−1) under this gas composition at open-circuit. The overall CO2 formation rate decreased to 9.7 nmol s−1 when the applied potential was set to 0.60 V vs. RHE; the rt simultaneously decreased to only 5.4 nmol s−1. A further negative shift of applied potential resulted in decreases in both overall rate and rt. The FE displayed a volcano-shaped behavior when plotted as a function of potential, reaching a maximum of >370% at 0.65 V, indicative of optimal potential for improvement of thermal CO oxidation performance.
To elucidate how the external potential facilitated the thermal CO oxidation performance, in situ ATR-IRAS measurement with application of external potential was conducted under 25 kPa CO and 10 kPa O2 with the balance Ar. Fig. S11a and b† present the infrared spectra with the external potential changing from 0.40 V to 0.90 V vs. RHE and from 0.90 V back to 0.40 V, respectively. Fig. S11c† (red curve) summarizes the average θCO of the two reserve scans as a function of applied potential, which was almost identical to the result at open-circuit (black curve for comparison). At potentials from 0.75 V to 0.65 V where thermal CO oxidation over Pt was significantly improved, the θCO was from 0.74 to 0.53, suggesting ample sites for oxygen activation. At further positive potentials, although θCO exhibited low values, the measured FEs were just around unity (Fig. 4b).
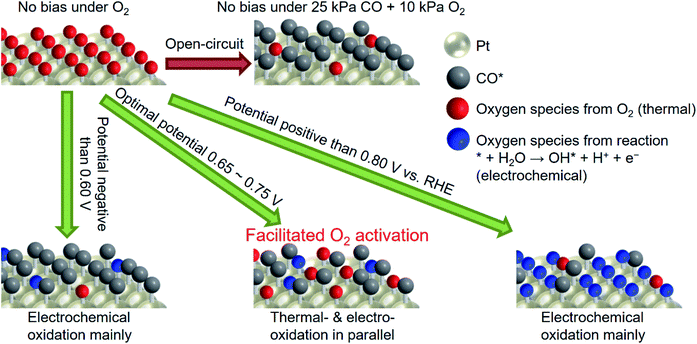
Scheme 1 shows the plausible mechanism for selective enhancement in the thermal catalytic rate. Note that the red and blue balls in the scheme can be the same oxygen species, but how they are made is different; either thermally or electrochemically. After the introduction of CO gas into the reactor, the Pt surface will be easily dominated by CO* at open-circuit. With the application of a potential more negative than 0.60 V vs. RHE, θCO is close to unity, and there are only a few sites for the generation of oxygen species, however, derived from water. When the potential reaches a value more positive than 0.80 V, the large overpotential facilitates the OH* generated from the electrochemical pathway, which still hinders the activation of molecular O2. Application of an appropriate potential (0.65–0.75 V) not only suppresses the adsorption of CO but also favors the activation of O2, leading to improved activity. Notably, in addition to coverage control for maintaining available sites for O2 adsorption, the applied potential itself might also facilitate the transformation of O2* into active OH* or/and O* because these species were also the intermediate of the oxygen reduction reaction (ORR).50 All in all, the observations showed that pinning the catalyst potential electrochemically suppressed high θCO on the Pt surface, which likely facilitated the activation of O2 and therefore enhanced the thermal-catalytic CO oxidation at room temperature.
It is worth noting that using isotopically labelled reactants, such as 18O2, to help experimentally quantify the fractions of CO2 produced from O2 gas (thermally) and water (electrochemically) is actually not practical. Previous studies have pointed out that significant oxygen exchanges will occur among CO2, H2O, and other oxygen species (OH* and O*),51,52 which may lead to incorrect quantification. Instead, density functional theory (DFT) simulation can be one of feasible tools for further quantification.
Universality of electrochemical potential control for improved thermal CO oxidation over other metals
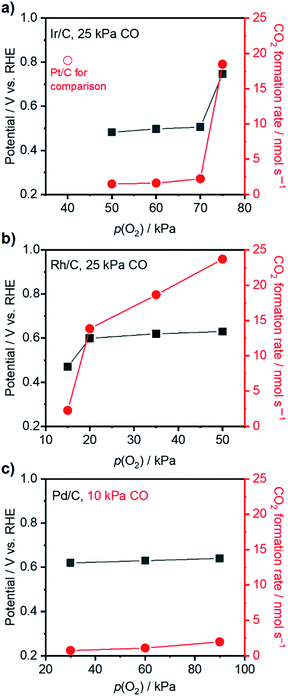
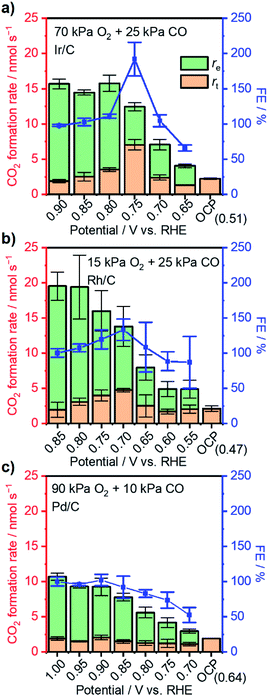
Having acquired an understanding of how the electrochemical potential control tuned the adsorption of surface species and facilitated thermal CO oxidation, this method was applied to other noble metals suffering from excessively strong binding of CO at 295 K, i.e., Ir, Rh, and Pd.53–55 Thermal CO oxidation performances over commercial metal catalysts at open-circuit were measured with 25 kPa CO (10 kPa for Pd/C) and varied p(O2) and are summarized in Fig. 5. Ir/C with a mass fraction of 40 wt% showed a rate lower than 2.5 nmol s−1 and an OCP of around 0.5 V vs. RHE when p(O2) was smaller than 70 kPa. The increase of p(O2) to 75 kPa largely improved the CO2 formation rate to 18.5 nmol s−1 and increased the OCP to 0.75 V vs. RHE. Similarly, significant changes of the rate and OCP over 20 wt% Rh/C (highest mass fraction from the producer) occurred when p(O2) increased from 15 kPa to 20 kPa. Accordingly, gas compositions of 70 kPa O2 and 25 kPa CO were set for the following measurements with an external potential using Ir/C; 15 kPa O2 and 25 kPa CO were selected for Rh/C. Over 40 wt% Pd/C, even with a gas ratio of p(O2)/p(CO) as high as 9, only a low rate of ∼2 nmol s−1 was observed, indicating the occurrence of CO* domination. However, to prevent a diffusion-limited CO oxidation rate that is too small, the p(CO) was not decreased further for Pd/C and set to 10 kPa (with 90 kPa O2). Fig. 6 presents the CO oxidation performance data over these metals with the applied external potential. Over Ir/C, the rt reached a maximum of 7 nmol s−1, which was more than 3-fold rOC. The FE reached a maximum of 192% at 0.75 V vs. RHE, which is indicative of electrochemical promotion. For Rh/C, a maximum of FE of 133% was observed when 0.70 V was applied to the WE, suggesting slight improvement. For the case of Pd/C, FE was always smaller than 100%, and no obvious improvement in rt occurred. Notably, no change of particle sizes of catalysts above was observed by TEM measurements after the application of the potential (Fig. S12†).To elucidate the reason accounting for the difference among metals responding to external potentials, the OCP values of metals under 20 kPa O2 or 25 kPa CO were compared. As shown in Fig. S13a,† although the four metal catalysts exhibited an OCP value of around 0.9 V vs. RHE under 20 kPa O2, the Pd showed a value of 0.41 V vs. RHE when changed to 25 kPa CO, more positive than 0.3 V vs. RHE as observed over other metals. This finding likely indicates the strongest back-donation of electrons from Pd to CO and thus the strongest binding with CO among the four metals. Such a difference in binding strength was further evidenced by CV characterization of metal catalysts conducted under diluted CO (25 kPa for Pt/C, Rh/C and Ir/C, and 10 kPa for Pd/C) as presented in Fig. S13b.† Regarding the onset potential of electrochemical CO oxidation over the four metal catalysts, Pt/C showed the lowest value of ca. 0.43 V vs. RHE; Ir/C and Rh/C showed values around 0.7 V, and Pd/C showed the highest potential of 0.82 V. Additionally, Pt/C, Rh/C and Ir/C all exhibited the peak of bulk CO electro-oxidation located at around 0.9 V vs. RHE, while Pd/C showed the peak at 0.96 V vs. RHE even under a lower concentration of CO. These data disclosed that CO binding to the metals followed the sequence Pd > Ir ∼ Rh > Pt, which likely accounted for the best FEs over Pt/C, and the FEs did not exceed 100% over Pd/C. The difference of the promotional effect over Pt/C, Ir/C and Rh/C might also be due to their distinctive capacities for oxygen activation. More specifically, based on the simulation results reported by Nørskov et al.,56 the four metals displayed the sequence Pt > Pd > Ir > Rh for O* binding energy, OH* binding energy and ORR activity, which meant that Pt was the most capable for oxygen activation and led to the highest FE observed in this study. These rationales suggest that the catalyst with modest binding capabilities can achieve improved performance when its potential is pinned externally via electrochemical means, demonstrating the universality of the methodology developed here.
Conclusions
This study reports that controlling the catalyst potential via electrochemical means can trigger selective enhancement of thermal catalytic performance for CO oxidation as a model reaction. The coverage of CO on Pt/C, θCO, was first well correlated with open-circuit potentials as well as applied potentials. The in situ ATR-IRAS spectra provided the potential–coverage correlation at open-circuit: By lowering the O2/CO feed ratio, the monotonic negative shift of the open circuit potential was monitored from a value from ∼0.90 V to ∼0.40 V, which corresponded to an increase in θCO from zero to unity on the Pt surface. Accordingly, the CO2 formation rate drastically lowered with a boundary at around 0.6 V vs. RHE. This observation suggested that pinning the Pt/C potential at >0.6 V vs. RHE likely kept the surface site available for O2 activation to thus facilitate CO2 formation. Our catalytic testing at an externally applied potential of 0.65–0.70 V vs. RHE indeed recorded a boosting of the thermal-catalytic CO2 formation rate at steady-state, achieving a FE of as high as >400%. Such selective enhancement in thermal catalytic rates was universally observed over Rh/C and Ir/C. This study provides precise correlation among potential–coverage–performance utilizing the electrochemical tool. Bridging thermal- and electro-catalysis, the present study developed a methodology applicable for various catalytic reactions in which the high coverage of a substance inhibits adsorption of the other to react at the steady state.Experimental
Materials
Carbon-supported Pt with a mass fraction of 37.5% (Pt/C, TEC10E40E) was purchased from Tanaka Kikinzoku Kogyo (TKK). Carbon-supported Ir, Pd and Rh with mass fractions of 40%, 40% and 20% were purchased from Fuel Cell Store. Perchloric acid (70%, ACS reagent), sulfuric acid (95.0–98.0%, ACS reagent), ethanol (99.5%, JIS special grade), and acetone (SAJ first grade) were purchased from Sigma-Aldrich. All chemicals were used without further purification. Ultrapure water with a resistivity of 18.2 MΩ cm was obtained from a water purification system (Purelab flex 3, ELGA LabWater) and used for all experimental procedures. Gas cylinders of pure CO (99.95%), pure Ar (99.9999%), pure O2 (99.99995%), and 20% O2 (99.99995%) diluted in Ar (99.9999%) were purchased from Taiyo Nippon Sanso Corporation. A Toray carbon paper 060 value pack (wet proofed), carbon cloth (CeTech W1S1009), and Nafion™ 117 proton-exchange membrane were also purchased from Fuel Cell Store. Polishing suspensions of 1 μm diamond and 0.05 μm alumina were obtained from BAS Inc.Catalyst characterization
TEM images were recorded using a JEM-ARM200F (JEOL Ltd) at 200 kV, and SEM images were recorded with a JSM-IT800 SEM setup (JEOL Ltd) at a beam voltage of 2 kV. The powder XRD (Rigaku, RINT-2000) patterns were measured using Cu-Kα radiation. The signal was collected over the angular range of 10–80° (2 theta) with a scan rate of 5° min−1. The measurements were conducted in air.Catalytic measurement
The CP was cut into sizes of 1 × 1 cm2 or 2 × 2 cm2, subsequently immersed in 0.2 M H2SO4, ethanol, and acetone for precleaning and then dried in air. A catalyst layer was deposited on one side of the CP by drop-casting a catalyst ink containing 10 mg ml−1 metal/C particles dispersed in a mixture of 80 vol% ethanol and 20 vol% ultrapure water. The WE was fabricated by fixing the catalyst-containing CP at a catalyst loading concentration of 0.75 mg cm−2 along with a graphite rod using Teflon tape. The WE together with a KCl-saturated Hg/Hg2Cl2 reference electrode (RE) was placed in one chamber of a two-compartment cell (H-cell; Fig. S2†), and a graphite rod as the CE was placed in another chamber. The cell was filled with 0.1 M HClO4 as the electrolyte and functioned as the reactor for both thermal- and electro-catalytic experiments at room temperature (295 K). The stirring rate of the stirring bar (height: 0.7 cm; width: 2.5 cm) was set at 750 rpm for all experiments. A VMP3 potentiostat (BioLogic) was used for electrochemical procedures, and all electrochemical potentials were presented on the RHE scale. A PEIS technique was used for correction of the uncompensated resistance. The gas outlet from the reactor was analyzed by using a Micro GC Fusion gas analyzer 2-module chassis (Inficon) equipped with thermal conductivity detectors (TCDs).CO stripping
CO stripping was used to estimate θCO.42 After immersing the WE in the electrolyte under a 5 kPa CO (diluted in Ar) atmosphere with a flow rate of 10 ml min−1 for 15 min to remove the air inside, the potential of the WE (1 × 1 cm2) was held at desired potential E1 for 15 min under a 5 kPa CO atmosphere. The dissolved CO was then removed by Ar bubbling while keeping the potential at the same value as before until the current decreased to less than 0.01 mA. CV at a scan rate of 1 mV s−1 led to a CO stripping peak.In situ ATR-IRAS
In situ ATR-IRAS measurement was conducted using a Thermo Scientific™ Nicolet™ iS50 FTIR Spectrometer equipped with a mercury cadmium telluride (MCT) detector cooled with liquid nitrogen and a VeeMAX III ATR accessory (PIKE Technologies). The silicon IRE (Pier Optics) was successively polished with 1 μm diamond suspension and 0.05 μm alumina suspension and washed with ultrapure water. After drying, a Pt/C catalyst layer was deposited on the IRE via drop-casting with an ethanol solution ink containing 0.5 wt% Nafion™ 117 and 5 mg ml−1 Pt/C catalyst followed by heating in a drying oven for an hour at 120 °C. The sample-deposited IRE was introduced into a modified electrochemical ATR cell (PIKE Technologies); a schematic presentation is shown in Fig. S14.† A combination of concentrated HNO3-treated carbon paper and carbon cloth was used as the conductive lead, and a KCl-saturated Hg/Hg2Cl2 electrode and a Pt wire were used as the RE and the CE, respectively. The cell was filled with 0.1 M HClO4 as the electrolyte and purged with Ar.Data availability
All experimental data, and detailed experimental procedures are available upon the request to the corresponding author.Author contributions
The manuscript was written through contributions of all authors. K. T. supervised the project. X. Q., T. S. and K. T. conceived the idea and designed the experiments. X. Q. carried out all the experiments and data analyses. X. L. contributed to the electrode preparation, SEM characterization and ATR-IRAS measurement. Y. Y., and M. I. contributed to the TEM measurement. X. Q., T. S. and K. T. co-wrote the manuscript. All authors discussed the results and assisted during the manuscript preparation.Conflicts of interest
There are no conflicts to declare.Acknowledgements
This work was supported by JSPS KAKENHI Grant Number 19H02510 and TOYOTA Motor Corporation.References
- A. T. Bell, Science, 2003, 299, 1688 CrossRef CAS PubMed.
- F. Schmidt, in Basic Principles in Applied Catalysis, ed. M. Baerns, Springer, 2004, pp. 3–16 Search PubMed.
- R. A. Sheldon, J. R. Soc., Interface, 2016, 13, 20160087 CrossRef PubMed.
- G. Rothenberg, Catalysis: concepts and green applications, John Wiley & Sons, 2017 Search PubMed.
- F. Rosowski, A. Hornung, O. Hinrichsen, D. Herein, M. Muhler and G. Ertl, Appl. Catal., A, 1997, 151, 443–460 CrossRef CAS.
- A. D. Allian, K. Takanabe, K. L. Fujdala, X. Hao, T. J. Truex, J. Cai, C. Buda, M. Neurock and E. Iglesia, J. Am. Chem. Soc., 2011, 133, 4498–4517 CrossRef CAS PubMed.
- M. Kitano, Y. Inoue, H. Ishikawa, K. Yamagata, T. Nakao, T. Tada, S. Matsuishi, T. Yokoyama, M. Hara and H. Hosono, Chem. Sci., 2016, 7, 4036–4043 RSC.
- K. Aika, A. Ohya, A. Ozaki, Y. Inoue and I. Yasumori, J. Catal., 1985, 92, 305–311 CrossRef CAS.
- S. Dahl, A. Logadottir, C. J. H. Jacobsen and J. K. Nørskov, Appl. Catal., A, 2001, 222, 19–29 CrossRef CAS.
- M. J. Hülsey, C. W. Lim and N. Yan, Chem. Sci., 2020, 11, 1456–1468 RSC.
- B. Li, W. Gao and Q. Jiang, J. Phys.: Energy, 2021, 3, 022001 CAS.
- J. Greeley, J. K. Nørskov and M. Mavrikakis, Annu. Rev. Phys. Chem., 2002, 53, 319–348 CrossRef CAS PubMed.
- A. Bruix, J. A. Rodriguez, P. J. Ramírez, S. D. Senanayake, J. Evans, J. B. Park, D. Stacchiola, P. Liu, J. Hrbek and F. Illas, J. Am. Chem. Soc., 2012, 134, 8968–8974 CrossRef CAS PubMed.
- T. W. van Deelen, C. Hernández Mejía and K. P. de Jong, Nat. Catal., 2019, 2, 955–970 CrossRef CAS.
- K.-i. Aika, T. Takano and S. Murata, J. Catal., 1992, 136, 126–140 CrossRef CAS.
- J. Lee, C. P. Hanrahan, J. Arias, R. M. Martin and H. Metiu, Surf. Sci., 1985, 161, L543–L548 CrossRef CAS.
- M. Ehsasi, S. Rezaie-Serej, J. H. Block and K. Christmann, J. Chem. Phys., 1990, 92, 7596–7609 CrossRef CAS.
- R. M. Eiswirth, K. Krischer and G. Ertl, Appl. Phys. A, 1990, 51, 79–90 CrossRef.
- X. Qi, T. Shinagawa, F. Kishimoto and K. Takanabe, Chem. Sci., 2021, 12, 540–545 RSC.
- C. G. Vayenas, S. Bebelis, C. Pliangos, S. Brosda and D. Tsiplakides, Electrochemical activation of catalysis: promotion, electrochemical promotion, and metal-support interactions, Springer Science & Business Media, 2001 Search PubMed.
- M. Stoukides and C. G. Vayenas, J. Catal., 1981, 70, 137–146 CrossRef CAS.
- J. P. Espinós, V. J. Rico, J. González-Cobos, J. R. Sánchez-Valencia, V. Pérez-Dieste, C. Escudero, A. de Lucas-Consuegra and A. R. González-Elipe, ACS Catal., 2019, 9, 11447–11454 CrossRef.
- P. Vernoux, F. Gaillard, C. Lopez and E. Siebert, Solid State Ionics, 2004, 175, 609–613 CrossRef CAS.
- A. de Lucas-Consuegra, J. González-Cobos, Y. García-Rodríguez, A. Mosquera, J. L. Endrino and J. L. Valverde, J. Catal., 2012, 293, 149–157 CrossRef CAS.
- I. Kalaitzidou, M. Makri, D. Theleritis, A. Katsaounis and C. G. Vayenas, Surf. Sci., 2016, 646, 194–203 CrossRef CAS.
- D. Zagoraios, S. Tsatsos, S. Kennou, C. G. Vayenas, G. Kyriakou and A. Katsaounis, ACS Catal., 2020, 10, 14916–14927 CrossRef CAS.
- A. A. Khechfe, M. M. Sullivan, D. Zagoraios, A. Katsaounis, C. G. Vayenas and Y. Román-Leshkov, ACS Catal., 2021, 906–912, DOI:10.1021/acscatal.1c04885.
- S. G. Neophytides, D. Tsiplakides, P. Stonehart, M. Jaksic and C. G. Vayenas, J. Phys. Chem., 1996, 100, 14803–14814 CrossRef CAS.
- D. Labou and S. G. Neophytides, Top. Catal., 2007, 44, 451–460 CrossRef CAS.
- E. Ruiz-López, A. Caravaca, P. Vernoux, F. Dorado and A. de Lucas-Consuegra, Chem. Eng. J., 2020, 396, 125217 CrossRef.
- Y. Song, U. Sanyal, D. Pangotra, J. D. Holladay, D. M. Camaioni, O. Y. Gutiérrez and J. A. Lercher, J. Catal., 2018, 359, 68–75 CrossRef CAS.
- J. Sanabria-Chinchilla, K. Asazawa, T. Sakamoto, K. Yamada, H. Tanaka and P. Strasser, J. Am. Chem. Soc., 2011, 133, 5425–5431 CrossRef CAS PubMed.
- F. Cai, D. Gao, H. Zhou, G. Wang, T. He, H. Gong, S. Miao, F. Yang, J. Wang and X. Bao, Chem. Sci., 2017, 8, 2569–2573 RSC.
- J. Ryu and Y. Surendranath, J. Am. Chem. Soc., 2020, 142, 13384–13390 CrossRef CAS PubMed.
- Q. Tao, Y.-L. Zheng, D.-C. Jiang, Y.-X. Chen, Z. Jusys and R. J. Behm, J. Phys. Chem. C, 2014, 118, 6799–6808 CrossRef CAS.
- G. Ertl, in Advances in catalysis, Elsevier, 1990, vol. 37, pp. 213–277 Search PubMed.
- Y. Liu, M. Mathias and J. Zhang, Electrochem. Solid-State Lett., 2009, 13, B1 CrossRef.
- D. W. Kumsa, N. Bhadra, E. M. Hudak, S. C. Kelley, D. F. Untereker and J. T. Mortimer, J. Neural Eng., 2016, 13, 052001 CrossRef PubMed.
- J. J. Baschuk and X. Li, Int. J. Energy Res., 2001, 25, 695–713 CrossRef CAS.
- T. Yajima, H. Uchida and M. Watanabe, J. Phys. Chem. B, 2004, 108, 2654–2659 CrossRef CAS.
- S. C. S. Lai, N. P. Lebedeva, T. H. M. Housmans and M. T. M. Koper, Top. Catal., 2007, 46, 320–333 CrossRef CAS.
- A. Cuesta, A. Couto, A. Rincón, M. C. Pérez, A. López-Cudero and C. Gutiérrez, J. Electroanal. Chem., 2006, 586, 184–195 CrossRef CAS.
- S. Taylor, E. Fabbri, P. Levecque, T. J. Schmidt and O. Conrad, Electrocatalysis, 2016, 7, 287–296 CrossRef CAS.
- K. Kunimatsu, T. Sato, H. Uchida and M. Watanabe, Langmuir, 2008, 24, 3590–3601 CrossRef CAS PubMed.
- I. J. McPherson, P. A. Ash, L. Jones, A. Varambhia, R. M. J. Jacobs and K. A. Vincent, J. Phys. Chem. C, 2017, 121, 17176–17187 CrossRef CAS PubMed.
- L. Jelemensky, B. F. M. Kuster and G. B. Marin, Ind. Eng. Chem. Res., 1997, 36, 3065–3074 CrossRef CAS.
- J. H. Vleeming, B. F. M. Kuster and G. B. Marin, Ind. Eng. Chem. Res., 1997, 36, 3541–3553 CrossRef CAS.
- Y. Chen, Y. Feng, L. Li, J. Liu, X. Pan, W. Liu, F. Wei, Y. Cui, B. Qiao, X. Sun, X. Li, J. Lin, S. Lin, X. Wang and T. Zhang, ACS Catal., 2020, 10, 8815–8824 CrossRef CAS.
- A. J. Bard and L. R. Faulkner, Electrochemical Methods: Fundamentals and Applications, John Wiley & Sons, Inc., New York, 2nd edn, 2001 Search PubMed.
- A. Kulkarni, S. Siahrostami, A. Patel and J. K. Nørskov, Chem. Rev., 2018, 118, 2302–2312 CrossRef CAS PubMed.
- Y. K. Peng and P. T. Dawson, Can. J. Chem., 1977, 55, 1658–1666 CrossRef CAS.
- S. B. Scott, J. Kibsgaard, P. C. K. Vesborg and I. Chorkendorff, Electrochim. Acta, 2021, 374, 137842 CrossRef CAS.
- T. Matsushima, M. Hashimoto and I. Toyoshima, J. Catal., 1979, 58, 303–312 CrossRef CAS.
- F. Gao, Y. Cai, K. K. Gath, Y. Wang, M. S. Chen, Q. L. Guo and D. W. Goodman, J. Phys. Chem. C, 2009, 113, 182–192 CrossRef CAS.
- F. Gao, Y. Wang, Y. Cai and D. W. Goodman, J. Phys. Chem. C, 2009, 113, 174–181 CrossRef CAS.
- J. K. Nørskov, J. Rossmeisl, A. Logadottir, L. Lindqvist, J. R. Kitchin, T. Bligaard and H. Jónsson, J. Phys. Chem. B, 2004, 108, 17886–17892 CrossRef.
Footnote |
| † Electronic supplementary information (ESI) available: (1) Morphological characterization of the Pt catalyst; (2) the electrochemical cell for catalytic measurement; (3) the PEIS profile; (4) CV characterization of the Pt catalyst; (5) details on the integral of the infrared peak; (6) the time-evolution profile of CO oxidation at open-circuit; (7) diffusion limitation; (8) infrared spectra with external potentials; (9) CO oxidation performance at open-circuit of other metals; (10) schematic presentation of the ATR-IRAS cell. See https://doi.org/10.1039/d2sc03145k |
| This journal is © The Royal Society of Chemistry 2022 |

