
 Open Access Article
 This Open Access Article is licensed under a Creative Commons Attribution-Non Commercial 3.0 Unported Licence
Origin of the polychromatic photoluminescence of zeolite confined Ag clusters: temperature- and co-cation-dependent luminescence†
Li
Sun
 a,
Masoumeh
Keshavarz
a,
Giacomo
Romolini
a,
Bjorn
Dieu
a,
Johan
Hofkens
ac,
Flip
de Jong
a,
Eduard
Fron
*ac,
Maarten B. J.
Roeffaers
*b and
Mark
Van der Auweraer
*ac
a,
Masoumeh
Keshavarz
a,
Giacomo
Romolini
a,
Bjorn
Dieu
a,
Johan
Hofkens
ac,
Flip
de Jong
a,
Eduard
Fron
*ac,
Maarten B. J.
Roeffaers
*b and
Mark
Van der Auweraer
*ac
aChem&Tech – Molecular Imaging and Photonics, KU Leuven, Celestijnenlaan 200F, 3001 Leuven, Belgium. E-mail: eduard.fron@kuleuven.be
bChem&Tech – Centre for Membrane Separations, Adsorption, Catalysis and Spectroscopy for Sustainable Solutions, KU Leuven, Celestijnenlaan 200F, 3001 Leuven, Belgium. E-mail: maarten.roeffaers@kuleuven.be
cKU Leuven Core Facility for Advanced Spectroscopy, Celestijnenlaan 200F, 3001 Leuven, Belgium. E-mail: mark.vanderauweraer@kuleuven.be
First published on 24th August 2022
Abstract
Zeolite confined silver clusters (AgCLs) have attracted extensive attention due to their remarkable luminescent properties, but the elucidation of the underlying photophysical processes and especially the excited-state dynamics remains a challenge. Herein, we investigate the bright photoluminescence of AgCLs confined in Linde Type A zeolites (LTA) by systematically varying the temperature (298–77 K) and co-cation composition (Li/Na) and examining their respective influence on the steady-state and time-resolved photoluminescence. The observed polychromatic emission of the tetrahedral Ag4(H2O)n2+ clusters ranges from orange to violet and three distinct emitting species are identified, corresponding to three long-lived triplet states populated consecutively and separated by a small energy barrier. These long-lived species are at the origin of the polychromatic luminescence with high photoluminescence quantum yields. Furthermore, the Li-content dependence of decay times points to the importance of guest–host–guest interactions in tuning the luminescent properties with a 43% decrease of the dominating decay time by increasing Li content. Based on our findings, a simplified model for the photophysical kinetics is proposed that identifies the excited-state processes. The results outlined here pave the way for a rational design of confined metal clusters in various frames and inspire the specified applications of Ag-zeolites.
Introduction
The atomically precise structure and unique optical and electronic properties of metal clusters have spurred intense research into both the development of applications and their fundamental properties.1–10 Among the many metal clusters reported, silver clusters (AgCLs) consisting of a few Ag atoms have aroused considerable interest due to their molecule-like electronic properties (i.e., discrete energy levels), which led to several applications in lighting,11–15 bioimaging,9,16 sensing17,18 and optical encoding.19,20 Considering that AgCLs tend to aggregate and hence lose these key electronic properties, many smart strategies are proposed to stabilize them chemically and spatially namely applying various templates, such as polymers,21 biological ligands (i.e., peptides, proteins, and DNA)16,22–24 and glass matrices.25 The rigid aluminosilicate crystalline framework of zeolites, as an alternative approach, has been proven to be an ideal scaffold for the uptake of Ag ions by cation exchange and the subsequent formation of AgCLs by thermal activation,19,26,27 H2 reduction28,29 or electromagnetic radiation (gamma rays, X-rays and UV light).13,30–32 AgCLs confined in zeolites exhibit appealing optical properties such as a large Stokes shift, a high photoluminescence quantum yield (PLQY), a broad emission spectrum covering the entire visible range and impressive (photo)stability.27,33–37 Their photophysical properties depend on zeolite topology,27,38 counterbalancing ion (co-cation),14,30 ion-exchange ratio,37 water content26,39 and Ag loading.26,27 Hence, elucidating the relationship between structural and optical properties of Ag-zeolites has proven critical to the field.Recently, our group reported the structural and luminescence variations of the hydrated silver-Linde type A (Ag-LTA) system via tuning the exchange ratio of lithium and sodium ions (Li+ and Na+). Increased guest–host–guest interactions are proposed to determine the optical changes in the Li+ incorporated systems. Namely, the guest Li+ incorporation in the LTA host results in a reduced lattice parameter and a more rigid zeolite framework which in turn leads to a smaller interatomic distance between the silver atoms in the excited state guest AgCLs (Agc–Agc).33
However, due to the complex excited-state dynamics of the system, the fundamental photophysical processes and the origin of the bright luminescence of Ag-LTA composites could not yet be unequivocally determined. At this time, several theoretical models have been put forward to explain the complex photophysical kinetics.40,41 For instance, Grandjean et al. proposed a model in which the luminescent properties of Ag3K9-LTA originate from a confined two-electron superatom quantum system with hybridized Ag and water oxygen orbitals delocalized over the cluster.42 Upon photo-excitation, one electron of the s-type highest occupied molecular orbital (HOMO) is excited to a p-type lowest unoccupied molecular orbital (LUMO) and finally relaxes to the long-lived lowest-lying 3P triplet state to which the major emission is attributed. In this model, the properties of the luminescence depend on the interaction between Ag42+ and coordinated water molecules and/or lattice oxygens in the ground and excited states. Quantum mechanical calculations have also explored the impact of other factors such as different ligands and an asymmetric environment surrounding the core framework, altering the electronic properties.43 Investigating the sodium exchanged Ag3Na9-LTA, Fron et al. reported a fast decaying (∼3 ns) luminescence at room temperature which is incompatible with emission from a triplet state.39
In this work, we systematically study the photoluminescence (PL) of the partly Ag-exchanged AgLiNa-LTA zeolites by considering the impact of environmental temperature and co-cation composition. Samples are characterized by high PLQYs (up to 40% at room temperature) and show polychromatic emission upon adjusting the Li/Na ratio and the environmental temperature. The steady-state temperature-dependent PL reveals the existence of three distinct emitting species which are dominant in different temperature ranges. The kinetics underpinning the interplay of these three emissions are investigated by temperature-dependent time-resolved luminescence covering a time range from picoseconds (ps) to milliseconds (ms). The obtained results reveal the photophysical properties, excited-state dynamics and the origin of the bright luminescence observed in LTA confined AgCLs (for which the structure Ag4(H2O)n2+ has been suggested earlier based on structural analysis and density functional theory calculations33,42,44). In the next step, the long-lived decay times assigned to the main emitting species are tuned by varying the Li/Na composition, highlighting the importance of the co-cation. Armed with these results we feel confident introducing a clear, simplified model for the excited-state kinetics of this class of AgCL in LTA. Furthermore, we are confident that the described tunability of the PL at different temperatures and with different co-cations offers new tools for the rational design of such systems for various applications.
Results and discussion
Synthesis and characterization
A batch of mixed Li, Na and Ag cation-exchanged LTA zeolites with similar Ag loading (theoretically an average of 1 Ag ion per unit cell) and different Li/Na ratios was synthesized by an ion-exchange procedure and then thermally activated to form AgCLs (a detailed description is given in the ESI†). The as-prepared Ag1-exchanged LixNa12−x-LTA (x = 0, 1, …, 12) zeolites have a dehydrated and theoretically predicted chemical composition of Ag1LixNa11−xSi12Al12O48 and are denoted as Ag1LixNa11−x-LTA (x = 0, 1, …, 11). Finally, the obtained samples were hydrated in ambient atmosphere for further study. The elemental analyses by atomic absorption spectroscopy (AAS) and inductively coupled plasma-optical emission spectrometry (ICP-OES) show the precise composition of zeolites to be close to the expected one (Table S1†). The thermogravimetric analysis (TGA) illustrates that the hydrated zeolites all have a similar hydration level with a water content of approximately 20 wt% (Fig. S1†). In addition, the structural characterization reveals a shift of all X-ray diffraction (XRD) peaks to larger angle by increasing doping of Li+ into Ag-zeolites which indicates a reduction of the lattice parameters (Fig. S2†), in line with earlier reported results (∼1.7% decrease).33Steady-state and temperature-dependent photoluminescence
The steady-state PL of the Ag1LixNa11−x-LTA series is shown in Fig. 1, as well as in Fig. S3 and S4.† The two-dimensional (2D) excitation/emission profiles of hydrated Ag1LixNa11−x-LTA zeolites shown in Fig. 1a and b reveal that increasing the Li content leads to a strong blue shift of the emission both at room temperature (RT, 298 K) and at liquid nitrogen temperature (LNT, 77 K), e.g. from an emission maximum of 615 nm to 515 nm (Δ![[small nu, Greek, macron]](https://www.rsc.org/images/entities/i_char_e0ce.gif) ≈ 3157 cm−1) at 298 K and from 412 nm to 368 nm (Δ ≈ 2902 cm−1) at 77 K (see also Fig. S3 and S4, Table S2 and S3†). Such dramatic changes in the emission spectra (Fig. S5†) are assigned to strong guest–host–guest interactions inside LTA zeolites in the presence of Ag+ and Li+.33 Note that the excitation spectra at 298 K and 77 K (Fig. S3 and S4†) show nearly identical features for all Ag-zeolites with maxima of the excitation spectra situated around 250–260 nm and 270–285 nm, respectively. This corresponds well with the diffuse reflectance spectra (DRS) recorded at both temperatures (Fig. 1c). Also, all Ag-zeolites display a comparable PLQY of about 40% (Table S2†) at 298 K; the PLQY is mainly affected by the Ag content, rather than by the co-cation content. Focusing on the emission spectra of Ag1Li6Na5-LTA (Fig. S6†) as an example, a broad emission is observed at 298 K with a maximum around 595 nm (3340 cm−1 full width at half-maximum (FWHM)) and a small shoulder peaking around 495 nm. Upon decreasing the temperature to 77 K, the maximum emission shifts to 395 nm (2430 cm−1 FWHM) and is accompanied by a weaker shoulder centered around 495 nm. The emission peak becomes narrower and sharper at a lower temperature, while the maximum emission intensity increases by more than a factor of 3 compared to 298 K, corresponding to an increasing PLQY of up to 73% (Table S3†); this value of Ag1Li6Na5-LTA at 77 K is 100% higher than that of the same sample at RT. These pronounced intensity changes are attributed to the weaker exciton-phonon coupling at 77 K slowing down the non-radiative decay. Such thermochromic shift of the luminescence and multiple emission bands have been observed in clusters of metals with a closed shell (d10 clusters)45 and are related to both changes in the PL intensity vs. temperature originating from the competition between radiative and non-radiative decays and, PL color modification that can be attributed to either a shift in the emission band or the presence of several emissive species.46
≈ 3157 cm−1) at 298 K and from 412 nm to 368 nm (Δ ≈ 2902 cm−1) at 77 K (see also Fig. S3 and S4, Table S2 and S3†). Such dramatic changes in the emission spectra (Fig. S5†) are assigned to strong guest–host–guest interactions inside LTA zeolites in the presence of Ag+ and Li+.33 Note that the excitation spectra at 298 K and 77 K (Fig. S3 and S4†) show nearly identical features for all Ag-zeolites with maxima of the excitation spectra situated around 250–260 nm and 270–285 nm, respectively. This corresponds well with the diffuse reflectance spectra (DRS) recorded at both temperatures (Fig. 1c). Also, all Ag-zeolites display a comparable PLQY of about 40% (Table S2†) at 298 K; the PLQY is mainly affected by the Ag content, rather than by the co-cation content. Focusing on the emission spectra of Ag1Li6Na5-LTA (Fig. S6†) as an example, a broad emission is observed at 298 K with a maximum around 595 nm (3340 cm−1 full width at half-maximum (FWHM)) and a small shoulder peaking around 495 nm. Upon decreasing the temperature to 77 K, the maximum emission shifts to 395 nm (2430 cm−1 FWHM) and is accompanied by a weaker shoulder centered around 495 nm. The emission peak becomes narrower and sharper at a lower temperature, while the maximum emission intensity increases by more than a factor of 3 compared to 298 K, corresponding to an increasing PLQY of up to 73% (Table S3†); this value of Ag1Li6Na5-LTA at 77 K is 100% higher than that of the same sample at RT. These pronounced intensity changes are attributed to the weaker exciton-phonon coupling at 77 K slowing down the non-radiative decay. Such thermochromic shift of the luminescence and multiple emission bands have been observed in clusters of metals with a closed shell (d10 clusters)45 and are related to both changes in the PL intensity vs. temperature originating from the competition between radiative and non-radiative decays and, PL color modification that can be attributed to either a shift in the emission band or the presence of several emissive species.46
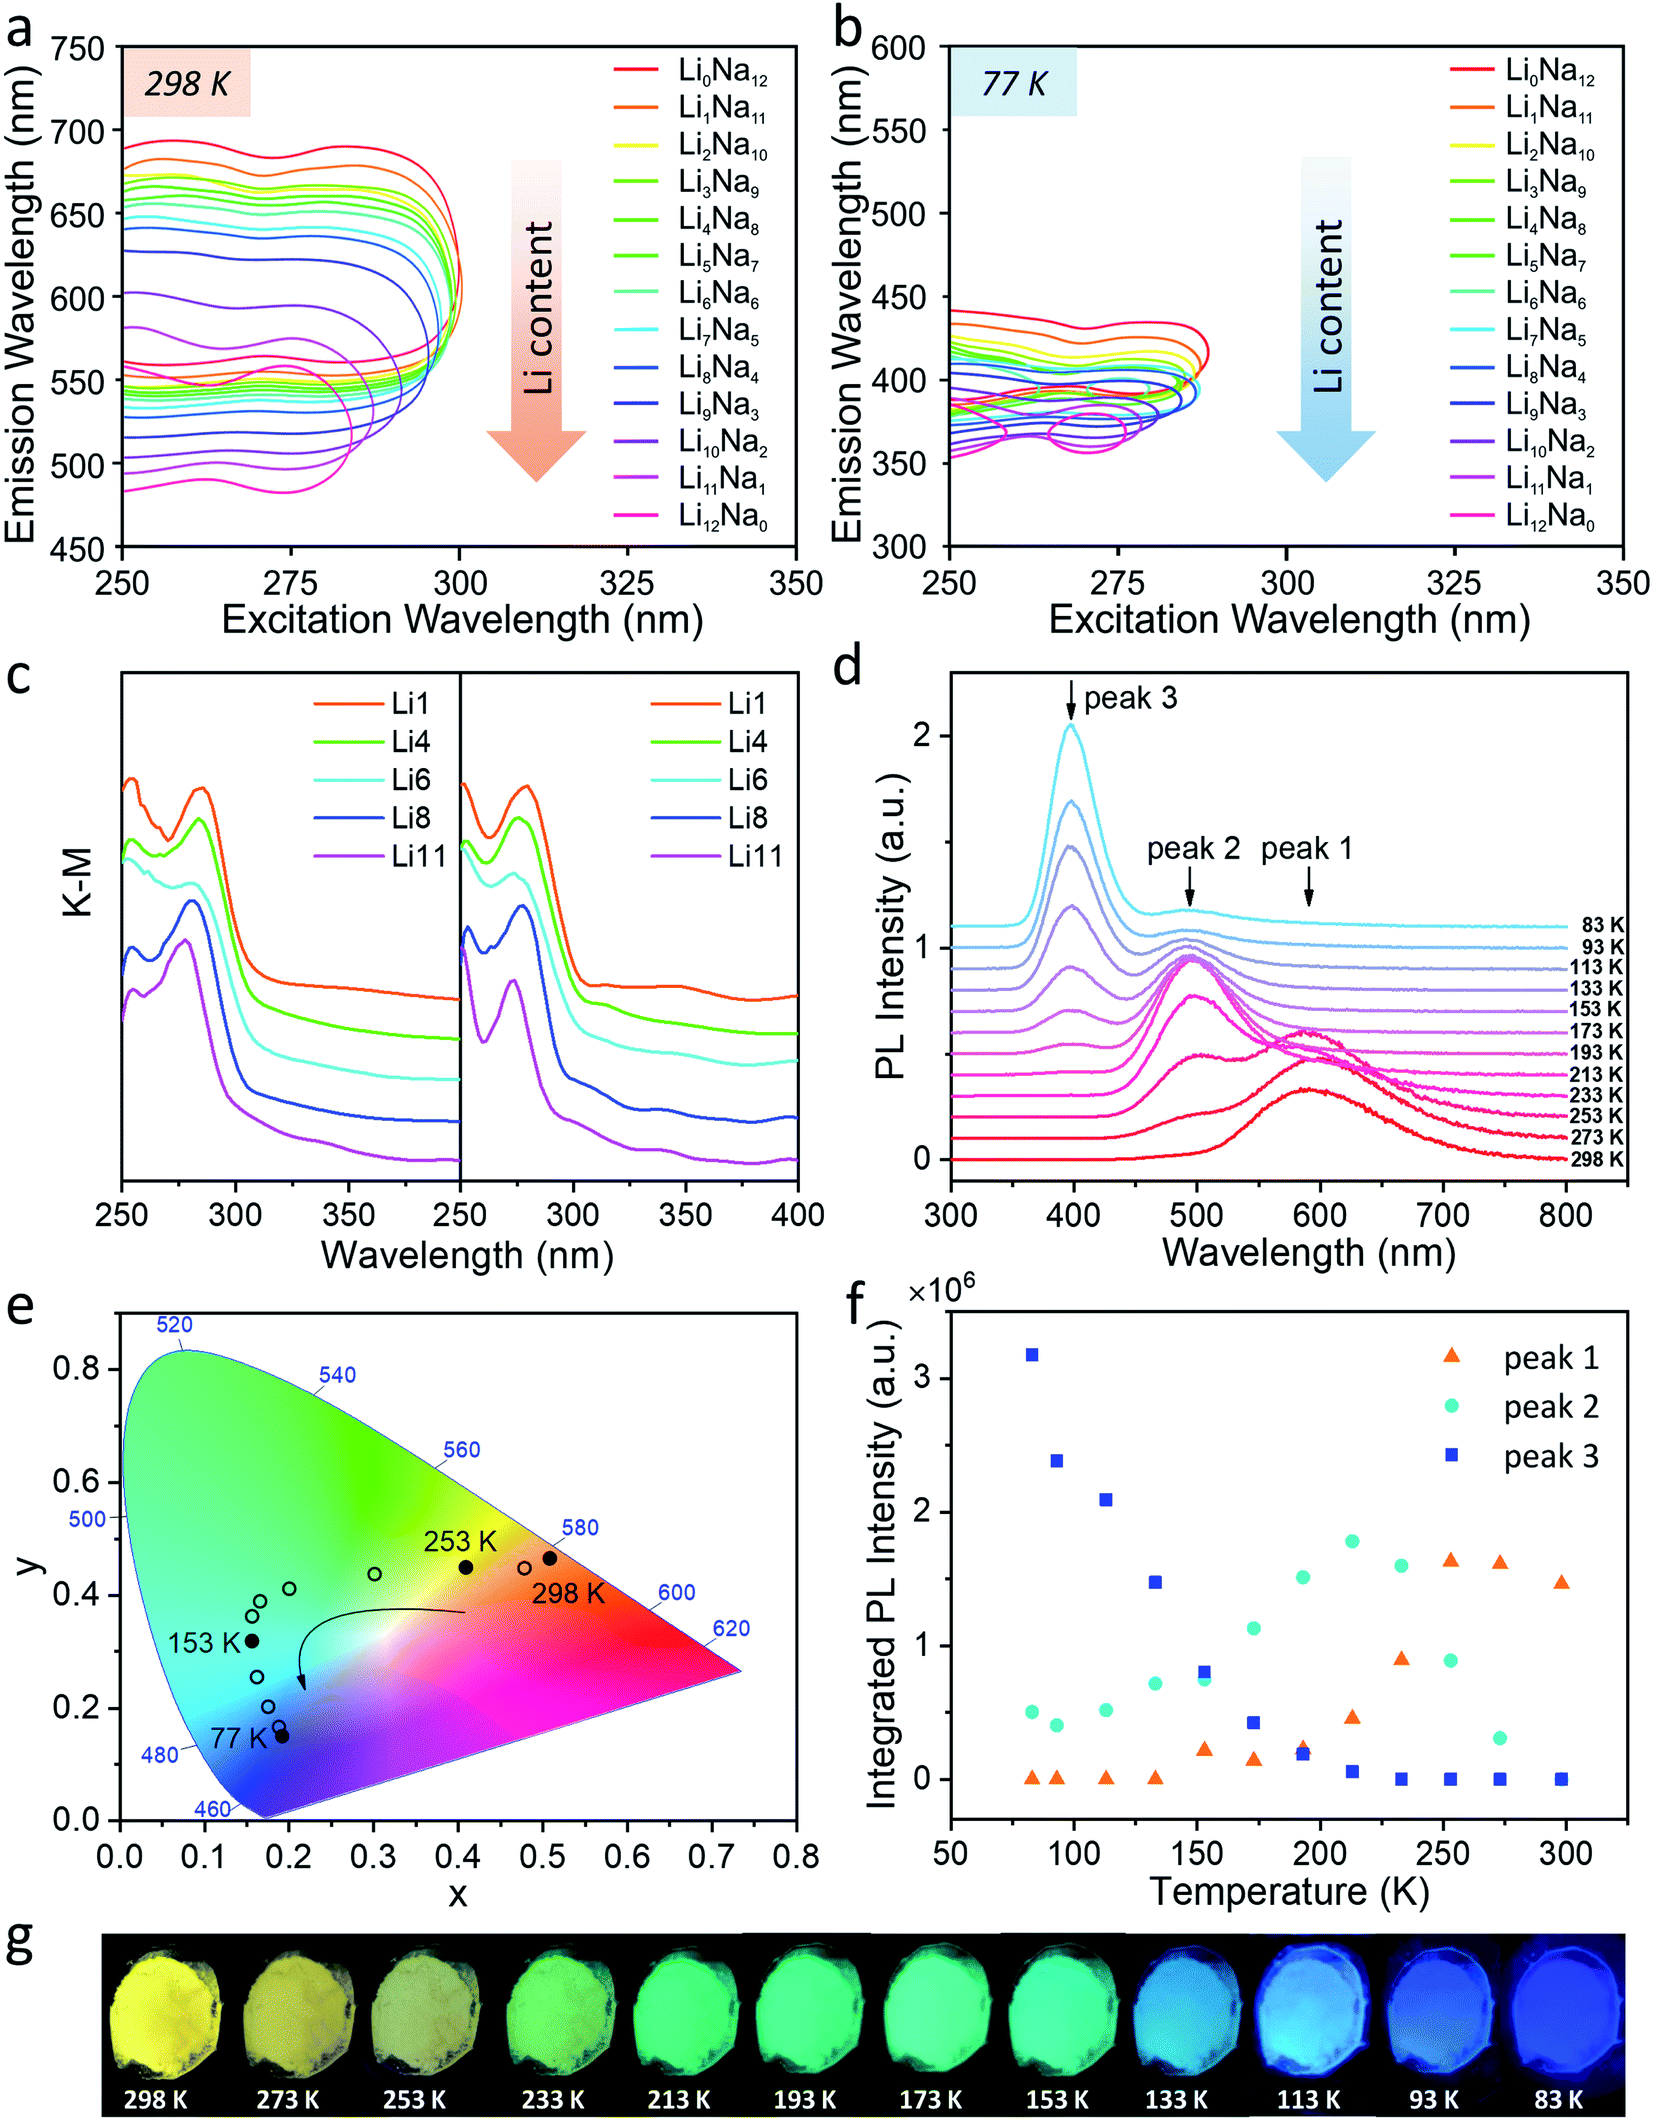 | ||
| Fig. 1 (a) Two-dimensional excitation/emission profiles (at half of the maximum intensity) of hydrated Ag1-exchanged LixNa12−x-LTA (x = 0–12) zeolites at 298 K and (b) 77 K. (c) The diffuse reflectance spectra of hydrated Ag1-exchanged LixNa12−x-LTA (x = 1, 4, 6, 8, 11) zeolites at 298 K and 77 K; samples with different Li composition are simply denoted as Lix (x = 1, 4, 6, 8, 11), as depicted in the legend. (d) Temperature-dependent photoluminescence spectra of Ag1Li6Na5-LTA with temperatures ranging from 298 K to 83 K under 265 nm excitation; the peaks that appear sequentially as the temperature is decreased are called peak 1, peak 2, and peak 3. (e) The CIE (1931) color coordinates of Ag1Li6Na5-LTA emission varying from 298 K to 83 K under 265 nm excitation. (f) Contributions of the three peaks to the entire emission system at different temperatures of Ag1Li6Na5LTA. The procedure for the deconvolution is given in the ESI after Fig. S9.† (g) Photographs of Ag1Li6Na5-LTA powder at different temperatures under illumination by a UV lamp (255 nm). | ||
To explore the origin of this thermochromic behavior, temperature-dependent PL measurements were performed to monitor the evolution of the emission spectrum between 298 K and 83 K. Fig. 1d shows that the emission of Ag1Li6Na5-LTA changes in three distinctive steps upon decreasing the temperature: (1) the peak around 595 nm (peak 1: orange emission) gradually disappears while a peak around 495 nm (peak 2: cyan emission) gains intensity from 298 K to 233 K; (2) cyan emission dominates around 233–153 K and at lower temperatures a new peak around 395 nm (peak 3: violet emission) appears; (3) violet emission gradually enhances with decreasing temperature (153–83 K) while the cyan emission behaves oppositely and the orange emission disappears completely. Notably, this optical change is reversible by gradually heating the sample from 83 K to 298 K (Fig. S7†). These changes result in the color evolution seen in photographs under UV illumination (Fig. 1g) and the Commission International de I'Eclairage (CIE) color coordinates (Fig. 1e) which continuously vary from (0.50, 0.47) at 298 K, characteristic of orange, to (0.19, 0.39) at 213 K (cyan) and finally (0.18, 0.13) at 83 K (violet). These remarkable observations demonstrate the presence of three distinct emitting species with maxima at 595, 495 and 395 nm, and suggest the consecutive population of three distinct excited species. This also confirms that the blue shifted emission bands observed by lowering the temperature from 298 K to 77 K are not related to a hindered vibrational relaxation on the potential energy surface of the excited state corresponding to e.g. gradual changes of the Ag–Ag or Ag–O distances or associated bond angles. Such a process would take place if the excitation would populate higher vibrational levels in the same potential energy surface well from which the emission occurs at the minimum. Here, the cyan and orange emission bands (495 and 595 nm) are due to the presence of additional and different minima in the excited state potential energy surface possibly corresponding to different electronic states. The interconversion between the three emitting species is thermally activated, allowing the tuning of their contributions to the steady-state PL spectrum by changing temperature (Fig. 1f). As increasing the temperature only leads to a minor decrease of the total integrated intensity of the three peaks, the temperature dependence of the integrated intensity of each peak largely reflects the competition between the emission and conversion of the three different states, rather than the competition between radiative and non-radiative decays of each separate state.
Upon investigating the temperature-dependent PL of other Ag1-exchanged zeolites with different Li content (Lix, x = 1, 4, 8, 11), similar PL properties were observed, showing that this thermally activated luminescence is an inherent characteristic of the Ag-zeolite series under study. This means that such a phenomenon is mainly caused by intrinsic properties of the AgCLs inside zeolite cages rather than by a specific Li/Na ratio (Fig. S9†). We have previously observed that the presence of water molecules in the cage plays an important role in the spectroscopy of the AgCLs.39 As expected, for the samples investigated here, both excitation and emission spectra hinge on hydration level. For data and a detailed discussion please refer to ESI (Fig. S10†).
Although a detailed study of exchanging Li+ to other counterions than Na+ is beyond the scope of this work, the hydrated Ag1Li6K5-LTA sample was prepared in a similar way as Ag1Li6Na5-LTA and its emission and excitation spectra were compared to those of Ag1Li6Na5-LTA at RT and 77 K, respectively (Fig. S11†). Consistently, the data indicates the presence of several excited state species related to different minima of the exited state potential surface (see ESI† for more discussion).
Time-resolved luminescence
To gain more insight into the photophysical properties of these Ag-zeolite systems, and to investigate the mechanisms involved in the excited-state dynamics of AgCLs, time-resolved spectroscopy techniques including time-correlated single-photon counting (TCSPC) and nanosecond to millisecond (ns-ms) time-resolved luminescence were employed. As in the steady-state spectroscopy discussion, two key aspects will be discussed systematically: (1) the influence of the environmental temperature, which allows insight into the electronic transition mechanism; (2) the influence of the co-cation composition (Li/Na), which is utilized to study the structural effects on the decay properties.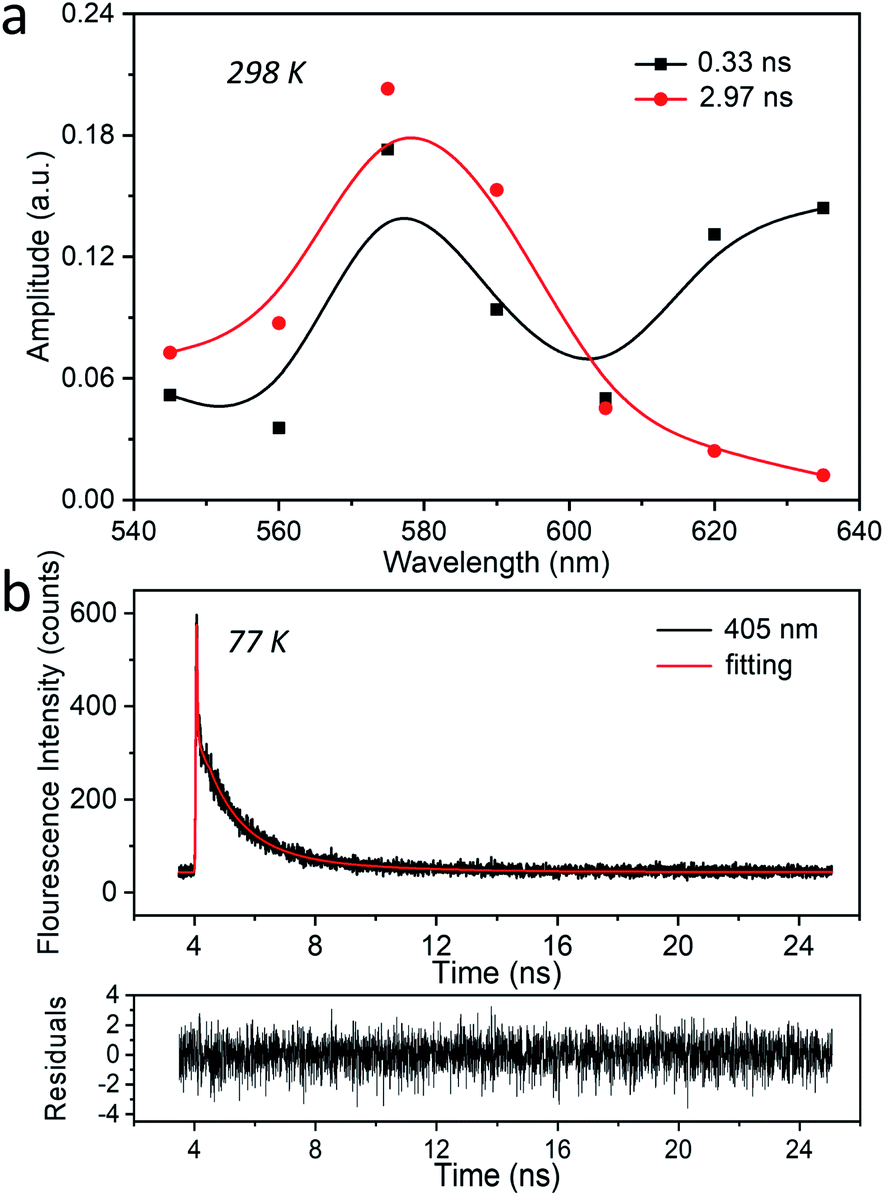 | ||
| Fig. 2 The time-correlated single-photon counting (TCSPC) of Ag1Li6Na5-LTA. (a) The amplitude-to-wavelength dependence (AWD) of different decay components obtained at 298 K in a 26 ns time window (λex = 318 nm, λdet = 545–635 nm). (b) The luminescence decay trace and the corresponding fitting as a bi-exponential decay were obtained at 77 K in a 26 ns time window (λex = 318 nm, λdet = 405 nm). The recovered decay times amount to 1.1 ns and 3.3 ns. | ||
To elucidate the mechanism of the interconversion between different emitting states, four temperatures i.e., 298 K, 253 K, 153 K and 77 K, were selected for ns–ms time-resolved luminescence for Ag1Li6Na5-LTA. The temperature-dependent time-resolved luminescence experiments were performed in a 200 μs and 2 ms time window while the excitation was set to 265 nm (4.68 eV). The decays obtained for solid materials such as this system often require a multi-exponential fit, which often is not unique and we have no underlying physical model. Hence, it is not always possible to unambiguously assign every recovered decay time to a specific species. In this context, we will focus our attention on the main emitting species and try to discuss other significant components based on their AWDs. From the decay traces detected in the range of 400–760 nm at 298 K (Fig. S13†), four decay components were resolved as 172 ns, 685 ns, 15.4 μs and 203.6 μs, and the correspondent AWDs are displayed in Fig. 3a. The component with the shortest decay time of 172 ns has a very low (<1%) contribution to the stationary emission and decay associated spectra (see DAS in Fig. S17a†), and can be attributed to an impurity or to clusters with a slightly different structure and low abundance. However, the amplitudes of the other three slower decaying components (685 ns, 15.4 μs and 203.6 μs) contribute mainly around 495 nm, in the range 495–560 nm, and around 595 nm respectively. Notably, the amplitude of the 685 ns component becomes negative at wavelengths above 600 nm, indicating that the species emits at 595 nm is populated by the excited state emitting at 495 nm (Fig. S18†).47 The inverse of this time constant (685 ns) corresponds to the sum of the decay rate constant of this species to the ground state and the rate constant for the interconversion. From the DAS in Fig. S17† it becomes very clear that the 203.6 μs component presents the dominant contribution (about 90%, 10% being attributed to the 15.4 μs one) to the steady-state PL which is corroborated by the close resemblance of its AWD and DAS to the RT stationary emission spectrum of Ag1Li6Na5-LTA. Such a long-lived species may suggest a triplet state decaying through spin-forbidden radiative and non-radiative processes. The component with a decay time of 15.4 μs, however, is more puzzling. Its AWD is overlapping with both the 495 nm and 595 nm species. Since the steady-state spectroscopy clearly showed three emitting states, of which the 595 nm and the 495 nm are of interest at this temperature, it is unlikely this is due to yet another species. It might however indicate some distribution of decay times for each emitting species owing to the slightly different local environments leading to different radiative and non-radiative rates. This distribution of decay times will be discussed further in more detail.
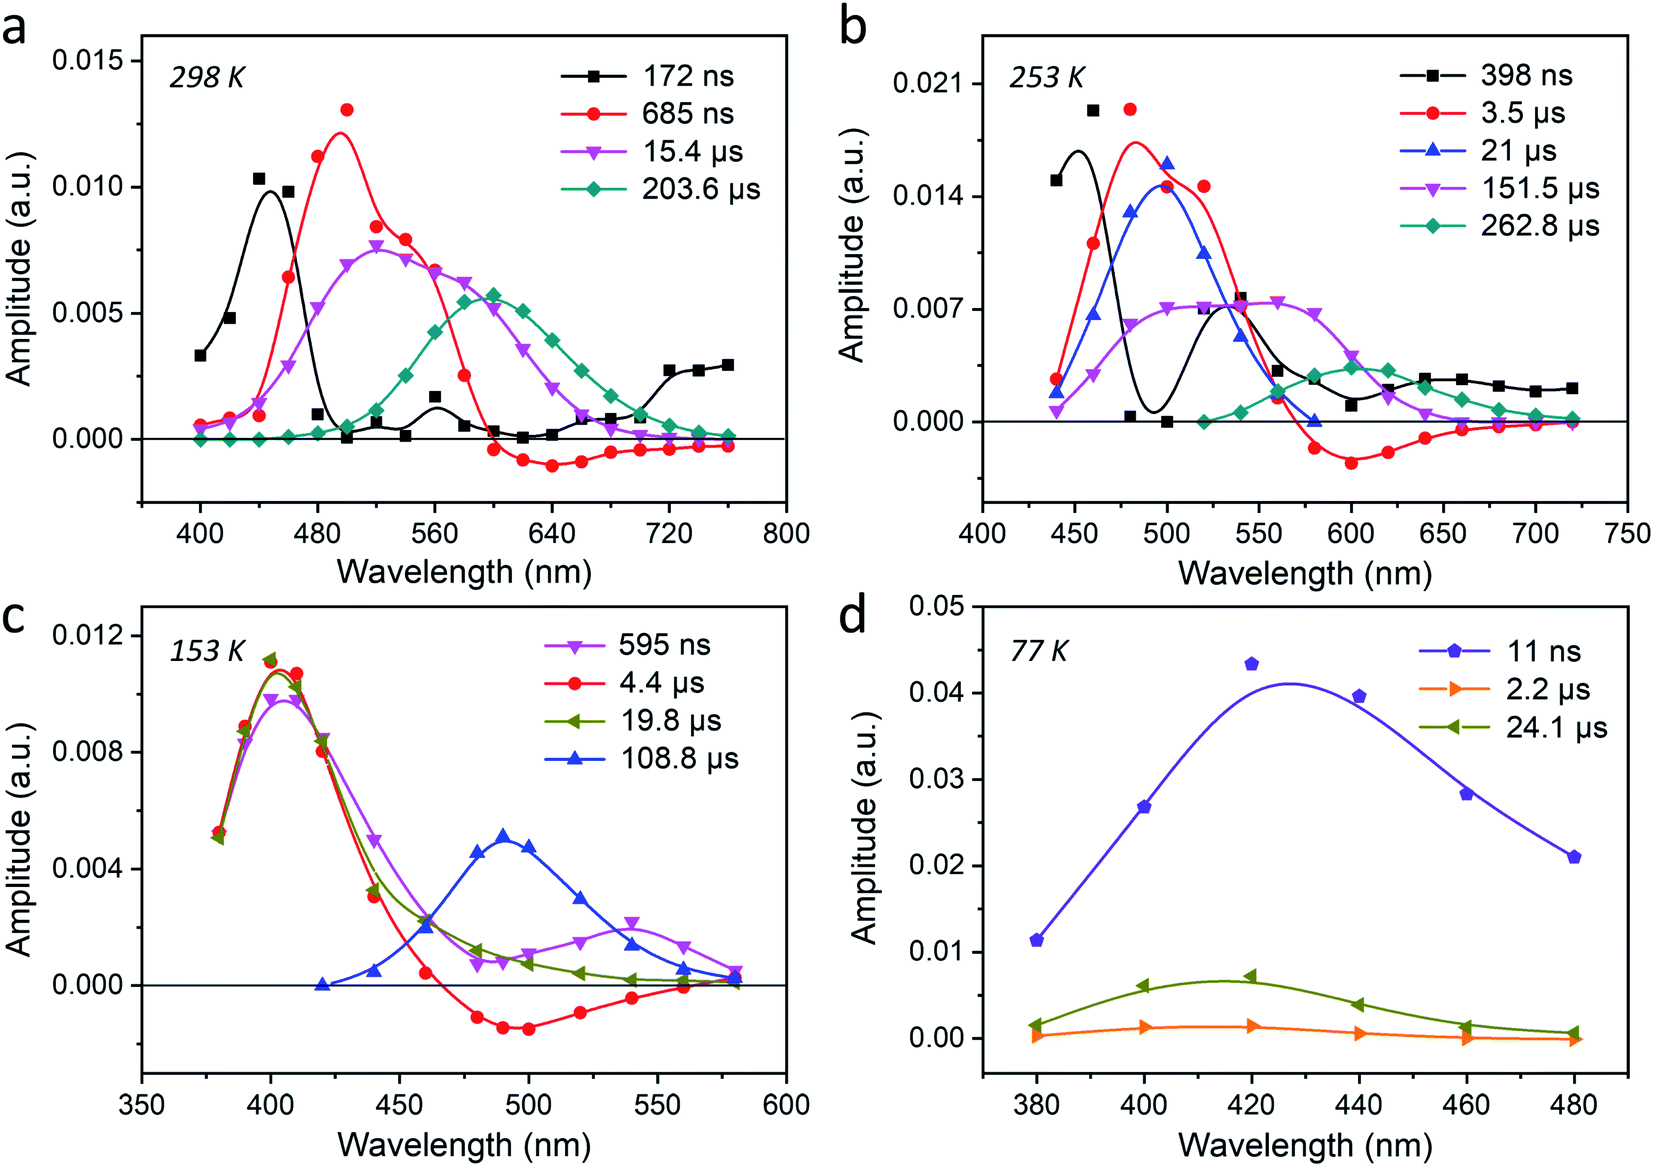 | ||
| Fig. 3 Temperature-dependent time-resolved luminescence of Ag1Li6Na5-LTA. The amplitude-to-wavelength dependence (AWD) of different decay components obtained by ns–ms time-resolved luminescence experiments at (a) 298 K, (b) 253 K, (c) 153 K and (d) 77 K using a 2 ms time window (λex = 265 nm, λdet = 380–760 nm). | ||
When the sample temperature is decreased to 253 K, the AWD shows similar features as at 298 K (Fig. 3b and S14 and S17b†), while the decay times are all longer than at 298 K. Using similar arguments as for 298 K, we can exclude the 398 ns component (<1% contribution) from the analysis and attribute the components with a 3.5 μs and 262.8 μs decay time to the 495 nm and the 595 nm species respectively. Interestingly, we see that the AWD shape of the 151.5 μs decay changed slightly compared to that of the 15.4 μs decay observed at 298 K. The decreased amplitude of the 151.5 μs component around 495 nm is accompanied by the appearance of a fifth component with a decay time of 21 μs whose AWD is overlapping with the 495 nm emission. This further strengthens our assumption that this additional component is due to an underlying distribution of decay times for the individual emission bands. This also accounts for the tenfold increase in decay time going from 15.4 μs to 151.5 μs, which is due to the splitting of the former component into a shorter 21 μs component and a longer 151.5 μs component.
Decreasing the temperature further to 153 K, the emission of the 595 nm species disappears which is in accordance with its disappearance in the steady-state emission spectra. We retrieved three decay components with maxima at 395 nm (595 ns, 4.4 μs and 19.8 μs) and one component with a maximum around 495 nm (108.8 μs) (Fig. 3c and S15†). Similar to the negative decay amplitudes observed at 298 K and 253 K, here the decay amplitudes of the 4.4 μs component also become negative around 495 nm. This is a clear indication that the species emitting at 395 nm is the precursor of the species emitting at 495 nm.
At 77 K finally, three decay components were retrieved with amplitudes in the blue part of the spectrum (Fig. 3d and S16†). The main component with the maximum at 415 nm has a decay time of 24.1 μs, and its AWD resembles the stationary emission spectrum recorded at the same temperature. This component contributes about 97% to the stationary emission intensity (Fig. S17†). The 2.2 μs component, also centered at 415 nm, has a much smaller amplitude and contributes about 2% to the stationary emission intensity. As discussed before this component can be attributed to AgCLs with a slightly different environment. The fastest decaying component (11 ns) is close to the time resolution of the setup (10 ns) and might correspond to the ns species observed by a dedicated nanosecond setup (TCSPC) as described earlier (Fig. 2b).
The analysis of the decays suggests that the bright main-emission of Ag1Li6Na5-LTA should be attributed to triplet species. Based on the results obtained from the temperature-dependent PL and time-resolved luminescence, one can conclude that the components with the long (tens or hundreds of μs) decay times of the three main emitting species are at the origin of the bright emission observed in Ag1Li6Na5-LTA with high PLQYs. Considering that even at RT the PLQY is still close to 0.4, the outspoken decrease in decay times recorded for the species responsible for the cyan and violet emission must be due to thermal activation of the rate of interconversion between these three species rather than to an increase of the non-radiative decay rate constant. This also means that at lower temperatures where we can observe peak 3 and peak 2 or peak 2 and peak 1 simultaneously, the decay of the corresponding excited species is mainly determined by the rate of interconversion between those three species.
≈ 2902 cm−1) of the central peak of the AWD curves (Fig. 4b and d) and DAS (Fig. S46†) of this component. Besides these tunable photophysical properties, our samples also present good photostability with no significant changes observed for their 2D plots that were re-checked after the measurements of low-temperature PL and time-resolved luminescence (Fig. S47†).
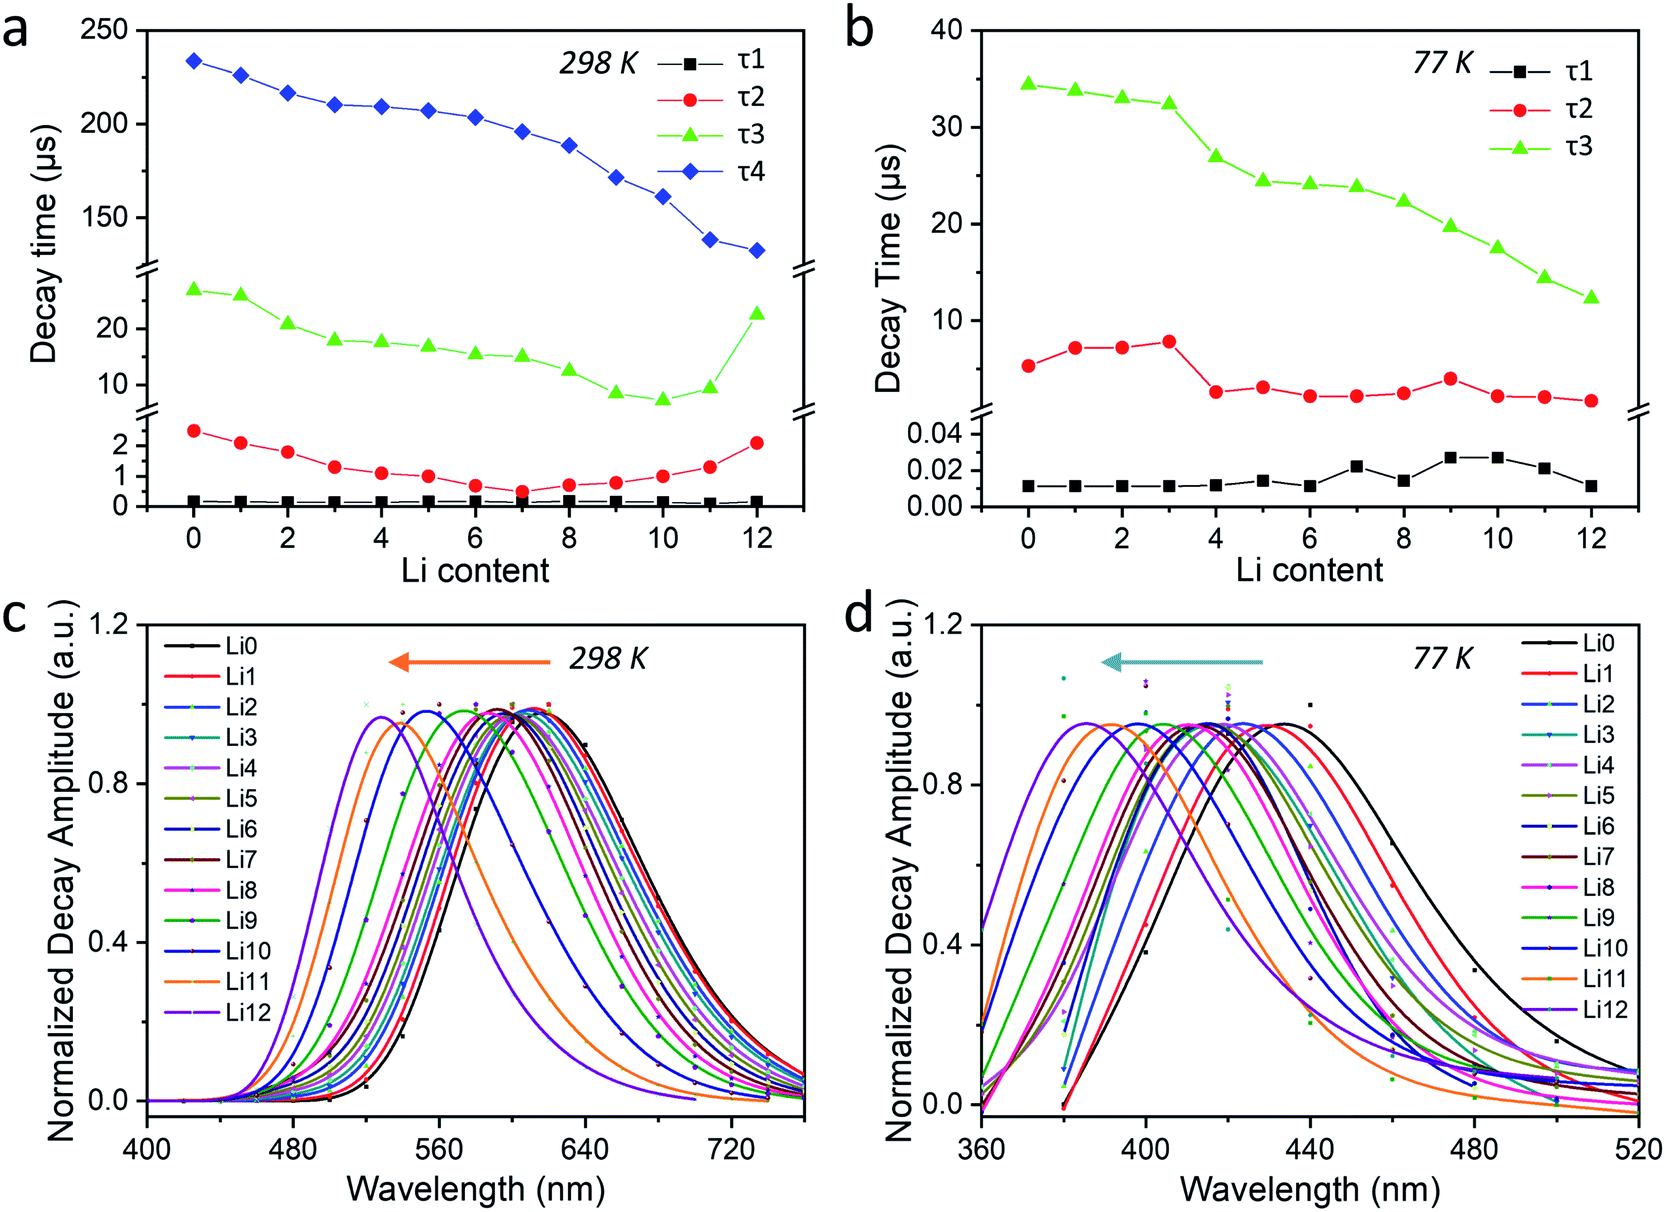 | ||
| Fig. 4 (a) Influence of the Li/Na ratio on the decay times of Ag1-exchanged LixNa12−x-LTA (x = 0–12) zeolites recorded on the ns-ms time resolution at 298 K in a 2 ms time window and (b) at 77 K in a 200 μs time window. AWD curves of the longest-lived components for different zeolite samples: (c) for τ4 at 298 K and (d) for τ3 at 77 K (λex = 265 nm, λdet = 360–760 nm). | ||
The kinetic model
Combining the analysis of the temperature- and co-cation-dependent stationary PL and time-resolved luminescence with existing computational work of AgCLs in zeolites42,44 allows to draw simplified kinetic schemes (taking into account only major decay components) in Fig. 5 and S48 and S49.† According to the quantum mechanical calculations, emission in the wavelength range observed here must be attributed to tetrahedral Ag4(H2O)n2+ clusters inside LTA zeolite. In this model, the ground state (S0) configuration consists of a doubly occupied HOMO corresponding to a symmetric s-type orbital. The excited states are formed by three singlet–triplet pairs (S–T) with the singlet (S1–3) and triplet (T1–3) corresponding to a configuration where an electron is excited from the HOMO to one of three orthogonal one-node p-type orbitals acting as LUMO. Due to the interaction with the LTA-cage, the degeneracy of those three orbitals is lifted. Upon excitation, one electron is excited from the s-type to a p-type orbital leading to the Franck–Condon excited state (S*) followed by a rapid internal conversion (ICS3). This process is a combination of pure vibrational relaxation and structural relaxation (as shown previously a considerable increase of Agc–Agc equilibrium distance upon excitation occurs)33 to the S3 state which emits with a maximum at 405 nm (3.06 eV).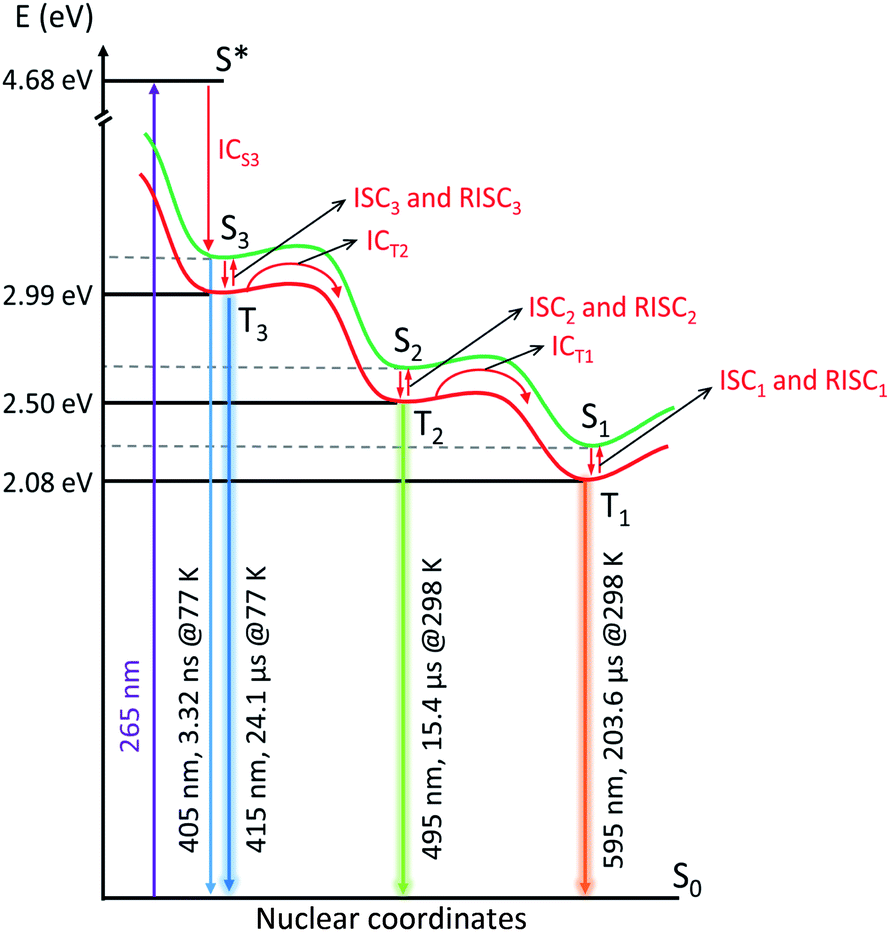 | ||
| Fig. 5 Proposed simplified kinetic electron relaxation scheme for the processes observed upon photoexcitation of Ag1Li6Na5-LTA as a function of temperature (λex = 265 nm). The green and red lines are schematic potential energy curves of the singlet (S) and triplet (T) states, respectively, illustrating the geometry change. The emission maximum and the decay time of major component of the luminescence decay at specific temperatures are indicated next to the corresponding radiative relaxations (blue, lime and orange lines). The possible transitions between the different excited states are indicated by red arrows and assigned with red fonts (internal conversion (IC), intersystem crossing (ISC) and reverse intersystem crossing (RISC)). | ||
At 77 K, a small fraction of the S3 state population directly decays to the S0 state via weak fluorescence in a few ns (1.1 ns and 3.32 ns), while a large fraction undergoes intersystem crossing (ISC3) to the T3 state emitting at 415 nm (2.99 eV). Presumably, the two nanosecond decay components are in fact a representation of a distribution of decay times induced by a dispersion in environmental factors affecting the cluster radiative properties. In this respect one should note that also for the processes occurring on μs time scale such as emission of from the triplet state or interconversion between the triplet states always a distribution of rate constants was observed. Based on the theoretical calculations43 and in agreement with the experimental results, the AgCLs under study possess asymmetric structures as a result of an asymmetric cluster core, an asymmetric cage, or an asymmetric placement of the core within the cage facilitating the ISC processes. This T3 state then decays to the S0 state with a decay time of 24.1 μs via violet phosphorescence. Notice that no emission from T2 and T1 is observed at 77 K, these states at 77 K are neither populated by relaxation from T3 or T2 nor by ISC from S2 and S1. Hence, this also means that S2 and S1 are not populated by direct excitation suggesting that the equilibrium geometry of those states differs strongly from that of the S0 state. Here, one should note that the excitation spectra at 77 K of the (weak) emission in the red tail of the emission spectrum at 495 and 595 nm do not show appreciable intensity above 375 nm (Fig. S8†). This indicates that the species responsible for orange and cyan emission cannot be populated by direct excitation, they are only accessible by the doorway species responsible for the violet emission.
Upon increasing the sample temperature to 153 K, it becomes possible for the major fraction of the excited AgCLs to overcome the barrier separating T3 from T2 (495 nm, 2.50 eV) leading to the formation of T2 with a time constant of 4.4 μs as indicated by the negative amplitude of this component at the wavelength where T2 emits. The T2 state formed at 153 K decays again by radiative and non-radiative processes to S0 yielding a bright cyan phosphorescence with a decay time of 108.8 μs. The barrier for the interconversion from T3 to T2, which must be overcome by thermal activation, can be related to the geometry change of AgCLs with T3 → T2 (ICT2) (Fig. 5). This geometric relaxation corresponds to a major change in the tetrahedral geometry of the Ag42+ cluster or a displacement of the Ag42+ cluster where e.g., the bond lengths to some surrounding oxygens are lengthened while those to other oxygens are shortened. Preliminary time-dependent density functional theory (TD-DFT) calculations suggest a flattening of the tetrahedral geometry upon intersystem crossing which in turn affects the bond lengths between the Ag and oxygen atoms. In this case, we would expect that this relaxation and the corresponding barrier are similar for S3 → S2 (ICS2) but with lower efficiency (detailed discussion is in the ESI†). This suggests that the geometric relaxation prefers to take the highly efficient ICT pathway. However, one cannot exclude that the barrier could also be overcome by a mechanism related to the reverse intersystem crossing (RISC) where efficient ISC3 to T3 is followed by the sequence T3 → S3 → S2 → T2 (RISC3 → ICS2 → ISC2) (Fig. S49†). Since the energy gap between the S3 and T3 states (ΔEST3 = 0.07 eV) is expected to be sufficiently small,48 this may make the RISC3 feasible when induced by thermal activation (the same case for RISC1 and RISC2 at high temperatures). Further discussion on this topic can be found in the ESI.†
For the other components of the T3 emission (595 ns and 19.8 μs), there is no direct evidence in the AWD plots that they also undergo a conversion to T2 besides deactivation to S0. However, at higher temperatures the species linked to those components must also be converted mainly to T2 (and in the next step to T1) as the total PLQY of T1 amounts to ∼0.4 at 298 K. This suggests that there is probably a distribution of the rate constants for decay of T3 to S0 and conversion of T3 to T2. As ICT2 has to compete with phosphorescence from T3 (kph3) and non-radiative decay of T3 to S0 (knrT3), the inverse decay time which amounts to 1/(4.4 μs) = 2.3 × 10⁵ s−1 equals kICT2 + kph3 + knrT3. Hence 2.3 × 10⁵ s−1 is an upper limit for kICT2 of the major component at 153 K. This also suggests a distribution in the environment of the AgCLs which could also explain the large width of the emission bands of the different emitting species. Such a distribution also means that the analysis of the luminescence decays as a triple or quadruple exponential decay and the recovered decay times are to some extent arbitrary with a continuous distribution of decay times. The distribution in rate constants kICT2 and the corresponding activation barriers is also indicated by the observation that it is not possible to fit the temperature dependence of the integrated intensity of peak 3 (Fig. 1f) to a simple combination of a temperature independent components, related to the phosphorescence and intersystem crossing to S0, and a component related to kICT2 showing an Arrhenius type temperature dependence. This does not impede that the recovered decay times indicate roughly the time range in which the different photophysical processes occur. Anyway, the conversion from T3 to T2 is much slower than what would normally be expected for IC occurring with a rate constant exceeding 1010 s−1. Otherwise, fluorescence from S3, ISC3 or phosphorescence from T3 would not be able to compete effectively with the interconversion.
At elevated temperatures of 253 K and 298 K, the T2 population undergoes a similar process being transferred into T1 state which relaxes to S0 state via bright orange phosphorescence with a decay time of 262.8 μs and 203.6 μs at 253 K and 298 K respectively. Similarly, the non-radiative interconversion process can either take the path of T2 → T1 (ICT1) facilitated via the geometric relaxation (Fig. S48†), or the path of low efficient ICS1 after the thermal barrier at RISC2 and followed by the ISC1 to arrive at T1 state (Fig. S49†).
If the AgCL reported here has a similar geometric structure corresponding to Ag4(H2O)n2+, considering the model proposed by Grandjean et al., it is tempting to assign the three excited states to a transition from the s-type orbital to the three different p-type orbitals. Although this process would in principle have a similar transition dipole for S0 → S1, S0 → S2 and S0 → S3, only the last transition is observed. This is most probably due to the different geometries of the relaxed excited singlet states of the three singlet species, only that of S3 having an equilibrium geometry close to that of S0 state. Any transitions from S0 to S1 or S2 will be strongly blue-shifted compared to the corresponding energy differences between the equilibrium geometries of these states. Furthermore, they will be strongly broadened and depressed in peak intensity. In this case, the discrepancy between the results obtained and those obtained by Fron et al. for Ag3Na9-LTA should be attributed to the formation of expanded AgCLs in Ag3Na9-LTA, where a larger average number of Ag+-ions per cage is present.39
Conclusions
In summary, the photophysical properties of the AgLiNa-LTA system have been systematically investigated from the perspectives of environmental temperature and co-cation composition by a combination of stationary and time-resolved luminescence techniques. We have observed polychromatic emission for LTA zeolite confined AgCLs where the gradual increase of Li content leads to a simple emission shift from orange to blue with Δ ≈ 3157 cm−1 at 298 K and a less pronounced shift of the violet emission with Δ ≈ 2902 cm−1 at 77 K. Ag-zeolites also undergo a reversible thermochromism upon changing the environmental temperature from 298 K to 77 K leading to the emission color varying from orange to violet (e.g., Ag1Li6Na5-LTA). For the latter case, the steady-state temperature-dependent PL showed the presence of three main distinct emitting species which are each predominant in a different temperature range (Δ ≈ 8509 cm−1). The temperature-dependent time-resolved luminescence revealed that AgCLs' emission obtained upon excitation at 265 nm originates from three long-lived excited states with decay times ranging from a few tens to several hundreds of microseconds. The interconversion between these emitting states is thermally activated and accompanied by the possible geometric relaxation of AgCLs, and the corresponding long-lived species are the origin of the bright and colorful luminescence with high PLQYs. Moreover, the excited-state decay times decrease dramatically with the gradual incorporation of Li+ into Ag1-exchanged zeolites with Δτ ≈ 101 μs at 298 K and Δτ ≈ 22 μs at 77 K, which can be attributed to the formation of more compact AgCLs by strong guest–host–guest interactions. This work provides new insight into the excited-state behavior of Ag-zeolite materials and the proposed model unravelling the excited-state kinetics may thus lead to a better understanding of the photophysical properties of AgCLs encapsulated in other confining spaces. We also expect this research will open new avenues for the rational design of new applications for this promising class of materials.
Data availability
The data sets supporting this article have been uploaded as part of the ESI.†Author contributions
Conceptualization, funding acquisition: M. V. D. A., E. F., M. B. J. R. and J. H. Supervision: E. F. Investigation and methodology: L. S., M. K., G. R. and B. D. Formal analysis: L. S., M. K., J. H., E. F., M. B. J. R., M. V. D. A. Writing – original draft, visualization: L. S. Writing – review & editing: all authors.Conflicts of interest
There are no conflicts to declare.Acknowledgements
The authors are thankful for the financial support from the Flemish government through long-term structural funding Methusalem (CASAS2, Meth/15/04), the KU Leuven Research Fund (C14/19/079), the special research fund to E.F (ZKE0138), the Research Foundation-Flanders (FWO) through fellowships to M. K. (12Y6418N, G098319N and “Krediet aan Navorsers” 1514220N) and G. R. (11C6920N), and research projects to M. V. D. A. (G0F8217N and G082215N), J. H. (G098319N), the China Scholarship Council (CSC) through doctoral fellowship to L. S. (201808320355). We acknowledge Johan Martens for the help with element analysis.Notes and references
- S. Chen, R. S. Ingram, M. J. Hostetler, J. J. Pietron, R. W. Murray, T. G. Schaaff, J. T. Khoury, M. M. Alvarez and R. L. Whetten, Science, 1998, 280, 2098–2101 CrossRef CAS PubMed.
- L. Shang, S. Dong and G. U. Nienhaus, Nano Today, 2011, 6, 401–418 CrossRef CAS.
- M. Zhou, T. Higaki, Y. Li, C. Zeng, Q. Li, M. Y. Sfeir and R. Jin, J. Am. Chem. Soc., 2019, 141, 19754–19764 CrossRef CAS PubMed.
- M. Zhou, T. Higaki, G. Hu, M. Y. Sfeir, Y. Chen, D. E. Jiang and R. Jin, Science, 2019, 364, 279–282 CrossRef CAS PubMed.
- Q. Yao, T. Chen, X. Yuan and J. Xie, Acc. Chem. Res., 2018, 51, 1338–1348 CrossRef CAS PubMed.
- C. M. Aikens, Acc. Chem. Res., 2018, 51, 3065–3073 CrossRef CAS PubMed.
- Z. Lei, X.-K. Wan, S.-F. Yuan, Z.-J. Guan and Q.-M. Wang, Acc. Chem. Res., 2018, 51, 2465–2474 CrossRef CAS PubMed.
- S. Wang, Q. Li, X. Kang and M. Zhu, Acc. Chem. Res., 2018, 51, 2784–2792 CrossRef CAS PubMed.
- C. Wang, Y. Wang, L. Xu, D. Zhang, M. Liu, X. Li, H. Sun, Q. Lin and B. Yang, Small, 2012, 8, 3137–3142 CrossRef CAS PubMed.
- K. K. Chakrahari, R. P. B. Silalahi, T. H. Chiu, X. Wang, N. Azrou, S. Kahlal, Y. C. Liu, M. H. Chiang, J. Y. Saillard and C. W. Liu, Angew. Chem., Int. Ed., 2019, 58, 4943–4947 CrossRef CAS PubMed.
- K. Kennes, E. Coutino-Gonzalez, C. Martin, W. Baekelant, M. B. J. Roeffaers and M. Van der Auweraer, Adv. Funct. Mater., 2017, 27, 1606411 CrossRef.
- K. Kennes, C. Martin, W. Baekelant, E. Coutino-Gonzalez, E. Fron, M. B. J. Roeffaers, J. Hofkens and M. Van Der Auweraer, ACS Appl. Mater. Interfaces, 2019, 11, 12179–12183 CrossRef CAS PubMed.
- W. Baekelant, E. Coutino-Gonzalez, J. A. Steele, M. B. J. Roeffaers and J. Hofkens, ACS Energy Lett., 2017, 2, 2491–2497 CrossRef CAS.
- W. Baekelant, S. Aghakhani, E. Fron, C. Martin, C. Woong-Kim, J. A. Steele, T. De Baerdemaeker, F. D'Acapito, D. Chernysov, M. Van Der Auweraer, P. Lievens, D. Grandjean, M. Roeffaers, J. Hofkens and E. Coutino-Gonzalez, J. Mater. Chem. C, 2019, 7, 14366–14374 RSC.
- D. Yao, S. Xu, Y. Wang and H. Li, Mater. Chem. Front., 2019, 3, 1080–1084 RSC.
- Y. Yu, B. Y. L. Mok, X. J. Loh and Y. N. Tan, Adv. Healthcare Mater., 2016, 5, 1844–1859 CrossRef CAS PubMed.
- E. Coutino-Gonzalez, W. Baekelant, B. Dieu, M. B. J. Roeffaers and J. Hofkens, J. Visualized Exp., 2016, 2016, 3–9 Search PubMed.
- D. Yao, Y. Wang and H. Li, Sens. Actuators, B, 2020, 305, 127451 CrossRef CAS.
- E. Coutiño-Gonzalez, W. Baekelant, J. A. Steele, C. W. Kim, M. B. J. Roeffaers and J. Hofkens, Acc. Chem. Res., 2017, 50, 2353–2361 CrossRef PubMed.
- G. De Cremer, B. F. Sels, J. I. Hotta, M. B. J. Roeffaers, E. Bartholomeeusen, E. Coutiño-Gonzalez, V. Valtchev, D. E. De Vos, T. Vosch and J. Hofkens, Adv. Mater., 2010, 22, 957–960 CrossRef CAS PubMed.
- I. Díez, M. I. Kanyuk, A. P. Demchenko, A. Walther, H. Jiang, O. Ikkala and R. H. A. Ras, Nanoscale, 2012, 4, 4434–4437 RSC.
- C. I. Richards, S. Choi, J. C. Hsiang, Y. Antoku, T. Vosch, A. Bongiorno, Y. L. Tzeng and R. M. Dickson, J. Am. Chem. Soc., 2008, 130, 5038–5039 CrossRef CAS PubMed.
- J. Yu, S. A. Patel and R. M. Dickson, Angew. Chem., Int. Ed., 2007, 46, 2028–2030 CrossRef CAS PubMed.
- T. Vosch, Y. Antoku, J. C. Hsiang, C. I. Richards, J. I. Gonzalez and R. M. Dickson, Proc. Natl. Acad. Sci. U. S. A., 2007, 104, 12616–12621 CrossRef CAS PubMed.
- A. Simo, J. Polte, N. Pfänder, U. Vainio, F. Emmerling and K. Rademann, J. Am. Chem. Soc., 2012, 134, 18824–18833 CrossRef CAS PubMed.
- E. Coutino-Gonzalez, W. Baekelant, D. Grandjean, M. B. J. Roeffaers, E. Fron, M. S. Aghakhani, N. Bovet, M. Van Der Auweraer, P. Lievens, T. Vosch, B. Sels and J. Hofkens, J. Mater. Chem. C, 2015, 3, 11857–11867 RSC.
- O. Fenwick, E. Coutiño-Gonzalez, D. Grandjean, W. Baekelant, F. Richard, S. Bonacchi, D. De Vos, P. Lievens, M. Roeffaers, J. Hofkens and P. Samorì, Nat. Mater., 2016, 15, 1017–1022 CrossRef CAS PubMed.
- S. Aghakhani, D. Grandjean, W. Baekelant, E. Coutiño-Gonzalez, E. Fron, K. Kvashnina, M. B. J. Roeffaers, J. Hofkens, B. F. Sels and P. Lievens, Nanoscale, 2018, 10, 11467–11476 RSC.
- T. Sun and K. Seff, Chem. Rev., 1994, 94, 857–870 CrossRef CAS.
- E. Coutino-Gonzalez, D. Grandjean, M. Roeffaers, K. Kvashnina, E. Fron, B. Dieu, G. De Cremer, P. Lievens, B. Sels and J. Hofkens, Chem. Commun., 2014, 50, 1350–1352 RSC.
- G. De Cremer, Y. Antoku, M. B. J. Roeffaers, M. Sliwa, J. Van Noyen, S. Smout, J. Hofkens, D. E. De Vos, B. F. Sels and T. Vosch, Angew. Chem., Int. Ed., 2008, 47, 2813–2816 CrossRef CAS PubMed.
- D. Jonckheere, E. Coutino-Gonzalez, W. Baekelant, B. Bueken, H. Reinsch, I. Stassen, O. Fenwick, F. Richard, P. Samorì, R. Ameloot, J. Hofkens, M. B. J. Roeffaers and D. E. De Vos, J. Mater. Chem. C, 2016, 4, 4259–4268 RSC.
- W. Baekelant, S. Aghakhani, E. Coutino-Gonzalez, K. Kennes, F. D'Acapito, D. Grandjean, M. Van Der Auweraer, P. Lievens, M. B. J. Roeffaers, J. Hofkens and J. A. Steele, J. Phys. Chem. Lett., 2018, 9, 5344–5350 CrossRef CAS PubMed.
- S. Wu, X. Yang and C. Janiak, Angew. Chem., 2019, 131, 12468–12482 CrossRef.
- M. Quintanilla and L. M. Liz-Marzán, Science, 2018, 361, 645 CrossRef CAS PubMed.
- B. M. Weckhuysen, Nat. Mater., 2016, 15, 933–934 CrossRef CAS PubMed.
- G. De Cremer, E. Coutiño-Gonzalez, M. B. J. Roeffaers, B. Moens, J. Ollevier, M. Van Der Auweraer, R. Schoonheydt, P. A. Jacobs, F. C. De Schryver, J. Hofkens, D. E. De Vos, B. F. Sels and T. Vosch, J. Am. Chem. Soc., 2009, 131, 3049–3056 CrossRef CAS PubMed.
- H. Lin, K. Imakita, M. Fujii, V. Y. Prokof’ev, N. E. Gordina, B. Saïd and A. Galarneau, Nanoscale, 2015, 7, 15665–15671 RSC.
- E. Fron, S. Aghakhani, W. Baekelant, D. Grandjean, E. Coutino-Gonzalez, M. Van Der Auweraer, M. B. J. Roeffaers, P. Lievens and J. Hofkens, J. Phys. Chem. C, 2019, 123, 10630–10638 CrossRef CAS.
- G. Calzaferri, C. Leiggener, S. Glaus, D. Schürch and K. Kuge, Chem. Soc. Rev., 2003, 32, 29–37 RSC.
- W. Chen, A. G. Joly and J. Roark, Phys. Rev. B: Condens. Matter Mater. Phys., 2002, 65, 2454041–2454048 Search PubMed.
- D. Grandjean, E. Coutiño-Gonzalez, N. T. Cuong, E. Fron, W. Baekelant, S. Aghakhani, P. Schlexer, F. D'Acapito, D. Banerjee, M. B. J. Roeffaers, M. T. Nguyen, J. Hofkens and P. Lievens, Science, 2018, 361, 686–690 CrossRef CAS PubMed.
- B. Chan, Phys. Chem. Chem. Phys., 2021, 23, 1984–1993 RSC.
- N. T. Cuong, H. M. T. Nguyen, M. P. Pham-Ho and M. T. Nguyen, Phys. Chem. Chem. Phys., 2016, 18, 18128–18136 RSC.
- R. Gautier, C. Latouche, M. Paris and F. Massuyeau, Sci. Rep., 2017, 7, 1–6 CrossRef PubMed.
- X. Chen, X. Zhang and G. Zhang, Chem. Commun., 2015, 51, 161–163 RSC.
- A. Gafni, R. P. DeToma, R. E. Manrow and L. Brand, Biophys. J., 1977, 17, 155–168 CrossRef CAS.
- K. Jiang, Y. Wang, Z. Li and H. Lin, Mater. Chem. Front., 2020, 4, 386–399 RSC.
Footnote |
| † Electronic supplementary information (ESI) available: Experimental details, some auxiliary characterization results, and additional discussion. See https://doi.org/10.1039/d2sc03197c |
| This journal is © The Royal Society of Chemistry 2022 |