 Open Access Article
Solid-solution reaction suppresses the Jahn–Teller effect of potassium manganese hexacyanoferrate in potassium-ion batteries†
Bingqiu
Liu
,
Qi
Zhang
,
Usman
Ali
,
Yiqian
Li
,
Yuehan
Hao
,
Lingyu
Zhang
 ,
Zhongmin
Su
 ,
Lu
Li
 * and
Chungang
Wang
 *
*
Faculty of Chemistry, Northeast Normal University, Changchun, 130024, P. R. China. E-mail: wangcg925@nenu.edu.cn; lil106@nenu.edu.cn
First published on 27th August 2022
Abstract
Potassium manganese hexacyanoferrate (KMnHCF) suffers from poor cycling stability in potassium-ion batteries due to the Jahn–Teller effect, and experiences destabilizing asymmetric expansions and contractions during cycling. Herein, hollow nanospheres consisting of ultrasmall KMnHCF nanocube subunits (KMnHCF-S) are developed by a facile strategy. In situ XRD analysis demonstrates that the traditional phase transition for KMnHCF is replaced by a single-phase solid-solution reaction for KMnHCF-S, which effectively suppresses the Jahn–Teller effect. From DFT calculations, it was found that the calculated reaction energy for K+ extraction in the solid-solution reaction is much lower than that in the phase transition, indicating easier K+ extraction during the solid-solution reaction. KMnHCF-S delivers high capacity, outstanding rate capability, and superior cycling performance. Impressively, the K-ion full cell composed of the KMnHCF-S cathode and graphite anode also displays excellent cycling stability. The solid-solution reaction not only suppresses the Jahn–Teller effect of KMnHCF-S but also provides a strategy to enhance the electrochemical performance of other electrodes which undergo phase transitions.
Introduction
Nowadays, lithium-ion batteries (LIBs) cannot meet the low-cost requirements of ever-increasing large-scale applications because of the limited and nonuniform distribution of lithium resources, which makes LIBs face the issue of unsustainability.1–4 Therefore, sodium-ion batteries (SIBs) and potassium-ion batteries (PIBs) with similar features to LIBs but lower cost and earth-abundance emerged as the times require. Compared with SIBs, PIBs are expected to exhibit higher energy density, better rate performance, and more opportunities to achieve practical application due to some advantages: (1) PIBs possess lower redox potential (−2.93 V vs. SHE) than SIBs (−2.71 V vs. SHE), leading to high operating voltages of PIBs. (2) PIBs display fast ionic diffusion owing to the smaller Stokes radius and weaker Lewis acidity of K-ions, and exhibit superior rate capability. (3) K-ions can reversibly insert/extract in/from the graphite anode with a theoretical capacity of 274 mA h g−1, which is beneficial for practical application.5–8Since graphite can be directly used as the anode, it is crucial to explore suitable cathodes with satisfactory electrochemical performance for PIBs. Among various reported cathode materials, Prussian blue analogues (PBAs) gain much attention due to their 3D open framework, which can reversibly store large K-ions.9–11 Moreover, PBAs are fabricated by facile methods and abundant elements, significantly reducing the cost.12–14 In the family of PBAs, potassium-rich manganese hexacyanoferrate (KMnHCF) with the highest operating voltage and largest capacity is a promising cathode for PIBs.15–18 For example, Deng et al. reported defect-free KMnHCF with ethylenediaminetetraacetic acid dipotassium salt as the chelating agent, which exhibits a high capacity of 136.7 mA h g−1 at 0.03 A g−1.19 However, KMnHCF reported so far still suffers from poor cycle stability because of the phase transition caused by the Jahn–Teller effect, which gradually but continuously breaks the lattice of KMnHCF during the charge/discharge process.20 At present, there is almost no effective approach to suppress the Jahn–Teller effect of KMnHCF in PIBs.
The solid-solution reaction (single-phase reaction pathway) becomes the most effective strategy to suppress the Jahn–Teller effect because it exempts the formation of a two-phase interface as well as the coherency strain.21,22 Moreover, the solid-solution reaction forms solid-solutions in which the intermediate potassium content changes between the equilibrium potassium-rich phase and potassium-poor phase, which is beneficial for stabilizing the whole structure upon cycling.23–25 For instance, Xiao et al. reported K0.5Mn0.6Co0.2Fe0.1Mg0.1O2 as a cathode for PIBs with outstanding cycling stability, which replaced phase transition from P3 to O3 by the solid-solution reaction and completely inhibited the Jahn–Teller effect.26 Furthermore, the solid-solution reaction also exhibits an extremely tiny volume change upon cycling and supports a fast K+ diffusion process, leading to long cycling life and high rate performance.27 For example, a complete solid-solution reaction in the P2-Na0.75Ca0.05Li0.15Fe0.2Mn0.6O2 cathode for SIBs was realized by Wang et al. with outstanding rate performance and only 1.45% volume variation during cycling, which is almost equivalent to that of a zero-strain material.28 Qi et al. improved the structure durability of Fe- and Mn-based cathodes through the solid-solution reaction, which experienced an ultralow volume variation of 0.7% during the charging/discharging process and delivered fabulous rate capability.29 Although solid-solution reaction has been successfully applied to many electrodes to improve the electrochemical performance significantly; it is rarely employed for the KMnHCF cathode in PIBs. We hypothesize that if the solid-solution reaction can be induced into KMnHCF, it will alleviate volume change and fundamentally suppress the Jahn–Teller effect of KMnHCF to achieve long-life cycling performance. Nevertheless, many researchers have tried a number of strategies but still cannot achieve a solid-solution reaction. Thus, realizing the solid-solution reaction of KMnHCF to suppress the Jahn–Teller effect is of great importance for the development of KMnHCF in PIBs.
In this work, we employ a facile strategy to synthesize hollow nanospheres consisting of ultrasmall KMnHCF nanocube subunits, which display a primary size of around 9 nm (named KMnHCF-S). Benefiting from the ultrasmall size, KMnHCF-S reveals a solid-solution reaction instead of phase transition during the charging/discharging process, leading to high capacity (141.3 mA h g−1 at 0.02 A g−1), excellent rate capability (78.7, 61.8, and 50.7 mA h g−1 at 1, 2 and 3 A g−1), and unprecedented cycling performance (capacity retention of 93.3% at 0.05 A g−1 after 200 cycles and 91.9% at 0.1 A g−1 after 1000 cycles). Furthermore, the K-ion full cell composed of the KMnHCF-S cathode and graphite anode exhibits superior cycling stability (capacity retention of 91.1% at 0.05 A g−1 after 500 cycles and 90.2% at 0.1 A g−1 after 1500 cycles). The superior cycling stability is mainly attributed to the efficient suppression of the Jahn–Teller effect by the solid-solution reaction. And the outstanding rate performance is due to the simplification of the phase boundary caused by the solid-solution reaction, which realizes fast K-ion diffusion and a low diffusion barrier, and significantly improves the K-ion migration kinetics.
Results and discussion
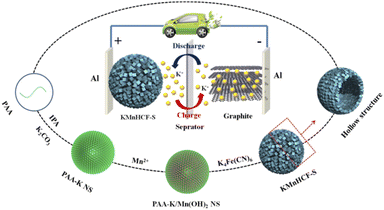
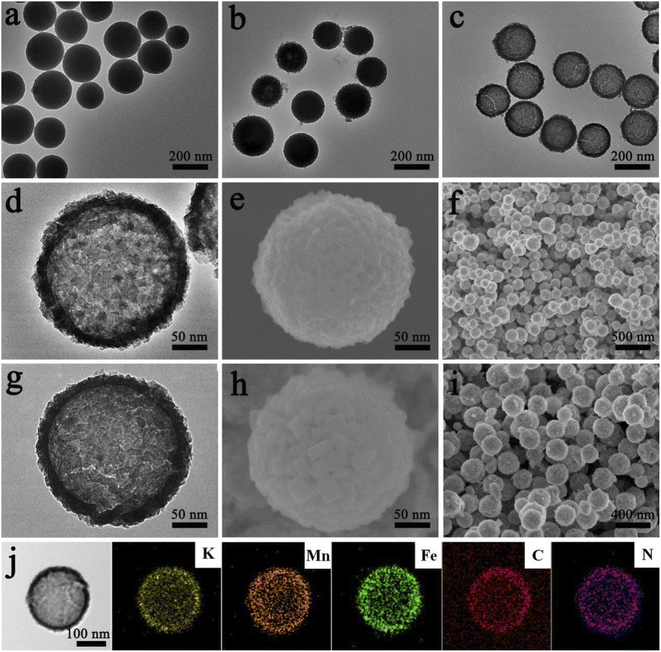
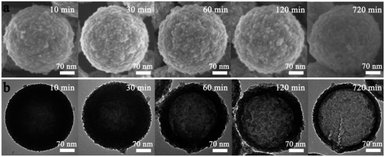
The chemical formulae of KMnHCF-S, KMnHCF-M, and KMnHCF-L were calculated to be K1.98Mn[Fe(CN)6]0.98·0.27H2O, K1.92Mn[Fe(CN)6]0.95·0.36H2O and K1.96Mn[Fe(CN)6]0.94·0.43H2O according to ICP-AES (Tables S1–S3, ESI†), the TG results (Fig. S1, ESI†) and EDX spectra (Fig. S2 and S3, ESI†), indicating that KMnHCF-S possesses the fewest defects and coordinated water molecules among the three samples. Scheme 1 illustrates the fabrication process of KMnHCF-S. First, polyacrylic acid (PAA), K2CO3, and isopropyl alcohol (IPA) were added into deionized water to form PAA-K nanospheres (NSs). After adding MnCl2·4H2O, Mn(OH)2 was formed on the network of PAA-K NSs. Finally, KMnHCF-S was afforded by reacting the previous product with K4Fe(CN)6. The morphologies of the three samples were determined using a transmission electron microscope (TEM) and scanning electron microscope (SEM), as shown in Fig. 1. Fig. 1a exhibits the TEM image of PAA-K nanospheres (NSs) with a size of 150 nm. Then, Mn2+ was added into the solution to form PAA-K/Mn(OH)2 NSs (Fig. 1b). After reacting with K4Fe(CN)6·3H2O, PAA-K/Mn(OH)2 NSs are converted to KMnHCF-S with a uniform size (Fig. 1c). Fig. 1d shows the high-resolution TEM (HRTEM) image of a single KMnHCF-S NS. It can be observed that the morphology of KMnHCF-S remains spherical, but the inside becomes hollow, and the surface becomes rough. The SEM images of KMnHCF-S in Fig. 1e and f show that the KMnHCF-S NSs are composed of many ultrasmall nanocube subunits with a diameter of ca. 9 nm. KMnHCF-M was synthesized by just changing PAA-K to PAA-NH4, and the morphology is displayed in Fig. S4 (ESI†) and Fig. 1g–i. KMnHCF-M is also hollow and consists of many small nanocube subunits. However, the size of nanocube subunits on KMnHCF-M (∼20 nm) is larger than that of KMnHCF-S (∼9 nm). KMnHCF-L was synthesized by a simple method,30 and the size of KMnHCF-L (90–120 nm) is much larger than that of the other two samples, as shown in Fig. S5 (ESI†). The elemental mapping images of a single KMnHCF-S NS and KMnHCF-M NS are shown in Fig. 1j and S4d (ESI†), respectively, which confirms the chemical composition of K, Mn, Fe, C, and N elements in both samples.Fig. 2 schematically illustrates the surface change and hollow structural evolution of KMnHCF-S from the solid PAA-K/Mn(OH)2 NSs. SEM and HRTEM are used to check the intermediates collected at different time stages. The surface changes from little points to ultrasmall nanocubes as time passes (Fig. 2a–e). And the structural changes from solid PAA-K/Mn(OH)2 NSs to hollow PBA NSs involve several stages (Fig. 2f and g). When time increases, the internal cavity gradually becomes more prominent. This phenomenon can be attributed to the nanoscale Kirkendall diffusion, in which the diffusion of the Mn component occurs from the inside to the surface to form a hollow structure.31
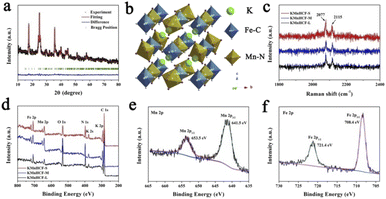
The refined X-ray diffraction (XRD) patterns of KMnHCF-S (Fig. 3a), KMnHCF-M (Fig. S6, ESI†), and KMnHCF-L (Fig. S7, ESI†) can be well indexed as the monoclinic phase with the P21/n space group. The detailed refinement results of the three samples are displayed in Tables S4–S6 (ESI†), and the corresponding crystal structure is shown in Fig. 3b. The open framework structure with C-coordinated Fe and N-coordinated Mn cations provides large diffusion tunnels for K+. The estimated crystallite sizes of KMnHCF-S, KMnHCF-M, and KMnHCF-L are 8, 20, and 116 nm using Scherrer's equation from the XRD results, respectively, which match well with the results of TEM and SEM. Fig. 3c shows the Raman spectra of KMnHCF-S, KMnHCF-M, and KMnHCF-L. The cyanide vibration stretching bands can be observed at 2077 and 2115 cm−1, respectively. The intensity of these two peaks determines the content of K ions.32 According to the increased intensity of the peaks, it can be speculated that the numbers of K-ions in KMnHCF-S are the highest among the three samples.32 To analyze the surface composition of samples, X-ray photoelectron spectroscopy (XPS) was conducted, as shown in Fig. 3d. The survey spectra exhibit the elements of K, Mn, Fe, C, N, and O in all samples. The high-resolution Mn 2p spectrum indicates that the binding energies of 653.5 and 641.5 eV can be assigned to Mn2+ 2p1/2 and Mn2+ 2p3/2, respectively (Fig. 3e). The bands at 721.4 and 708.4 eV in the high-resolution Fe 2p spectrum are associated with Fe2+ 2p1/2 and Fe2+ 2p3/2, respectively, demonstrating that Fe-ions are divalent (Fig. 3f).33–35 The high-resolution Mn 2p and Fe 2p spectra of KMnHCF-M and KMnHCF-L are displayed in Fig. S8 (ESI†).
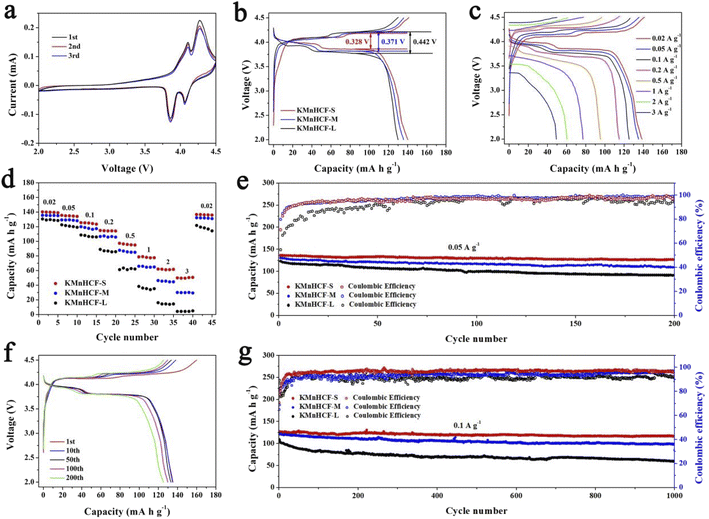
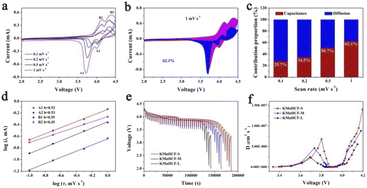
The cyclic voltammograms (CVs) of the initial three cycles for KMnHCF-S at 0.1 mV s−1 are shown in Fig. 4a. Two pairs of peaks at 3.85/4.09 V and 4.06/4.26 V can be attributed to the oxidation/reduction of Fe2+/Fe3+ and Mn2+/Mn3+, respectively.19Fig. 4b displays the charge/discharge curves with two voltage plateaus of all three samples at 0.02 A g−1, which are in accordance with the CV results. The discharge capacity of KMnHCF-S is 141.3 mA h g−1, which is higher than that of KMnHCF-M (135.9 mA h g−1) and KMnHCF-L (130.1 mA h g−1). Moreover, the polarization of KMnHCF-S was smaller than that of KMnHCF-M and KMnHCF-L. Compared with the CV and charge/discharge curves of the three samples in Fig. 4a and b and S9 (ESI†), KMnHCF-S exhibits the best electrochemical performance. Besides the highest capacity and lowest polarization, KMnHCF-S also shows the best rate performance among the three samples (Fig. 4c and d). KMnHCF-S delivers high discharge capacities of 140.2, 135.5, 125.5, 114.8, 97.3, 78.7, 61.8, and 50.7 mA h g−1 at current densities of 0.02, 0.05, 0.1, 0.2, 0.5, 1, 2 and 3 A g−1, respectively. When the current density goes back to 0.02 A g−1, the capacity recovers to 136.7 mA h g−1, suggesting the robust structural stability of KMnHCF-S. The excellent rate performance of KMnHCF-S can be attributed to the ultrafine size of KMnHCF, which reduces the K+ diffusion pathway. The long cycling stability of the three samples was further tested at 0.05 A g−1 for 200 cycles (Fig. 4e). KMnHCF-S provides a reversible capacity of 126.6 mA h g−1 (93.3%) after 200 cycles, much higher than 109.2 (KMnHCF-M) and 90.7 mA h g−1 (KMnHCF-L). Furthermore, we have also tested the superb long cycling stability of the three samples at 100 mA g−1. KMnHCF-S can deliver a reversible capacity of 114.2 mA h g−1 with a capacity retention of 91.9% after 1000 cycles compared with much lower retentions of 81.9% and 54.7% for KMnHCF-M and KMnHCF-L (Fig. 4f and g). The cycling performance of KMnHCF-S at high current density was also probed, as shown in Fig. S10a and b (ESI†). After 1000 cycles, KMnHCF-S remains 101.2 and 65.7 mA h g−1 at 0.2 and 0.5 A g−1, corresponding to a capacity retention of 87.5% and 64.5%, respectively. Impressively, KMnHCF-S with improved operating voltage exhibits excellent energy density (Fig. S11, ESI†). The electrode displays 475.2 W h kg−1 at 0.05 A g−1 after 200 cycles, which is very close to 500 W h kg−1. Moreover, KMnHCF-S can also deliver 423.6, 372.2 and 236.1 W h kg−1 even after 1000 cycles at 0.1, 0.2 and 0.5 A g−1, respectively. The oxidation stability of the electrolyte has been evaluated by linear sweep voltammetry (LSV) on K‖stainless-steel cells. As shown in Fig. S12 (ESI†), the oxidation of the electrolyte starts at ∼4.7 V, indicating that the electrolyte is suitable for KMnHCF operating at high voltage. The electrochemical kinetics of KMnHCF-S for excellent rate performance is further probed by several techniques (Fig. 5). Fig. 5a exhibits the CV curves of KMnHCF-S from 0.1 to 1 mV s−1. The pseudocapacitive percentage compared with K+ diffusion can be calculated using the following equation:36
| i = k1v + k2v1/2 | (1) |
| i/v1/2 = k1v1/2 + k2 | (2) |
| i = avb | (3) |
Here, i is the peak current, a and b are adjustable parameters, and v is the scan rate. The b-values are calculated to be around 0.5, indicating that the ion-diffusion behavior controls the kinetics of the KMnHCF-S electrode (Fig. 5d). The galvanostatic intermittent titration technique (GITT) is also performed to probe the ion diffusion kinetics of K+ at 0.1 A g−1 in Fig. 5e. As shown in Fig. 5f, either in the high or low voltage plateau region, KMnHCF-S exhibits the highest K-ion diffusion coefficient (DK+) of 1.4 × 10⁻⁷ and 6.8 × 10⁻⁸ cm2 s−1, respectively, compared with KMnHCF-M (8.8 × 10⁻⁸ and 4.6 × 10⁻⁸ cm2 s−1) and KMnHCF-L (5.6 × 10⁻⁸ and 2.4 × 10⁻⁸ cm2 s−1). The fast ionic transport kinetics of KMnHCF-S is attributed to the ultrafine size of PBA, which significantly decreases the K-ion diffusion pathway. Electrochemical impedance spectroscopy (EIS) of three samples was conducted after 200 cycles at 0.05 A g−1 (Fig. S13, ESI†). The charge-transfer resistance value of KMnHCF-S is obviously lower than those of KMnHCF-M and KMnHCF-L, demonstrating improved K-ion diffusion paths and excellent electron mobility.
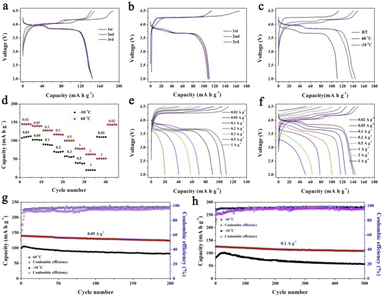
The PIB performances at high/low temperatures are very important in determining the practical applications under various conditions. Therefore, we have performed the high/low-temperature measurements at 60 and −10 °C, as shown in Fig. 6. Fig. 6a and b exhibit the charge/discharge curves at 0.02 A g−1 at 60 and −10 °C, respectively. KMnHCF-S delivers a high capacity of 144.9 mA h g−1 at 60 °C, which is even higher than that at room temperature (RT). And a capacity of 110.4 mA h g−1 is obtained at −10 °C. Fig. 6c shows the charge/discharge curves at different temperatures, and the polarization at 60 °C is even smaller than that at RT. We have further tested the rate performance of KMnHCF-S at 60 and −10 °C. As displayed in Fig. 6d, the electrode exhibits high discharge capacities of 145.2 mA h g−1 and 112.1 mA h g−1 at 0.02 A g−1 at 60 and −10 °C. The capacities of the KMnHCF-S electrode slightly decrease to 140.1 and 127.8 mA h g−1 at 0.05 and 0.1 A g−1 at 60 °C, and 102.7 and 89.6 mA h g−1 at 0.05 and 0.1 A g−1 at −10 °C with the increase of the rate, respectively. Even at 3 A g−1, KMnHCF-S still delivers 51.5 mA h g−1 at 60 °C. Fig. 6e and f exhibit the charge/discharge curves of KMnHCF-S with satisfactory charge/discharge voltage plateaus at both 60 and −10 °C. Furthermore, long cycle performance was also probed at 0.05 and 0.1 A g−1 for both 60 and −10 °C (Fig. 6g and h). KMnHCF-S maintains 124.6 and 81.6 mA h g−1 at 0.05 A g−1 at 60 and −10 °C after 200 cycles, corresponding to 89.1% and 81.5% capacity retention. Surprisingly, even at a high current density of 0.1 A g−1, KMnHCF-S still delivers 126.1 and 82.9 mA h g−1 in the first cycle with excellent capacity retentions of 86.4% and 70.1% at 60 and −10 °C after 500 cycles. The slightly increased discharge capacity in the initial few cycles is probably attributed to the thermal effects, where heat might be generated owing to the increase in cell resistance during the charging/discharging process.38 The high capacity at both 60 and −10 °C can be ascribed to the ultrasmall KMnHCF subunits, which increase the electrode/electrolyte contact area and reduce the ion diffusion distance.
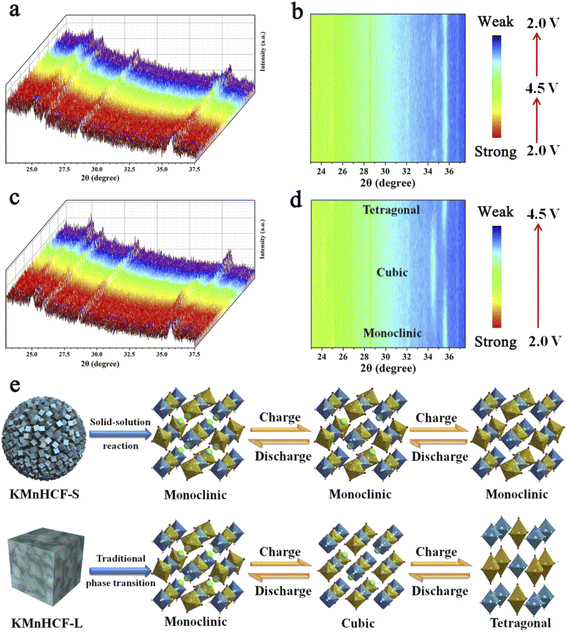
To explore the structure evolution of different sizes of KMnHCF during the charging/discharging process, an in situ XRD test at a current density of 0.02 A g−1 in a voltage range between 2.0 and 4.5 V is conducted (Fig. 7). It can be clearly seen that reversible phase transitions for the KMnHCF-L electrode with a new group of peaks (2θ = 24.1, 34.4°) corresponding to the cubic structure appear at the expense of the peaks (2θ = 24.9, 35.5°). After further charging to the end, the cubic phase completely transforms into a tetragonal structure (Fig. 7c and d). The in situ XRD result of KMnHCF-M is similar to that of KMnHCF-L, which undergoes a phase transition (Fig. S14, ESI†). The phase transition is caused by the Jahn–Teller effect, which is considered to deteriorate the electrochemical performance of electrode materials, resulting in fast capacity decay. This is why KMnHCF-L exhibited poor cycling stability. In contrast to KMnHCF-L, the in situ XRD pattern of KMnHCF-S displays a complete solid-solution reaction with no phase transition (Fig. 7a and b). The individual XRD results for the samples in various states-of-charge are provided in Fig. S15 (ESI†), which clearly exhibits a solid-solution reaction for KMnHCF-S during the charging/discharging process. Furthermore, there is almost no change in the lattice parameters for the solid-solution reaction, indicating the excellent stability of KMnHCF-S. The solid-solution reaction avoids the formation and migration of a two-phase interface, as well as the associated coherency strain, which is generally believed to be responsible for good structural stability and high-rate performances. Since the Jahn–Teller effect results in a phase transition, the solid-solution reaction can effectively suppress the Jahn–Teller effect by a single-phase reaction (Fig. 7e). So KMnHCF-S displays much better cycling performance than previously reported KMnHCF. The unique solid-solution reaction could be due to the ultrasmall KMnHCF subunits (9 nm) on the nanosphere, as reported in LiFePO4, Na3(VOPO4)2F, and TiO2.22,39–41
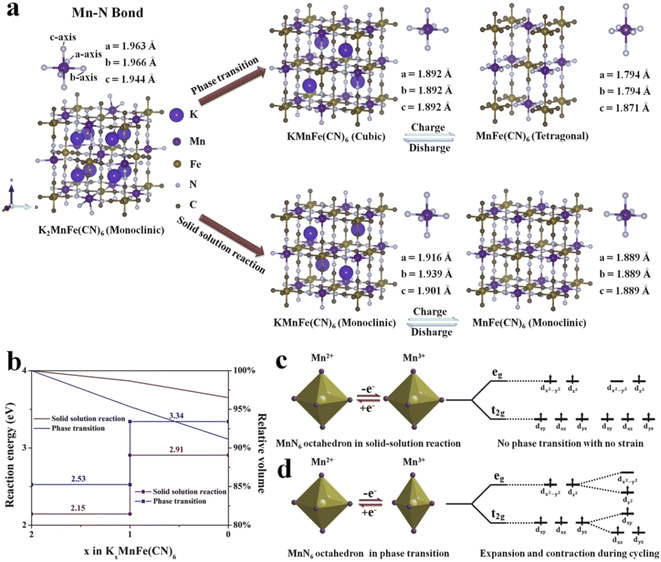
To further clarify the different potassium storage mechanisms, we performed first-principles calculations on the structural changes of the solid-solution reaction and traditional phase transition upon the K+ insertion/extraction process. As shown in Fig. 8a, for the phase transition process, the predicted Mn–N bond length displays −5.2% shrinkage for the four equatorial Mn–N bonds and +1.1% elongation for the two axial Mn–N bonds from a cubic phase to a tetragonal phase, which is mainly caused by the Jahn–Teller effect (Table S7, ESI†). In contrast, during the solid-solution reaction, the average Mn–N bond length changes only 2.0% and 1.2% in the two reaction steps (Table S8, ESI†), suggesting that the solid-solution reaction successfully suppresses the Jahn–Teller effect. The cell volume during the K+ insertion/extract process was also calculated (Fig. 8b). The cell can remain at 96.5% of its original volume in the solid-solution reaction. It is much higher than that in the phase transition (91.1%). The above results shed light on the reason for the unprecedented cycling performance of KMnHCF-S, which experiences a solid-solution reaction. Moreover, we have calculated the reaction energy of two different reaction processes (Fig. 8b). The calculated reaction energy for K+ extraction in the solid-solution reaction is much lower than that in the phase transition. This indicates that K+ is much easier to extract during the solid-solution reaction, leading to excellent rate capability. Generally, Mn 3d electronic orbitals involve two types: eg (dx2–y2 and dz2) and t2g (dxy, dxz and dyz) for MnN6 octahedra. During cycling, the eg orbitals of the Mn2+ split into two orbitals of unoccupied dx2–y2 and occupied dz2 near the Fermi level.42 As shown in Fig. 8d, the Jahn–Teller effect shows that only four equatorial Mn–N bonds contract.43 And these octahedra suffer from destabilizing asymmetric expansions and contractions during cycling, resulting in the structure being broken. For KMnHCF-S, it experiences a solid-solution reaction during the charge/discharge process with no strain and avoids splitting of the eg and t2g orbitals of the Mn2+, thus suppressing the associated Jahn–Teller distortion (Fig. 8c).
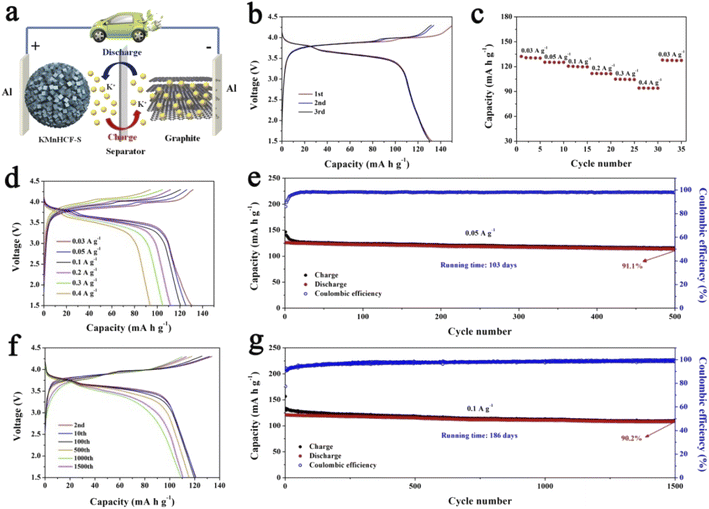
For practical application of the KMnHCF-S cathode in PIBs, a potassium-ion full cell with the KMnHCF-S cathode and graphite anode is fabricated (Fig. 9a). The charge/discharge curves and cycling performance of graphite are shown in Fig. S16 (ESI†). Before fabricating the full cell, the graphite anode was potassiated to avoid the irreversible capacity in the first cycle and provide enough K+ between the anode and cathode. The full cell delivers a high discharge capacity of 132.4 mA h g−1 at 0.03 A g−1 within a potential window of 1.5 and 4.3 V (Fig. 9b). The average discharge voltage is about 3.62 V, corresponding to a high energy density of 479.3 W h kg−1 (based on the mass of the cathode). Moreover, the discharge profiles of the initial three cycles are highly coincident, suggesting the excellent reversibility of the full cell. Fig. 9c and d exhibit the rate capability of the full cell, which displays 130.5, 125.3, 120.6, 111.8, 104.9, and 94.1 mA h g−1 at 0.03, 0.05, 0.1, 0.2, 0.3, and 0.4 A g−1, respectively. To investigate the most important factor affecting the practical application of the KMnHCF full cell, cycling performance was tested at 0.05 and 0.1 A g−1. As shown in Fig. 9e, the full cell exhibits unprecedented cycling stability with a high capacity retention of 91.1% after 500 cycles (running time of over 103 days). The full cell also shows excellent cycling stability with a capacity retention of 90.2% after 1500 cycles (running time of over 186 days) at 0.1 A g−1 (Fig. 9g). Fig. 9f displays the corresponding voltage curves at various current densities, revealing the highly reversible charging/discharging process in the full cell.
Conclusions
In summary, we developed KMnHCF nanospheres composed of ultrasmall KMnHCF nanocube subunits (9 nm). The KMnHCF-S cathode achieves a solid-solution reaction with no phase transition, which effectively suppresses the Jahn–Teller effect during the charging/discharging process, compared with the traditional three phase transition displayed by KMnHCF-L. Due to the solid-solution reaction, the KMnHCF-S electrode shows superior cycling stability (capacity retention of 93.3% at 0.05 A g−1 after 200 cycles and 91.9% at 0.1 A g−1 after 1000 cycles) and excellent rate performance (78.7, 61.8, and 50.7 mA h g−1 at 1, 2 and 3 A g−1). More encouragingly, the KMnHCF-S//graphite full-cell delivered a high capacity of 132.4 mA h g−1 at 0.03 A g−1 with a high energy density of 479.3 W h kg−1 and almost negligible capacity decay at 0.05 and 0.1 A g−1 for 500 and 1500 cycles. The solid-solution reaction realized by ultrasmall KMnHCF nanocube subunits not only provides a new strategy to suppress the Jahn–Teller effect of other manganese-based electrode materials but also enhances the electrochemical performance of other electrodes which undergo phase transitions.Data availability
All experimental and computational data associated with this article are available in the main text and ESI.†Author contributions
B. Q. L. and Q. Z. carried out the experiments. B. Q. L., Q. Z., Y. Q. L., Y. H. H., U. A., L. L., L. Y. Z., C. G. W., and Z. M. S. analyzed and discussed the data. B. Q. L. and Q. Z. wrote the manuscript with help from all of the co-authors.Conflicts of interest
There are no conflicts to declare.Acknowledgements
This work was supported by the National Natural Science Foundation of China (Grant No. 22172023 and 21872024), the Education Department of Jilin Province “13th Five-Year” Science and Technology Research (JJKH20190270KJ and JJKH20190272KJ), the Jilin Provincial Research Foundation for Basic Research (20200201071JC and 20190303100SF), the Fundamental Research Funds for the Central Universities (2412022QD006) and Jilin Provincial Key Laboratory of Advanced Energy Materials.Notes and references
- B. Liu, Q. Zhang, Z. Jin, L. Zhang, L. Li, Z. Gao, C. Wang, H. Xie and Z. Su, Adv. Energy Mater., 2018, 8, 1702347 CrossRef.
- F. Wu, H. Wang, J. Shi, Z. Yan, S. Song, B. Peng, X. Zhang and Y. Xiang, ACS Appl. Mater. Interfaces, 2018, 10, 19639–19648 CrossRef CAS PubMed.
- B. Liu, Q. Zhang, L. Li, Z. Jin, C. Wang, L. Zhang and Z.-M. Su, ACS Nano, 2019, 13, 13513–13523 CrossRef CAS PubMed.
- K. Wang, F. Zhang, G. Zhu, H. Zhang, Y. Zhao, L. She and J. Yang, ACS Appl. Mater. Interfaces, 2019, 11, 33082–33090 CrossRef CAS PubMed.
- R. Rajagopalan, Y. Tang, X. Ji, C. Jia and H. Wang, Adv. Funct. Mater., 2020, 30, 1909486 CrossRef CAS.
- M. Sha, L. Liu, H. Zhao and Y. Lei, Energy Environ. Mater., 2020, 3, 56–66 CrossRef CAS.
- Z. Wu, J. Zou, S. Chen, X. Niu, J. Liu and L. Wang, J. Power Sources, 2021, 484, 229307 CrossRef CAS.
- H. Kim, H. Ji, J. Wang and G. Ceder, Trends Chem., 2019, 1, 682–692 CrossRef CAS.
- A. Zhou, W. Cheng, W. Wang, Q. Zhao, J. Xie, W. Zhang, H. Gao, L. Xue and J. Li, Adv. Energy Mater., 2021, 11, 2000943 CrossRef CAS.
- Y. Xia, W. Jin, Y. Qi, H. Li, Z. Jian and W. Chen, Chin. Chem. Lett., 2021, 32, 2433–2437 CrossRef CAS.
- L. Li, Z. Hu, Y. Lu, C. Wang, Q. Zhang, S. Zhao, J. Peng, K. Zhang, S.-L. Chou and J. Chen, Angew. Chem., Int. Ed., 2021, 60, 13050–13056 CrossRef CAS PubMed.
- S. Chong, Y. Wu, S. Guo, Y. Liu and G. Cao, Energy Storage Mater., 2019, 22, 120–127 CrossRef.
- C. Zhang, Y. Xu, M. Zhou, L. Liang, H. Dong, M. Wu, Y. Yang and Y. Lei, Adv. Funct. Mater., 2017, 27, 1604307 CrossRef.
- W.-J. Li, C. Han, G. Cheng, S.-L. Chou, H.-K. Liu and S.-X. Dou, Small, 2019, 15, 1900470 CrossRef PubMed.
- J. Zhang, L. Deng, M. Feng, L. Zeng, M. Hu and Y. Zhu, Chem. Commun., 2021, 57, 8632–8635 RSC.
- T. Hosaka, T. Fukabori, H. Kojima, K. Kubota and S. Komaba, Chemsuschem, 2021, 14, 1166–1175 CrossRef CAS PubMed.
- L. Xue, Y. Li, H. Gao, W. Zhou, X. Lu, W. Kaveevivitchai, A. Manthiram and J. B. Goodenough, J. Am. Chem. Soc., 2017, 139, 2164–2167 CrossRef CAS PubMed.
- X. Wu, S. Qiu, Y. Liu, Y. Xu, Z. Jian, J. Yang, X. Ji and J. Liu, Adv. Mater., 2022, 34, 2106876 CrossRef CAS PubMed.
- L. Deng, J. Qu, X. Niu, J. Liu, J. Zhang, Y. Hong, M. Feng, J. Wang, M. Hu, L. Zeng, Q. Zhang, L. Guo and Y. Zhu, Nat. Commun., 2021, 12, 2167 CrossRef CAS PubMed.
- X. Bie, K. Kubota, T. Hosaka, K. Chihara and S. Komaba, J. Mater. Chem. A, 2017, 5, 4325–4330 RSC.
- B. Liu, Q. Zhang, Y. Li, Y. Hao, U. Ali, L. Li, L. Zhang, C. Wang and Z. Su, CCS Chem., 2022 DOI:10.31635/ccschem.31022.202201776 , Just Published..
- L. Zhong, Y. Liu, W.-Q. Han, J. Y. Huang and S. X. Mao, Adv. Mater., 2017, 29, 1700236 CrossRef PubMed.
- D. K. Lee, S. C. Han, D. Ahn, S. P. Singh, K.-S. Sohn and M. Pyo, ACS Appl. Mater. Interfaces, 2012, 4, 6842–6848 CrossRef CAS PubMed.
- G. Liang, V. K. Peterson, Z. Wu, S. Zhang, J. Hao, C.-Z. Lu, C.-H. Chuang, J.-F. Lee, J. Liu, G. Leniec, S. M. Kaczmarek, A. M. D'Angelo, B. Johannessen, L. Thomsen, W. K. Pang and Z. Guo, Adv. Mater., 2021, 33, 2101413 CrossRef CAS PubMed.
- G. Liang, Z. Wu, C. Didier, W. Zhang, J. Cuan, B. Li, K.-Y. Ko, P.-Y. Hung, C.-Z. Lu, Y. Chen, G. Leniec, S. M. Kaczmarek, B. Johannessen, L. Thomsen, V. K. Peterson, W. K. Pang and Z. Guo, Angew. Chem., Int. Ed., 2020, 59, 10594–10602 CrossRef CAS PubMed.
- Z. Xiao, F. Xia, L. Xu, X. Wang, J. Meng, H. Wang, X. Zhang, L. Geng, J. Wu and L. Mai, Adv. Funct. Mater., 2021, 2108244 Search PubMed.
- K. Zaghib, J. B. Goodenough, A. Mauger and C. Julien, J. Power Sources, 2009, 194, 1021–1023 CrossRef CAS.
- Y. Wang, X. Zhao, J. Jin, Q. Shen, N. Zhang, X. Qu, Y. Liu and L. Jiao, Energy Storage Mater., 2022, 47, 44–50 CrossRef.
- R. Qi, M. Chu, W. Zhao, Z. Chen, L. Liao, S. Zheng, X. Chen, L. Xie, T. Liu, Y. Ren, L. Jin, K. Amine, F. Pan and Y. Xiao, Nano Energy, 2021, 88, 106206 CrossRef CAS.
- L. Jiang, Y. Lu, C. Zhao, L. Liu, J. Zhang, Q. Zhang, X. Shen, J. Zhao, X. Yu, H. Li, X. Huang, L. Chen and Y.-S. Hu, Nat. Energy, 2019, 4, 495–503 CrossRef CAS.
- J. S. Cho, J. K. Lee and Y. C. Kang, Sci. Rep., 2016, 6, 23699 CrossRef CAS PubMed.
- Y. Huang, M. Xie, Z. Wang, Y. Jiang, Y. Yao, S. Li, Z. Li, L. Li, F. Wu and R. Chen, Small, 2018, 14, 1801246 CrossRef PubMed.
- S. Chong, J. Yang, L. Sun, S. Guo, Y. Liu and H. K. Liu, ACS Nano, 2020, 14, 9807–9818 CrossRef CAS PubMed.
- S. Chong, Y. Chen, Y. Zheng, Q. Tan, C. Shu, Y. Liu and Z. Guo, J. Mater. Chem. A, 2017, 5, 22465–22471 RSC.
- Y. Sun, C. Liu, J. Xie, D. Zhuang, W. Zheng and X. Zhao, New J. Chem., 2019, 43, 11618–11625 RSC.
- B. Liu, Q. Zhang, L. Li, L. Zhang, Z. Jin, C. Wang and Z. Su, Ecomat, 2021, 3, e12105 CAS.
- B. Liu, Q. Zhang, L. Li, L. Zhang, B. Hu, Z. Jin, C. Wang and Z. Su, J. Power Sources, 2020, 479, 229113 CrossRef CAS.
- P.-P. Wang, C.-Y. Xu, W.-D. Li, L. Wang and L. Zhen, Electrochim. Acta, 2015, 169, 440–446 CrossRef CAS.
- Y. Qi, Z. Tong, J. Zhao, L. Ma, T. Wu, H. Liu, C. Yang, J. Lu and Y.-S. Hu, Joule, 2018, 2, 2348–2363 CrossRef CAS.
- G. Kobayashi, S.-i. Nishimura, M.-S. Park, R. Kanno, M. Yashima, T. Ida and A. Yamada, Adv. Funct. Mater., 2009, 19, 395–403 CrossRef CAS.
- N. Meethong, H.-Y. S. Huang, W. C. Carter and Y.-M. Chiang, Electrochem. Solid-State Lett., 2007, 10, A134 CrossRef CAS.
- W.-W. Liu, D. Wang, Z. Wang, J. Deng, W.-M. Lau and Y. Zhang, Phys. Chem. Chem. Phys., 2017, 19, 6481–6486 RSC.
- A. Mullaliu, J. Asenbauer, G. Aquilanti, S. Passerini and M. Giorgetti, Small Methods, 2020, 4, 1900529 CrossRef CAS.
Footnote |
| † Electronic supplementary information (ESI) available: Experimental details, TEM, SEM, EDX, etc. See https://doi.org/10.1039/d2sc03824b |
| This journal is © The Royal Society of Chemistry 2022 |

