 Open Access Article
Spatially resolved single-molecule profiling of microRNAs in migrating cells driven by microconfinement†
Zihui
Fan
,
Bin
Li
,
Ya-Jun
Wang
,
Xuedong
Huang
,
Binxiao
Li
,
Shurong
Wang
,
Yixin
Liu
*,
Yan-Jun
Liu
 * and
Baohong
Liu
 *
*
Institutes of Biomedical Sciences, Shanghai Stomatological Hospital, Shanghai Key Laboratory of Medical Epigenetics, International Co-laboratory of Medical Epigenetics and Metabolism (Ministry of Science and Technology), Department of Chemistry, State Key Lab of Molecular Engineering of Polymers, Fudan University, Shanghai 200438, China. E-mail: bhliu@fudan.edu.cn; Yanjun_Liu@fudan.edu.cn; yxliu18@fudan.edu.cn
First published on 6th September 2022
Abstract
Cancer cells utilize a range of migration modes to navigate through a confined tissue microenvironment in vivo, while regulatory roles of key microRNAs (miRNAs) remain unclear. Precisely engineered microconfinement and the high spatial-resolution imaging strategy offer a promising avenue for deciphering the molecular mechanisms that drive cell migration. Here, enzyme-free signal-amplification nanoprobes as an effective tool are developed for three-dimensional (3D) high-resolution profiling of key miRNA molecules in single migrating cells, where distinct migration modes are precisely driven by microconfinement-engineered microchips. The constructed nanoprobes exhibit intuitive and ultrasensitive miRNA characterization in vitro by virtue of a single-molecule imaging microscope, and the differential expression and intracellular locations in different cell lines are successfully monitored. Furthermore, 3D spatial distribution of miR-141 at high resolution in flexible phenotypes of migrating cells is reconstructed in the engineered biomimetic microenvironment. The results indicate that miR-141 may be involved in the metastatic transition from a slow to a fast migration state. This work offers a new opportunity for investigating regulatory mechanisms of intracellular key biomolecules during cell migration in biomimetic microenvironments, which may advance in-depth understanding of cancer metastasis in vivo.
Introduction
The metastasis of cancer cells relies upon a series of cellular events known as the invasion-metastasis cascade.1 The escape of proliferating tumor cells from the primary site is often guided by a single invasive cell, which facilitates invasion into the surrounding tissues.2 These cells must migrate through an inter-tissue microenvironment, passing through confined topographies of 3–30 μm. The morphological plasticity of migrating cells enhances their ability to migrate and therefore their invasive capability.3–5 Some cells develop an amoeba-like movement, which allows them to move more quickly and thus increases their efficacy of invasion.6,7 Moreover, some evidence suggests that cells are able to gain detailed and specific information about their local environment through signaling molecules and can adjust their behavior accordingly.5,8–10 To better understand how cancer cells recognize and respond to these environmental signals, biomimetic actuating devices are now being used to simulate the complex three-dimensional (3D) microenvironments that tumor cells exist within.11An increasing amount of evidence suggests that RNA molecules play a number of significant roles in the regulation of cancer cell migration.12 MicroRNAs (miRNAs) are endogenous non-coding RNAs, and their aberrant expression is linked to the development of cancer.13,14 These molecules bind to the 3′-untranslated region (3′-UTR) of their target messenger RNAs (mRNAs), which destabilizes the mRNA and thus prevents the expression of the encoded gene.15 For instance, it has been shown that overexpression of miR-720 downregulates Rab3 in cervical cancer cells and thus promotes cervical cancer metastasis.16 Similarly, Ma et al. showed that upregulation of miR-10b in breast cancer cells inhibits the translation of HOXD10, resulting in increased expression of the RHOC protein, which promotes tumor cell invasion.17 The miR-200 family of miRNAs was also shown to be closely linked to the metastasis of cancer cells.18,19 Overexpression of miR-141, for example, led to marked inhibition of the transcription factor FOXA2, the dysregulation of which is known to promote cervical cancer metastasis.20 These findings demonstrate the unique expression patterns of miRNAs, which can serve as “fingerprints” of cell migration. However, accurately monitoring miRNAs in single living cells remains challenging because of their short sequence, low expression level, and high sequence similarity.21,22 Given this, various DNA nanotechnology-based strategies have been developed for miRNA imaging.23–25 Thus, developing a simple method to precisely measure miRNAs in migrating cells under biomimetic microenvironments would be a powerful tool.
Single-molecule imaging techniques have recently been developed to allow the pinpointing of individual molecules in cellular microenvironments. Compared with the earlier ensemble methods, single-molecule techniques provide greater sensitivity, higher spatiotemporal resolution, and significantly less perturbation,26,27 which has enabled the examination of protein quantification,28,29 RNA dynamics,30,31 and the subcellular structure.32,33 Among the currently available single-molecule technologies, total internal reflection fluorescence microscopy (TIRFM) has been used extensively to study biomolecular interactions;34 yet, the excitation of a fluorophore is limited to the surface of the sample.35 By applying optimized imaging techniques, however, the laser beam passes through the center of the sample as an oblique thin-layer beam.36 Imaging at a large angle of incidence allows the acquisition of targets at a depth of tens of micrometers, facilitating the generation of a 3D map of molecules in living cells. Additionally, the use of DNA nanotechnologies to amplify the detected signal has greatly improved imaging sensitivity and resolution.37,38 Gold nanoparticles (AuNPs) are widely used as molecular labels for the visualization of intracellular targets because of their good biocompatibility, excellent cell permeability, and ease of modification. Moreover, AuNPs can efficiently quench fluorescent molecules, which is beneficial to reduce the background signal.39 These imaging techniques and effective signal amplification strategies are extremely valuable when studying the molecular mechanisms of migrating cells, both in vivo and in biomimetic environments.
In this study, enzyme-free signal-amplification nanoprobes were designed to image the miR-141 in single migrating cells within a biomimetic microenvironment using single-molecule fluorescence imaging techniques. As shown in Scheme 1, the probes were constructed by coupling oligonucleotide structures to AuNPs. Upon binding to the target miRNAs, the probes triggered a signal amplification cascade, producing individual fluorescent spots that were explicitly counted for quantitative analysis. This strategy allowed differential miRNA expression to be monitored in a range of cell types. Furthermore, microchips were generated to simulate the cellular microenvironment, allowing the spatial distribution of intracellular miRNAs in distinct migration modes to be reconstructed in three dimensions. Together, these strategies resulted in a simple and direct method for the detection of key biomolecules both in vitro and in vivo, which could be a valuable tool in the study of the molecular mechanisms that underlie cancer metastasis.
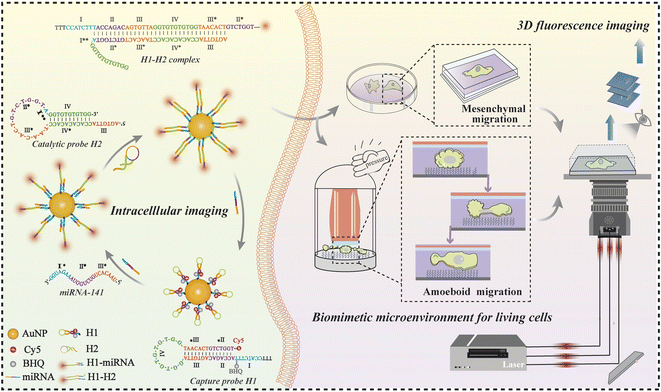 | ||
| Scheme 1 The design and principle of nanoprobes for amplifying intracellular miRNAs of migrating cells in biomimetic microenvironments by using a single-molecule imaging platform. | ||
Results and discussion
Enzyme-free signal-amplifying nanoprobes
AuNPs with a diameter of ∼15 nm were adopted as the optimal carriers for precise target miRNA imaging benefitting from their high loading capacity, realizable functionalization, and good biocompatibility.40,41 As shown in Scheme 1, Cy5 was coupled to the 3′ terminus of the H1 hairpin, and a quencher (BHQ) was appended to the adjacent sites for effective quenching due to achievable fluorescence resonance energy transfer.42 The formed capture probes were closely attached to the AuNPs through thiol–gold bonds for target recognition. The triggered reaction occurred while encountering the complementary sequence of targets, resulting in the opening of hairpin structures. The fluorescence of Cy5 was immediately restored owing to the ineffective quenching effect over long distances, accompanied by the formation of intermediate H1-miRNAs. The catalytic hairpin structures of H2 were then initiated to generate a more stable double-stranded H1–H2 complex (the binding domain: II-III-IV-III* and II*-III*-IV*-III), and the released targets triggered a new round of recognition reaction in the cytoplasm and generated abundant fluorescent spots to achieve signal amplification. The fluorescent spots generated in the reaction were captured by using a home-built single-molecule fluorescence imaging microscope, enabling accurate visualization of quantitative information for target analysis. We used this recognition and signal amplification strategy alongside high-resolution imaging to ultra-sensitively detect, locate, and accurately quantify target molecules.We first characterized the physical properties of the constructed nanoprobes. The transmission electron microscopy (TEM) images revealed that the AuNPs exhibited a uniform size of approximately 15 nm (Fig. S1A†), which was consistent with the hydrodynamic diameter calculated by dynamic light scattering (DLS) measurement (Fig. S1B†). The zeta-potential showed that the charge of H1-AuNPs was more negative than that of AuNPs, confirming the modification of the DNA hairpin structure on the surfaces of the AuNPs (Fig. S1C†). In addition, UV absorption spectroscopy was used to evaluate loading capacity. Successful loading of the nucleic acid probes was demonstrated by a red-shifted absorption peak, as well as the appearance of a characteristic peak at 260 nm in the spectrum of H1-AuNPs, due to a changed dielectric constant (Fig. S1D†).6 What's more, binding H1 on AuNPs can speed up collision, and improve the detection efficiency.43 Therefore, the load of multiple probes could be quantified by using a fluorescence spectrometer (Fig. S2†), which demonstrated that each AuNP contained approximately 76H1 probes. Taken together, the constructed nanoprobes are capable of subsequent target detection.
The feasibility of the designed nanoprobes for sensing miR-141
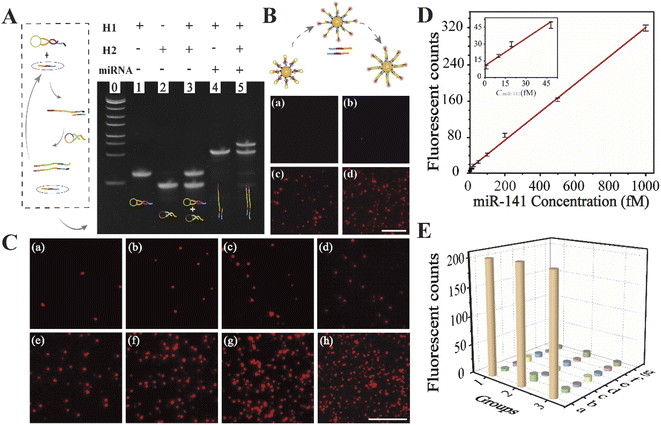
To determine whether the nucleic acid probe was capable of recognizing its target, we performed polyacrylamide gel electrophoresis. This clearly showed that both the H1 capture probe and H2 catalytic probe were inactive and monomeric in the absence of miR-141 (Fig. 1A, lane 3). Upon addition of the miRNAs, the hairpin structure of H1 opened to allow hybridization with the target sequence, producing the intermediate H1-miRNA complex (lane 4). Upon the introduction of H2 (lane 5), stable H1–H2 duplexes were formed, displacing the target miRNAs. These results showed that the oligonucleotide probes were able to undergo continuous strand displacement reactions.To verify the feasibility of the proposed strategy visually, the fluorescence imaging experiment was performed for further visual inspection. As depicted in Fig. 1B, prior to the induction of the target sequence, no obvious fluorescence signal could be observed, because the fluorescence of Cy5 was effectively quenched by AuNPs and BHQ (Fig. 1B(a)). Briefly, the target-triggered self-assembly reaction could not be formed without target miR-141, resulting in an ‘off’ state of the fluorescence signal (Fig. 1B(b)). Upon addition of the target sequence, fluorescent spots existed, implying the successful opening of the H1 hairpin, and then the fluorescence signal recovered (Fig. 1B(c)). As displayed in Fig. 1B(d), after bringing in the catalytic probe, the output of fluorescent spots significantly increased, indicating that an effective amplification cycle was realized with the help of the cyclable target miR-141. These data therefore show that this strategy has high potential for the precise detection of miRNAs based on a home-built single-molecule fluorescence imaging platform.
Amplified biosensing of miR-141 with designed nanoprobes
To investigate the optimal reaction time, real-time monitoring of fluorescent spots was examined based on single-molecule fluorescence imaging. As shown in Fig. S3,† the intensity of the fluorescent spots increased gradually with the increasing time, until reaching a plateau after 100 minutes, suggesting the saturation of the reaction. Thus, the optimal time for subsequent in vitro monitoring was 100 minutes.The visual imaging of miR-141 in vitro quantitative analysis was performed. As demonstrated in Fig. 1C, fluorescent spots increased with increasing miR-141 concentrations. We observed a linear relationship between the fluorescence intensity and miRNA concentration between 1 fM and 1 pM, with a coefficient of determination of R2 = 0.9964 (Fig. 1D). The limit of detection was found to be as low as 1 fM, which was comparable to those of most of the imaging strategies for biomarker analysis.44,45 Furthermore, interfering miRNAs were introduced to evaluate the specificity for miR-141 detection. There were almost no obvious fluorescent spots in the presence of mismatched interfering miRNAs (Fig. 1E), demonstrating that the proposed approach was highly specific. Together, these data showed that enzyme-free signal-amplifying nanoprobes could be used to detect low-abundance target molecules even in complex cellular environments.
In situ single-molecule imaging of miR-141 in living cells
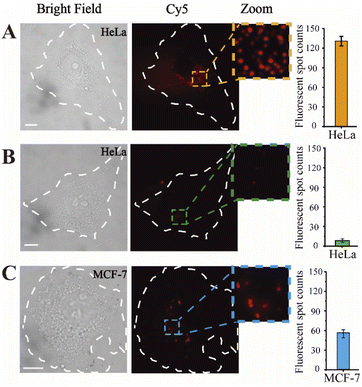
Prior to intracellular imaging, the cytotoxicity of the proposed nanoprobes was evaluated using the CCK-8 detection kit. The nanoprobe was added to HeLa cells in culture, and the cell viability was evaluated in real-time. A nanoprobe-free complete medium was used as a control. After 24 hours, the cell survival rate remained above 90% (Fig. S4†). Thus, the nanoprobes are compatible for use in living cells.Hereafter, fluorescence imaging of the nanoprobes for in situ miRNA abundance detection was monitored in single living cells, where the expression level could be clearly observed, as shown in Fig. 2A, and single spots were exhibited in the magnified images, attributed to the precise imaging platform. Subsequently, the inhibitor was introduced into HeLa cells, and thus, the concentration of intracellular miR-141 could be reduced. As displayed in Fig. 2B, the fluorescent spots in HeLa cells of the transfection inhibitor significantly decreased compared with those in the untreated group. Moreover, the expression levels of miR-141 in different cell lines were investigated by virtue of the designed nanoprobes as well. From Fig. 2C, weaker fluorescence signals can be seen in MCF-7 cells compared with HeLa cells, consistent with those of previous reports.46 The corresponding histograms further showed that the fluorescence readout was closely associated with the miR-141 concentration. Together, these data confirm that the designed fluorescent nanoprobes allow the detection of target expression in single living cells with high resolution and efficiency.
3D imaging of miR-141 in single migrating cells driven by biomimetic microenvironments
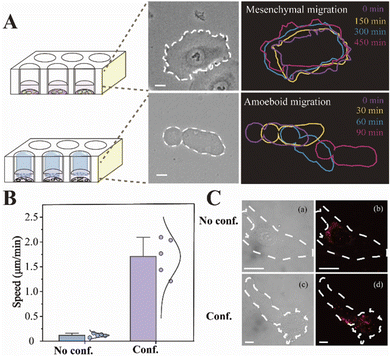
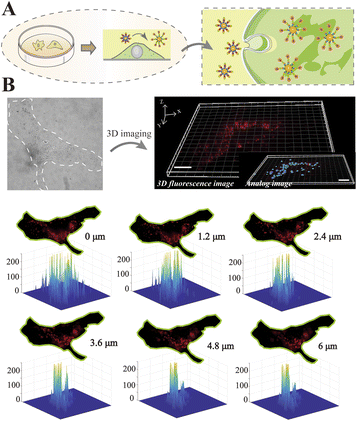
The migration modes of individual cells can be split into mesenchymal migration and amoeboid migration. It has previously been shown that the mesenchymal-amoeboid transition (MAT) is a mechanism used by cancer cells to help them navigate in the crowded microenvironments in vivo.8 As depicted in Fig. 3A, we constructed two biomimetic microenvironments with distinct migration modes. Cells undergoing mesenchymal migration were typically slender with fusiform shapes, while cells undergoing amoeboid migration often formed a large elliptical bleb. We tracked the trajectories of single HeLa cells in distinct migration modes, which revealed that amoeba-like cells moved significantly faster than the mesenchymal-migrating cells (Fig. 3B). To better understand the regulatory mechanism of rapid amoeboid migration, the intracellular miR-141 fluorescence signals in confined cells were detected utilizing a single-molecule imaging platform. Fluorescence imaging was utilized to prove the differential expression of miR-141 between various cell phenotypes under diverse microenvironments (Fig. 3C).To visualize the distribution of intracellular miRNAs with high spatial resolution, we used 3D imaging with fluorescently labeled nanoprobes on a single-molecule imaging platform. We first seeded cells on fibronectin (FN)-modified glass substrates under adherent and non-confinement microenvironments, under which the cells were attached tightly and stretched well (Fig. 4A) representing a mesenchymal migration mode. As shown in Fig. 4B, 3D fluorescence imaging for precise spatial information was perfectly performed by means of reconstructing diverse slices in the z-stacks. The analog images presented miR-141 more clearly and precisely. Meanwhile, we observed the spatial distribution of intracellular miR-141 along with clear fluorescent spots, in which the differential distribution of various layers was intuitively displayed via isometric orthographic views.
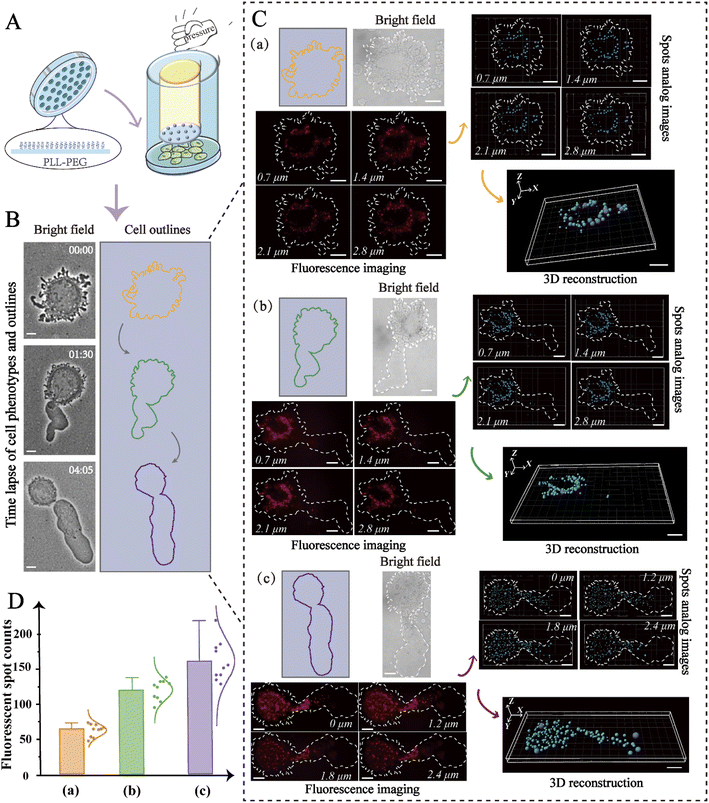
The expression levels of biomolecules, including miRNAs, can be affected by cell contractility, thereby altering cell migration.47 For this reason, analysis of miRNA distribution in distinct phenotypes is particularly valuable. To simulate the different microenvironments, microchips were constructed using microfabrication and microfluidic techniques. As shown in Fig. 5A, micropillars with a height of 3 μm were constructed on the microchip to replicate the confined inter-tissue spaces, and the glass substrate was coated with poly-(L-lysine)-polyethylene glycol, which formed a non-adhesive surface that enabled high mobility. To confine the cells, vertical pressure was carefully applied so that it was exerted directly above the cells.
In this way, the desired spacing between the micropillars and the cell culture substrate was obtained, and the living cells were thus limited in space. As shown in Fig. 5B, the confined cell initially exhibited a round shape with flexible blebbing around the cell edges, and then gradually polarized to form a stable amoeba-like phenotype for high-speed migration. To determine if this transition was accompanied by changes to miR-141, we used 3D imaging to in-depth decipher the spatial distribution of miR-141 within the cells. As displayed in Fig. 5C, fluorescence isometric orthographic views displayed the variation of miR-141 at distinct slices (XY slices) in z-stacks with explicit fluorescent spots. To further improve the intuitive presentation, the fluorescence signal was simulated by automatic threshold detection of Imaris, and then the fluorescent spots and the analog images were combined. Besides, 3D single-molecule reconstruction and subsequent quantitative analysis revealed the spatial distribution of intracellular miR-141 and showed progressive changes to the miRNAs in distinct cell phenotypes. The data indicate that the levels of miR-141 increase during the mesenchymal-amoeboid transition (Fig. 5D), which may promote cervical cancer cell migration through repression of FOXA2.20 From this, we can conclude that our nanoprobe-based strategy allows precise study of the spatial distribution of miRNAs in cells undergoing various forms of migration, and thus may be valuable in the study of the molecular mechanisms of cancer metastasis more broadly.
Conclusions
In summary, 3D spatially resolved profiling of miR-141 was achieved in single migrating cells with the assistance of enzyme-free signal-amplifying nanoprobes utilizing a single-molecule fluorescence imaging microscope with excellent sensitivity and selectivity. The resultant fluorescent spots were able to be directly counted in vitro, eliminating the need for traditional integrated signals from averaged fluorescence measurements. This strategy enabled the examination of differential miR-141 expression in different cell lines. Significantly, distinct cell migration modes were achieved under biomimetic microconfinement engineered by using 3 μm-high PDMS microchips, in which 3D spatial high-resolution distribution of miR-141 in single migrating cells was successfully reconstructed in flexible phenotypes of HeLa cells. The results indicated that the differential expression of miR-141 may be involved in the regulation of the migration process in confined environments. Our proposed platform could provide an opportunity for high-resolution visual exploration of key biomolecules in single migrating cells during flexible migration modes, and thus could pave the way for a greater understanding of molecular mechanisms during cancer metastasis in vivo.Experimental section
Materials
Tri(2-carboxyethyl)phosphine hydrochloride (TCEP), hydrogen tetrachloroaurate(III) trihydrate (HAuCl4·3H2O), NaCl, and calyculin A were provided by Sigma-Aldrich. PBS, DMEM, FBS, and trypsin (0.25%) were purchased from Promethe Biotechnology Co., Ltd. (Shanghai, China). The PureFection™ transfection reagent was provided by ExCell Biotechnology Company (Shanghai, China). The cell counting kit-8 (CCK-8) kit was purchased from Beyotime Biotechnology (Shanghai, China). The RTV615 PDMS kit was obtained from Momentive (USA). From SuSoS (Switzerland), we purchased PLL (20 kDa)-g [3.5]-PEG (2 kDa) (PLL-PEG). HeLa cells were obtained from the cell bank of the Chinese Academy of Sciences (Shanghai, China) and MCF-7 cells were obtained from Silver Amethyst Biotech. Co., Ltd. (Beijing, China). From Sangon Biological Engineering Technology & Services Co., Ltd. (Shanghai, China), we synthesized miRNAs and all oligonucleotide sequences with or without dyes. Target miRNAs with different concentrations were diluted with ultra-pure water.Apparatus
Morphology characterization of AuNPs was carried out by using a transmission electron microscope (JEOL JEM-2011, Japan). The zeta potential was measured by using a Zetasizer Nano apparatus (Nano-Z, UK). The ultraviolet-visible light absorption spectrum was recorded by using an ultraviolet-visible spectrophotometer (Agilent HP8453, USA). The plasma treatment of glass was performed in a plasma cleaner (Harrick PDC-002, USA).Gel electrophoresis analysis
15% polyacrylamide gel electrophoresis (PAGE) was used to prove the feasibility of the reaction path. Multiple DNA samples were added with loading buffer to the upper tank of the gel, followed by running the gel at 110 V for 1 h. Then, the gel was stained with dyes, and the images were photographed by using a digital camera (UVP, Cambridge, UK).Fabrication of H1-AuNP nanoprobes
Initially, the capture probe H1 was heated at 95 °C for 5 min to form a hairpin structure during the natural cooling process. The probe was treated with TCEP to facilitate subsequent modification. After 1 h later, the capture probe H1 (200 nM) was added to the gold colloid solution (2 nM) and lightly shaken overnight. The obtained pure H1-AuNPs were collected by centrifugation to remove the unbound H1 in the solution. The final product was stored for further use.Fluorescence monitoring of miR-141 in vitro
Different concentrations of miR-141 were added to the H1-AuNP solution (2 nM), and the catalytic probe H2 was stirred and incubated at 37 °C for 90 min. The samples were captured based on a home-built single-molecule fluorescent imaging platform. Each image was collected from 30 consecutive frames, and the exposure time was 100 milliseconds. Furthermore, the spots presented were counted using ImageJ. In terms of specificity analysis, miR-21, miR-30, miR-100, miR-125b, let-7b, and let-7c were compared, and the treatment method was the same as above.Cell culture and miR-141 imaging in living cells
For cells without confinement, a fibronectin-modified culture dish with a bottom area of 35 mm2 was prepared. After 24 h of culturing, the cells were cultured in a fresh complete culture medium for another 2 h. Then, the H1-AuNP capture probe (2 nM), catalytic probe H2 (2 nM), and the PureFection™ reagent were added and incubated at 37 °C for 4 h. Before imaging, the cells were washed with 1× PBS 3 times. Fluorescence imaging of miRNAs in cells was directly captured by using a TIRF microscope with a 100× objective lens.For cells under microconfinement, after incubating with nanoprobes, trypsin was used to digest cells from the culture flask. Then, the cells were transferred to a 6-well plate confiner, and a fresh medium with calyculin A (10 nM) was added to each well, after which they were cultured for 30 min in an incubator. Then, the the 6-well plate was covered using the prepared lid with suctions and constant force was maintained with adhesive tape (Scotch Magic Tape, 3M). Furthermore, the cells were washed with 1× PBS to avoid interference and the 3D high-resolution spatial distribution of the miRNAs was recorded by using a TIRF microscope. The resulting images were analyzed using ImageJ and Imaris, and the self-editing programs of MATLAB (MathWorks, USA).
Data availability
The data that support the findings of this study are available in the main manuscript and also from the authors upon reasonable request.Author contributions
B. Liu, Y.-J. Liu and Y. Liu conceived the idea and designed the experiments. Z. Fan carried out most of the experiments and wrote the original draft. Z. Fan and B. Li synthesized the materials and conducted the experiments. Y.-J. W. fabricated the microfluidic chip. X. Huang, B. Li and S. Wang helped with material characterization and experiments in vitro. B. Liu, Y.-J. Liu and Y. Liu supervised the project, wrote the manuscript and were responsible for the funding acquisition. All authors commented and reviewed the manuscript and figures.Conflicts of interest
There are no conflicts to declare.Acknowledgements
This work was supported by the National Natural Science Foundation of China (No. 21934001, 31870978, 22274026 and 22204022).References
- E. K. Paluch, I. M. Aspalter and M. Sixt, Annu. Rev. Cell Dev. Biol., 2016, 32, 469–490 CrossRef CAS PubMed.
- A. W. Holle, N. Govindan Kutty Devi, K. Clar, A. Fan, T. Saif, R. Kemkemer and J. P. Spatz, Nano Lett., 2019, 19, 2280–2290 CrossRef CAS PubMed.
- S. Alexander, G. E. Koehl, M. Hirschberg, E. K. Geissler and P. Friedl, Histochem. Cell Biol., 2008, 130, 1147–1154 CrossRef CAS.
- M. Wang, B. Cheng, Y. Yang, H. Liu, G. Huang, L. Han, F. Li and F. Xu, Nano Lett., 2019, 19, 5949–5958 CrossRef CAS PubMed.
- G. P. de Freitas Nader, S. Agüera-Gonzalez, F. Routet, M. Gratia, M. Maurin, V. Cancila, C. Cadart, A. Palamidessi, R. N. Ramos and M. San Roman, Cell, 2021, 184, 5230–5246 CrossRef PubMed.
- Y. Liu, B. Li, Y.-J. Wang, Z. Fan, Y. Du, B. Li, Y.-J. Liu and B. Liu, Anal. Chem., 2022, 94, 4030–4038 CrossRef CAS PubMed.
- K. Paňková, D. Rösel, M. Novotný and J. Brábek, Cell. Mol. Life Sci., 2010, 67, 63–71 CrossRef PubMed.
- Y.-J. Liu, M. Le Berre, F. Lautenschlaeger, P. Maiuri, A. Callan-Jones, M. Heuzé, T. Takaki, R. Voituriez and M. Piel, Cell, 2015, 160, 659–672 CrossRef CAS PubMed.
- V. Venturini, F. Pezzano, F. Catala Castro, H.-M. Häkkinen, S. Jiménez-Delgado, M. Colomer-Rosell, M. Marro, Q. Tolosa-Ramon, S. Paz-López and M. A. Valverde, Science, 2020, 370, 311–322 CrossRef PubMed.
- A. Lomakin, C. Cattin, D. Cuvelier, Z. Alraies, M. Molina, G. Nader, N. Srivastava, P. Sáez, J. Garcia-Arcos and I. Zhitnyak, Science, 2020, 370, 310–322 CrossRef PubMed.
- S. Van Helvert, C. Storm and P. Friedl, Nat. Cell Biol., 2018, 20, 8–20 CrossRef CAS PubMed.
- T. Wang, S. Hamilla, M. Cam, H. Aranda-Espinoza and S. Mili, Nat. Commun., 2017, 8, 1–16 CrossRef CAS PubMed.
- S. Cai, T. Pataillot-Meakin, A. Shibakawa, R. Ren, C. L. Bevan, S. Ladame, A. P. Ivanov and J. B. Edel, Nat. Commun., 2021, 12, 1–12 CrossRef.
- H. Y. Ko, D. W. Hwang, D. S. Lee and S. Kim, Nat. Protoc., 2009, 4, 1663–1669 CrossRef CAS PubMed.
- D. P. Bartel, Cell, 2009, 136, 215–233 CrossRef CAS.
- Y. Tang, Y. Lin, C. Li, X. Hu, Y. Liu, M. He, J. Luo, G. Sun, T. Wang and W. Li, Cell Biosci., 2015, 5, 1–12 CrossRef PubMed.
- L. Ma, J. Teruya-Feldstein and R. A. Weinberg, Nature, 2007, 449, 682–688 CrossRef CAS PubMed.
- S. T. Kundu, L. A. Byers, D. Peng, J. D. Roybal, L. Diao, J. Wang, P. Tong, C. J. Creighton and D. L. Gibbons, Oncogene, 2016, 35, 173–186 CrossRef CAS PubMed.
- M. T. Le, P. Hamar, C. Guo, E. Basar, R. Perdigão-Henriques, L. Balaj and J. Lieberman, J. Clin. Invest., 2014, 124, 5109–5128 CrossRef.
- J.-h. Li, Z. Zhang, M.-z. Du, Y.-c. Guan, J.-n. Yao, H.-y. Yu, B.-j. Wang, X.-l. Wang, S.-l. Wu and Z. Li, Arch. Biochem. Biophys., 2018, 657, 23–30 CrossRef CAS PubMed.
- B.-C. Yin, Y.-Q. Liu and B.-C. Ye, J. Am. Chem. Soc., 2012, 134, 5064–5067 CrossRef CAS PubMed.
- Z. Jin, D. Geißler, X. Qiu, K. D. Wegner and N. Hildebrandt, Angew. Chem., Int. Ed., 2015, 54, 10024–10029 CrossRef CAS.
- S. Yue, X. Song, W. Song and S. Bi, Chem. Sci., 2019, 10, 1651–1658 RSC.
- S. Yue, Y. Li, Z. Qiao, W. Song and S. Bi, Trends Biotechnol., 2021, 39, 1160–1172 CrossRef CAS PubMed.
- J. J. Liu, H. H. Yan, Q. Zhang, P. F. Gao, C. M. Li, G. L. Liang, C. Z. Huang and J. Wang, Anal. Chem., 2020, 92, 13118–13125 CrossRef CAS.
- T. Hirschfeld, Appl. Opt., 1976, 15, 2965–2966 CrossRef CAS.
- S. Shashkova and M. C. Leake, Biosci. Rep., 2017, 37, BSR20170031 CrossRef CAS PubMed.
- C.-P. Mao, S.-C. Wang, Y.-P. Su, S.-H. Tseng, L. He, A. A. Wu, R. B. S. Roden, J. Xiao and C.-F. Hung, Sci. Adv., 2021, 7, eabg6522 CrossRef CAS PubMed.
- F. Luo, G. Qin, T. Xia and X. Fang, Annu. Rev. Anal. Chem., 2020, 13, 337–361 CrossRef CAS PubMed.
- M. Di Antonio, A. Ponjavic, A. Radzevičius, R. T. Ranasinghe, M. Catalano, X. Zhang, J. Shen, L.-M. Needham, S. F. Lee and D. Klenerman, Nat. Chem., 2020, 12, 832–837 CrossRef CAS PubMed.
- D. Mateju, B. Eichenberger, F. Voigt, J. Eglinger, G. Roth and J. A. Chao, Cell, 2020, 183, 1801–1812 CrossRef CAS PubMed.
- G. Vizcay-Barrena, S. E. Webb, M. L. Martin-Fernandez and Z. A. Wilson, J. Exp. Bot., 2011, 62, 5419–5428 CrossRef CAS PubMed.
- Z. Thiel and P. Rivera-Fuentes, Angew. Chem., Int. Ed., 2019, 58, 11474–11478 CrossRef CAS.
- X. Wang, X. Li, X. Deng, D.-T. Luu, C. Maurel and J. Lin, Nat. Protoc., 2015, 10, 2054–2063 CrossRef CAS PubMed.
- Y. Sako, S. Minoghchi and T. Yanagida, Nat. Cell Biol., 2000, 2, 168–172 CrossRef CAS.
- S. Hou, J. Exell and K. Welsher, Nat. Commun., 2020, 11, 1–10 CrossRef PubMed.
- D. Y. Zhang and G. Seelig, Nat. Chem., 2011, 3, 103–113 CrossRef CAS PubMed.
- M. N. Stojanovic and D. Stefanovic, Nat. Biotechnol., 2003, 21, 1069–1074 CrossRef CAS.
- F. Yang, P. Liu, X. Meng, H. Lu, Y. Cao, W. Dai, C. Wang and H. Dong, Anal. Bioanal. Chem., 2019, 411, 4559–4567 CrossRef CAS PubMed.
- D. S. Seferos, D. A. Giljohann, H. D. Hill, A. E. Prigodich and C. A. Mirkin, J. Am. Chem. Soc., 2007, 129, 15477–15479 CrossRef CAS PubMed.
- J. Lei and H. Ju, Chem. Soc. Rev., 2012, 41, 2122–2134 RSC.
- S. Tyagi and F. R. Kramer, Nat. Biotechnol., 1996, 14, 303–308 CrossRef CAS PubMed.
- J. Li, A. Wang, X. Yang, K. Wang and J. Huang, Anal. Chem., 2021, 93, 6270–6277 CrossRef CAS.
- Y. Yu, Z. Chen, L. Shi, F. Yang, J. Pan, B. Zhang and D. Sun, Anal. Chem., 2014, 86, 8200–8205 CrossRef CAS.
- X. Lin, C. Zhang, Y. Huang, Z. Zhu, X. Chen and C. J. Yang, Chem. Commun., 2013, 49, 7243–7245 RSC.
- C. Yang, B. Dou, K. Shi, Y. Chai, Y. Xiang and R. Yuan, Anal. Chem., 2014, 86, 11913–11918 CrossRef CAS PubMed.
- Y. Xiao, R. Riahi, P. Torab, D. D. Zhang and P. K. Wong, ACS Nano, 2019, 13, 1204–1212 CAS.
Footnote |
| † Electronic supplementary information (ESI) available. See https://doi.org/10.1039/d2sc04132d |
| This journal is © The Royal Society of Chemistry 2022 |

