 Open Access Article
Spin state dependent peroxidase activity of heme bound amyloid β peptides relevant to Alzheimer's disease†
Arnab Kumar
Nath
,
Madhuparna
Roy
,
Chinmay
Dey
,
Abhishek
Dey
* and
Somdatta Ghosh
Dey
 *
*
School of Chemical Sciences, Indian Association for the Cultivation of Science, 2A & 2B, Raja S. C. Mullick Road, Jadavpur, Kolkata 700032, India. E-mail: icsgd@iacs.res.in
First published on 22nd November 2022
Abstract
The colocalization of heme rich deposits in the senile plaque of Aβ in the cerebral cortex of the Alzheimer's disease (AD) brain along with altered heme homeostasis and heme deficiency symptoms in AD patients has invoked the association of heme in AD pathology. Heme bound Aβ complexes, depending on the concentration of the complex or peptide to heme ratio, exhibit an equilibrium between a high-spin mono-His bound peroxidase-type active site and a low-spin bis-His bound cytochrome b type active site. The high-spin heme–Aβ complex shows higher peroxidase activity than free heme, where compound I is the reactive oxidant. It is also capable of oxidizing neurotransmitters like serotonin in the presence of peroxide, owing to the formation of compound I. The low-spin bis-His heme–Aβ complex on the other hand shows enhanced peroxidase activity relative to high-spin heme–Aβ. It reacts with H2O2 to produce two stable intermediates, compound 0 and compound I, which are characterized by absorption, EPR and resonance Raman spectroscopy. The stability of compound I of low-spin heme–Aβ is accountable for its enhanced peroxidase activity and oxidation of the neurotransmitter serotonin. The effect of the second sphere Tyr10 residue of Aβ on the formation and stability of the intermediates of low-spin heme–Aβ has also been investigated. The higher stability of compound I for low-spin heme–Aβ is likely due to H-bonding interactions involving Tyr10 in the distal pocket.
1. Introduction
Alzheimer's disease (AD) is a neurodegenerative disorder, which is clinically characterized by progressive loss of brain functions.1–4 It is the most common form of senile dementia with symptoms like confusion, rapid mood swings, apraxia and long-term memory loss that eventually culminates in death.4–6 Although the exact cause of AD has remained elusive to date, research over the years into the etiopathology of this disease has resulted in the proposal of some important hypotheses, among which the “amyloid cascade hypothesis” is most widely known.4,7,8 According to this hypothesis, the main histopathological criterion of AD is the extracellular deposition of amyloid fibrils made up of the amyloid β (Aβ) peptide to form structures known as senile plaques,3,4,7–9 which are neurotoxic. This small peptide is generated from a transmembrane protein called the amyloid precursor protein (APP) by the action of secretase enzymes.4,6,10 The Aβ peptides containing 40 and 42 amino acids i.e., Aβ(1-40) and Aβ(1-42) respectively, are the most abundant in the AD brain.4,10 Apart from Aβ, transition metals like Cu and Zn are also found within the senile plaques, both of which have been reported to strongly bind the Aβ peptide.4,9–12 Cu, as a redox active metal, has been proposed to cause oxidative stress that can lead to neuronal cell damage, nucleic acid adduct formation, neurotransmitter oxidation, etc.13–18 Zn, on the other hand, has significant contribution to Aβ deposition.4,10 Thus, over the last few decades, a number of small molecular inhibitors of Aβ aggregation/production and Cu and Zn chelators have been used in therapeutic trials but unfortunately none have been able to provide any symptomatic relief.19–22 However, it should be noted that more recent investigations into potential anti-AD drugs targeting metal homeostasis have led to the design and application of highly specific metal chelators, particularly for Cu(II), such as TDMQ20, which has shown encouraging outcomes like improvements in cognition in transgenic and nontransgenic murine models of AD.23,24Although the importance of Aβ in the AD paradigm is undeniable, in light of the drawbacks of the abovementioned hypotheses in adequately explaining the cause and progression of the disease, the focus has been shifted towards determining an alternative origin of AD. One such recent hypothesis regarding AD pathogenesis is centered on the heme moiety that is found all over the human body including the brain.25–27 The perturbation of heme (and hence iron) metabolism is observed in the AD brain, which manifests itself as heme deficiency symptoms such as lower levels of heme a (26%), a possible compensatory increase in heme b (250%), mitochondrial complex IV dysfunction, unregulated iron accumulation, over expression of heme oxygenase, biliverdin reductase A, ferrochelatase, elevated levels of heme degradation products like bilirubin etc.4,22,27–31 Apart from the brain, changes in the iron and heme homeostasis are also observed in the blood of AD patients in the form of lowering of haemoglobin and peripheral iron levels as well as identification of anaemia, which is common in elderly individuals, as a risk factor for the disease.32–34 All these findings are suggestive of a link between the heme regulatory pathway and AD. Further support for such a causal relationship between heme and AD comes from reports of spatial overlap between heme rich deposits and Aβ containing senile plaques in the AD brain and presence of both these structures in the vicinity of microvessels.35,36 In fact, experiments on a murine AD model show vascular Aβ deposition, i.e., cerebral amyloid angiopathy (CAA) can damage microvessels (microhemorrhages) and have haemolytic effects, which may be a source of free heme accumulation in the AD brain.37 Heme in the form of hemoglobin has also been found to co-localize with the senile plaques with its levels being higher in AD associated brain regions like the hippocampus, parietal grey matter, parietal white matter and inferior temporal gyri.31,38 Hence, multiple lines of evidence provide credibility to the heme based hypothesis and have even led to much research effort being directed towards studying how heme and the plaque forming Aβ peptide interact with each other and the consequences thereof. The binding of heme to Aβ has been proposed to result in the depletion of regulatory heme, which may explain the observation of heme deficiency symptoms in AD.4,27,31,39 Recent Raman imaging of AD brain tissue has revealed that, heme present in Aβ plaques in the brain tissue resembles a six coordinated low-spin species that may possibly be a bis-His low-spin heme–Aβ species.40
Heme has been shown to bind to the Aβ peptide through the histidine side chain and depending on the cofactor to peptide ratio or concentration, heme–Aβ complexes can have different coordination environments and spin states.22,41,42 When heme and Aβ are present in 1![[thin space (1/6-em)]](https://www.rsc.org/images/entities/char_2009.gif) :
:![[thin space (1/6-em)]](https://www.rsc.org/images/entities/char_2009.gif) 1 stoichiometry and at low concentrations, the resultant complex is a high-spin one with an axial His ligation and a weakly bound trans-axial water derived ligand (Fig. 1). In the presence of H2O2, this high-spin heme–Aβ complex shows greater peroxidase activity than free heme. It goes through an FeIV
1 stoichiometry and at low concentrations, the resultant complex is a high-spin one with an axial His ligation and a weakly bound trans-axial water derived ligand (Fig. 1). In the presence of H2O2, this high-spin heme–Aβ complex shows greater peroxidase activity than free heme. It goes through an FeIV![[double bond, length as m-dash]](https://www.rsc.org/images/entities/char_e001.gif) O porphyrin π cation radical species called compound I in the catalytic cycle, which has been found to be responsible for the oxidation of the neurotransmitter serotonin, an essential neurotransmitter that takes part in important functions like the formation of new memory, cognitive functions, mood stabilization and so on.43 The formation and stability of this high valent transient intermediate are influenced by the distal Arg5 residue by virtue of its pull effect, while the non-coordinating Tyr10 residue hastens the decay process i.e., it is redox active. When Aβ is present in excess or the concentration of heme–Aβ is high, the active site transforms to a cyt. b like a low-spin site with bis His coordination22,42 (Fig. 1). Moreover, we have previously characterized the active site of heme–Aβ in small aggregates or oligomers by resonance Raman spectroscopy that shows a significant amount of low-spin component for the heme–Aβ complex.44 This low-spin complex has been found to exhibit even greater peroxidase activity than the high-spin analogue.
O porphyrin π cation radical species called compound I in the catalytic cycle, which has been found to be responsible for the oxidation of the neurotransmitter serotonin, an essential neurotransmitter that takes part in important functions like the formation of new memory, cognitive functions, mood stabilization and so on.43 The formation and stability of this high valent transient intermediate are influenced by the distal Arg5 residue by virtue of its pull effect, while the non-coordinating Tyr10 residue hastens the decay process i.e., it is redox active. When Aβ is present in excess or the concentration of heme–Aβ is high, the active site transforms to a cyt. b like a low-spin site with bis His coordination22,42 (Fig. 1). Moreover, we have previously characterized the active site of heme–Aβ in small aggregates or oligomers by resonance Raman spectroscopy that shows a significant amount of low-spin component for the heme–Aβ complex.44 This low-spin complex has been found to exhibit even greater peroxidase activity than the high-spin analogue.
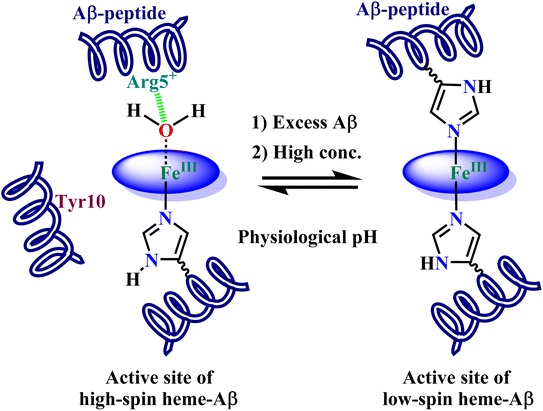 | ||
| Fig. 1 Condition dependent equilibrium between high-spin mono-His heme–Aβ (LHS) and low-spin bis-His heme–Aβ (RHS) at physiological pH. | ||
In the present study, we observe that this enhanced peroxidase activity is associated with the reaction intermediate compound I. In fact, the reaction of low spin heme–Aβ and H2O2 produces two intermediates compound 0, which is an FeIII–OOH species, and compound I respectively, which have been trapped and characterized using absorption, EPR and resonance Raman spectroscopy. The role of the second sphere Tyr10 residue has also been probed extensively showing how it differs from the analogous high-spin heme–Aβ. The fate of compound I in the presence of the neurotransmitter serotonin has been investigated as well. It has been found that a stable compound I of low-spin heme–Aβ resulting in its higher peroxidase activity is the active oxidant for the neurotransmitter serotonin oxidation, a key pathological feature of AD.45–51 Since, it is well established that Aβ oligomers are more neurotoxic than larger aggregates52–57 and given the fact that these oligomers contain a significant amount of low-spin heme–Aβ, higher peroxidase activity of low-spin heme–Aβ resulting in the oxidation of neurotransmitters can potentially lead to neurodegeneration associated with AD.
2. Results and analysis
2.1. Peroxidase activity of low-spin heme–Aβ and the Tyr10Phe mutant
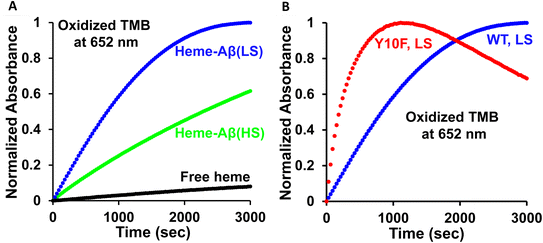
The peroxidase activity of the wild type (WT) low-spin heme–Aβ and its site directed tyrosine mutant (Tyr10Phe) is monitored by absorption spectroscopy, using 3,5,3′,5′-tetramethyl benzidine (TMB) as the substrate by following the 652 nm band (Fig. S1†). Starting from a colorless solution, the appearance of a blue-colored solution with absorption peaks at 370 nm and 652 nm indicates the formation of a charge-transfer complex (Scheme S1†), which then converts to a yellow solution, indicative of the formation of a diamine complex. This indicates a two electron oxidation of TMB (Fig. S2A and S3A, Scheme S1†).58,59 The six-coordinated bis-His low-spin heme–Aβ complex exhibits approximately ∼3 times enhanced peroxidase activity relative to the five-coordinated mono-his high-spin heme–Aβ complex (Fig. 2A), consistent with previous reports.60–62 Interestingly, in the absence of the tyrosine residue at the 10th position (Tyr10), low-spin heme–Aβ exhibits about four times enhanced peroxidase activity relative to the native heme–Aβ complex (Fig. 2B).In naturally occurring peroxidases, the main active oxidant responsible for peroxidase activity is the high valent ferryl porphyrin π-cation radical (FeIV![[double bond, length as m-dash]](https://www.rsc.org/images/entities/char_e001.gif) OPor˙+), named compound I.60,63–65 The low-spin heme–Aβ shows significant enhancement in the rate of TMB oxidation (peroxidase activity, formation of the 652 nm band) in the presence of H2O2 relative to control experiments, i.e. TMB + H2O2, TMB + H2O2 + heme, and TMB + H2O2 + Aβ (Fig. S4†), negating the involvement of an uncontrolled radical process generated by H2O2 or adventitious metal traces in the oxidation process. Our group has recently trapped and characterized the compound I species in the peroxidase cycle of high-spin heme–Aβ, akin to native peroxidases.19
OPor˙+), named compound I.60,63–65 The low-spin heme–Aβ shows significant enhancement in the rate of TMB oxidation (peroxidase activity, formation of the 652 nm band) in the presence of H2O2 relative to control experiments, i.e. TMB + H2O2, TMB + H2O2 + heme, and TMB + H2O2 + Aβ (Fig. S4†), negating the involvement of an uncontrolled radical process generated by H2O2 or adventitious metal traces in the oxidation process. Our group has recently trapped and characterized the compound I species in the peroxidase cycle of high-spin heme–Aβ, akin to native peroxidases.19
2.2. Reaction of low-spin heme–Aβ and H2O2
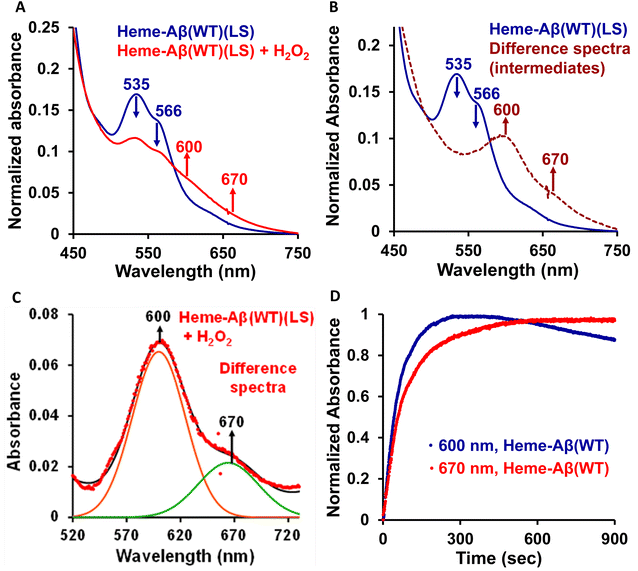
Low-spin heme–Aβ (WT) + H2O2. The low-spin heme–Aβ(WT) complex shows a characteristic Soret band at 414 nm and Q-bands at 535 nm and 566 nm (Fig. 3A, S5 and S6†). The reaction of low-spin heme–Aβ with H2O2 causes a decrease in the intensity of these absorption bands along with simultaneous formation of new bands at 600 nm and 670 nm (Fig. S5† and 3A–C). The kinetic traces at 600 and 670 nm indicate that the 600 nm band has a faster rate of formation compared to the 670 nm band (Fig. 3D). The formation of the bands at 600 and 670 nm follows 1st order kinetics with a rate of formation of 1.6 × 10⁻² s−1 and 8.5 × 10⁻³ s−1, respectively. Unlike the band at 670 nm, the 600 nm band decays during the course of the reaction (Fig. 3D). These observations likely indicate that the reaction of heme–Aβ and H2O2 produces two reaction intermediates with characteristic bands at 600 nm and 670 nm. According to existing literature reports, the absorption band at around 650–675 nm is typically characteristic of a ferryl porphyrin π-cation radical (FeIV
![[double bond, length as m-dash]](https://www.rsc.org/images/entities/char_e001.gif) OPor˙+) or compound I.66–70 Note that compound I of heme–Aβ high-spin species exhibits a characteristic band at ∼675 nm.19 The absorption band at 670 nm for low-spin heme bound Aβ upon reaction with H2O2 may therefore likely correspond to a stable compound I species, while the band at 600 nm, which forms prior to compound I, may be attributed to an FeIII–OOH or compound 0 species.
OPor˙+) or compound I.66–70 Note that compound I of heme–Aβ high-spin species exhibits a characteristic band at ∼675 nm.19 The absorption band at 670 nm for low-spin heme bound Aβ upon reaction with H2O2 may therefore likely correspond to a stable compound I species, while the band at 600 nm, which forms prior to compound I, may be attributed to an FeIII–OOH or compound 0 species.
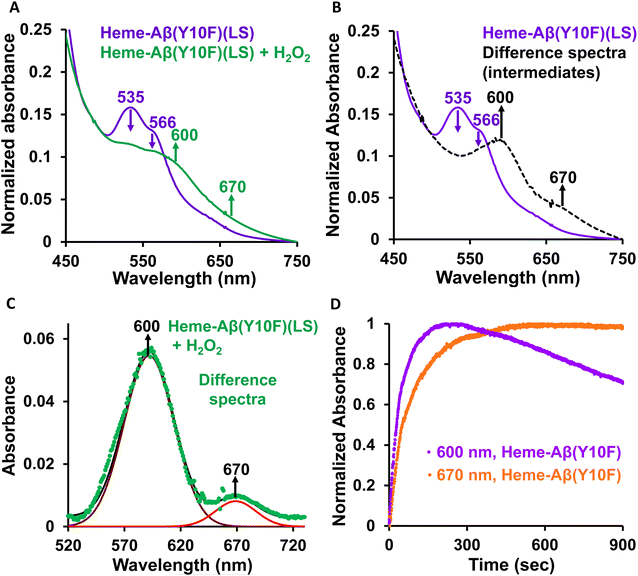
Low-spin heme–Aβ(Tyr10Phe) + H2O2. The Tyr10Phe mutant (Y10F) shows a characteristic Soret band at 414 nm and Q-bands at 535 and 566 nm (Fig. 4A, S7 and S8†). Upon reaction with H2O2, the low-spin heme–Aβ Tyr10Phe mutant (Y10F) shows a decrease in the intensity of these characteristic absorption bands with concomitant formation of new bands at 600 nm and 670 nm (Fig. S7† and 4A–C), similar to the native low-spin heme–Aβ complex. The formation of the 600 nm band occurs prior to the 670 nm band (Fig. 4D), analogous to the native complex. Thus, the bands at 600 and 670 nm for Tyr10Phe (Y10F) may correspond to compound 0 and compound I respectively, similar to the native complex. However, a notable feature of the Tyr10Phe (Y10F) mutant of low-spin heme–Aβ is a faster rate of formation as well as a faster decay of the band at 600 nm, attributed to compound 0, in contrast to the native heme–Aβ complex (Fig. S9†). This indicates a possible second sphere effect exerted by Tyr10 in the formation of the reaction intermediates and hence on the peroxidase activity exhibited by low-spin heme–Aβ.
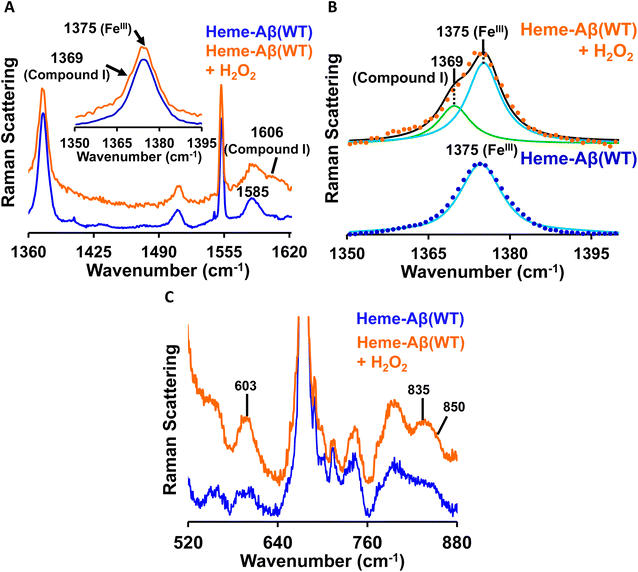
Low-spin heme–Aβ (WT) + H2O2. The putative reaction intermediates, compound 0 and compound I, formed during the reaction between heme–Aβ (WT and Tyr10Phe) and H2O2, have characteristic vibrational features and are probed by resonance Raman spectroscopy. The resonance Raman spectra of frozen solution of low-spin heme–Aβ(WT) and H2O2 are obtained by using an excitation wavelength of 413.1 nm. The low-spin hemeIII–Aβ(WT) complex shows characteristic resonance Raman marker bands ν4 (oxidation state) and ν2 (spin state) at 1375 and 1585 cm−1 respectively (Fig. 6A). In addition to the marker bands characteristic of the resting state, the addition of H2O2 produces broadening of the oxidation state marker band i.e., the ν4 band due to the presence of a shoulder at 1369 cm−1 along with the appearance of a new band in the ν2 region at 1606 cm−1 (Fig. 6A, inset). The fitting of the ν4 region shows bands at 1369 and 1375 cm−1 (Fig. 6B). These marker bands at 1369 cm−1 and 1606 cm−1 suggest the formation of a ferryl porphyrin π-cation radical (FeIV
![[double bond, length as m-dash]](https://www.rsc.org/images/entities/char_e001.gif) OPor˙+) i.e. compound I,19,78–81 consistent with the absorption data (band at 670 nm, Fig. 3).
OPor˙+) i.e. compound I,19,78–81 consistent with the absorption data (band at 670 nm, Fig. 3).
The reaction of low-spin heme–Aβ(WT) with H2O2 produces bands at 603 cm−1, 835 cm−1 and 850 cm−1 in the lower frequency region (Fig. 6C). When the reaction is carried out in deuterated medium, the bands at 603 cm−1 and 835 cm−1 shift to 588 cm−1 and 816 cm−1 respectively (Fig. S10†). However, the band at 850 cm−1 remains unperturbed in deuterated medium (Fig. S10†). Bands in the ∼550–610 cm−1 and 800–830 cm−1 region are characteristic of the Fe–O and O–O stretching of compound 0 (FeIII–OOH), respectively,82–84 whereas bands at ∼830–850 cm−1 represent the Fe–O vibration of compound I for neutral (histidine/imidazole) or weakly bound axial ligand containing systems.19,81,82,85 Note that such a high H/D isotope effect can be observed for compound 0 (FeIII–OOH) like systems and can be attributed to the mixing or mode-coupling of the fundamental O–H stretching with porphyrin vibrations.82 It is to be noted that compound I of high-spin heme–Aβ is characterized by the ν4 band at 1368 cm−1 and the Fe–O stretching at 843 cm−1 (Table 1) that undergoes a 40 cm−1 downshift upon isotopic substitution of oxygen (O16/O18) of peroxide.19 Bands at 603 cm−1 and 835 cm−1 therefore represent νFe–O and νO–O vibrations for compound 0 of heme–Aβ for low-spin heme–Aβ(WT) (Fig. 6C and S10†). On the other hand, the band at 850 cm−1 along with new marker bands at 1369 cm−1 (ν4) and 1606 cm−1 (ν2) (Fig. 6 and S10†) may indicate the formation of compound I for low-spin heme–Aβ(WT).
| Heme–Aβ complexes | ν 4 region (cm−1) | ν 2 region (cm−1) | ||||
|---|---|---|---|---|---|---|
| FeIII | Cmpd 0 | Cmpd I | FeIII | Cmpd 0 | Cmpd I | |
| a FeIII = resting state, Cmpd 0 = compound 0 (FeIII–OOH), and Cmpd I = compound I (FeIV = OPor˙+). | ||||||
| Heme–Aβ(Y10F)(HS) | 1375 | — | 1368 | 1575 | — | — |
| Heme–Aβ(WT)(LS) | 1375 | 1375 | 1369 | 1585 | — | 1602 |
| Heme–Aβ(Y10F)(LS) | 1375 | 1375 | 1369 | 1585 | 1591 | 1602 |
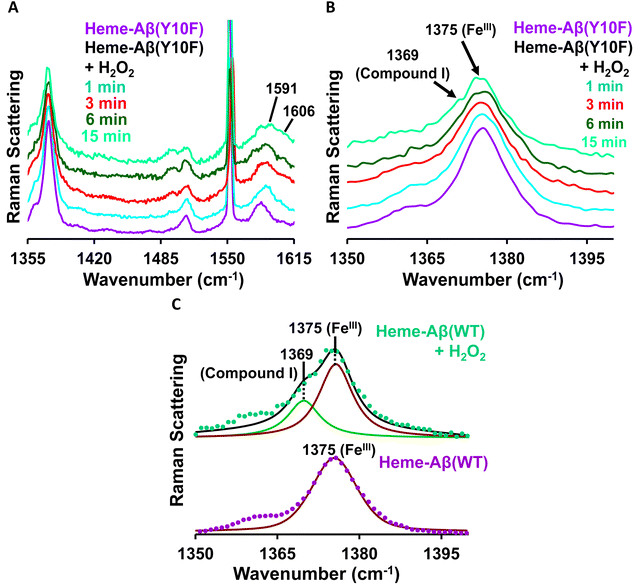
Low-spin heme–Aβ(Tyr10Phe) + H2O2. The reaction of low-spin heme–Aβ(Tyr10Phe) with H2O2 is monitored by resonance Raman spectroscopy. Resonance Raman spectra obtained at different times during the course of the reaction of low-spin heme–Aβ(Tyr10Phe) and H2O2 are shown in Fig. 7. The addition of H2O2 initially shifts the ν2 band at 1585 cm−1 for low-spin hemeIII–Aβ to 1591 cm−1 with no observed change in the ν4 band at 1375 cm−1 (Fig. 7), which indicates the formation of a new low-spin FeIII species consistent with EPR spectroscopy. Moreover, in the later phase of the reaction a new set of bands at 1369 cm−1 in the ν4 region and 1606 cm−1 in the ν2 region appear (Fig. 7, Table 1), similar to native low-spin heme–Aβ(WT), which is characteristic of compound I formation.
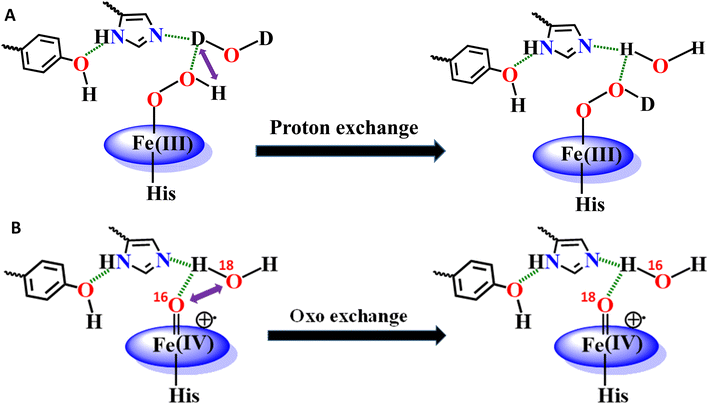
In the lower frequency region, the aforementioned reaction produces bands at 603 cm−1 and 835 cm−1 in the initial phase. However, with time, these bands lose their intensity and the band at 850 cm−1 becomes more prominent (Fig. 8A). When the reaction of low-spin heme–Aβ(Tyr10Phe) and H2O2 is performed in deuterated medium, a shift of the bands from 603 cm−1 to 588 cm−1 and 835 cm−1 to 816 cm−1 is observed (Fig. 8B and S11†), similar to wild type low-spin heme–Aβ (Fig. S10†). In addition, when the same reaction is performed in isotope labelled solvent (H2O18), it only produces a shift of the band at 850 cm−1 to 809 cm−1 with no perturbation of the bands at 603 cm−1 and 835 cm−1 (Fig. 8C and S12†). Note that to minimize the interference of the background noise from quartz, charcoal data are subtracted from the experimental data of low-spin heme–Aβ Tyr10 mutant (Y10F) + H2O2. Thus the bands at 603 cm−1 and 835 cm−1 that undergo a large H/D downshift but remain unperturbed in isotope labelled solvent (H2O18) therefore represent the νFe–O and νO–O vibrations of compound 0 respectively.82 However, the band at 850 cm−1 that undergoes a 41 cm−1 downshift in isotope labelled solvent (H2O18) corresponds to νFe–O of compound I.19,81,82,85,86 Thus, the reaction intermediates, compound 0 and compound I originating from low-spin heme–Aβ(Tyr10Phe) are confirmed by isotopic substitution of proton (H/D) and oxygen (O16/18) of H2O2 (Fig. 9).
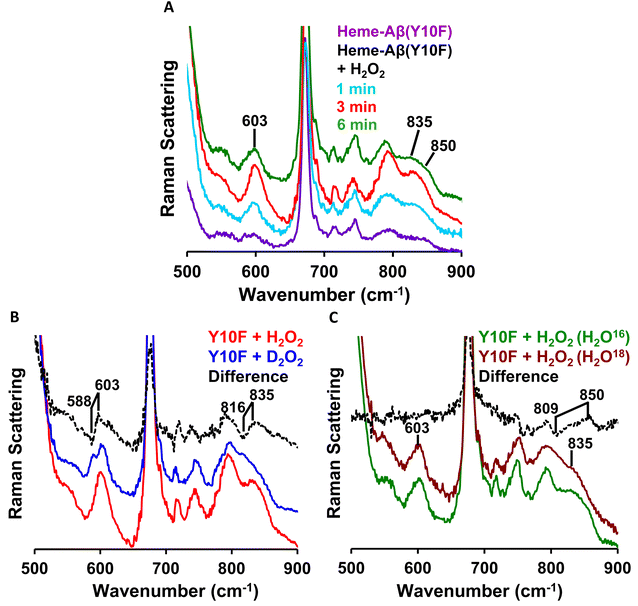 | ||
| Fig. 8 Low frequency region of the resonance Raman spectra of (A) the low-spin heme–Aβ Tyr10 mutant (Y10F) (purple), low-spin heme–Aβ Tyr10 mutant (Y10F) and H2O2 at 1 min (cyan), 3 min (red) and 6 min (green); (B) for the reaction of the low-spin heme–Aβ Tyr10 mutant (Y10F) and H2O2 (red) and low-spin heme–Aβ Tyr10 mutant (Y10F) and D2O2 (blue); (C) for the reaction of the low-spin heme–Aβ Tyr10 mutant (Y10F) and H2O2 (in H2O16) (green) and low-spin heme–Aβ Tyr10 mutant (Y10F) and H2O2 (in H2O18) (brawn). The reaction is done in 100 mM phosphate buffer at pH 7.6 and data are obtained with an excitation wavelength of 413.1 nm (5 mW) at 77 K. | ||
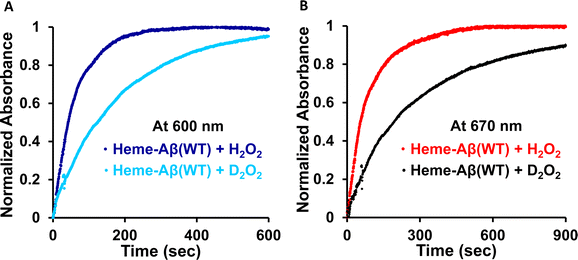
The rate of compound 0 formation (600 nm band) for low-spin heme–Aβ(WT) decreases in deuterated medium with respect to the reaction in aqueous medium and the observed kH/kD value is ∼3 (Fig. 10). This is indicative of involvement of a proton in the formation of compound 0. The rate of compound I formation (670 nm band) for low-spin heme–Aβ exhibits a high kH/kD of ∼3.5 (Fig. 10). The large kinetic isotope effect (KIE) for low-spin heme–Aβ may thus suggest that in the low-spin complex, there is no preorganized proton transfer residue like arginine (Arg5) to assist the O–O bond heterolysis of compound 0 to form compound I.19,64 Instead, the neighboring H-bonded water molecules may affect it presumably through a proton relay mechanism.
3. Discussion
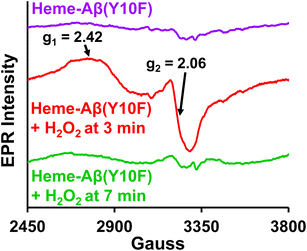
TMB oxidation by low-spin heme–Aβ WT and Tyr10 mutants in the presence of H2O2, monitored by absorption spectroscopy shows that both of these complexes carry out a two-electron oxidation of the substrate TMB to produce initially a charge–transfer complex as the one electron oxidation product followed by a diamine compound as the 2nd electron oxidation product (Fig. S2, S3 and Scheme S1†). This two-electron oxidation of the substrate TMB for low-spin heme–Aβ in the presence of H2O2 is typically similar to the peroxidase mechanism shown by naturally occurring peroxidases. Moreover, low-spin heme–Aβ shows significant enhancement in the rate of TMB oxidation (peroxidase activity, formation of the 652 nm band) in the presence of H2O2 relative to control experiments, i.e. TMB + H2O2, TMB + H2O2 + heme, and TMB + H2O2 + Aβ (Fig. S4†) that possibly exclude the association of an uncontrolled radical process generated by H2O2 or the involvement of adventitious metal traces in the oxidation process.Absorption, EPR and resonance Raman spectroscopy indicate that low-spin heme–Aβ reacts with H2O2 to generate compound 0, which then generates compound I. Compound 0 is characterized by an absorption band at 600 nm, along with a characteristic rhombic low spin FeIII EPR signal at g1 = 2.42 and g2 = 2.06 at 77 K (Fig. 3–5). It has characteristic ν4 and ν2 bands at 1375 cm−1 and 1591 cm−1, and bands at 603 cm−1 and 835 cm−1 in the lower energy region of the resonance Raman spectrum, characterizing the Fe–O and O–O stretching, respectively (Fig. 6C, 7A, 8A and B). The bands at 603 cm−1 and 835 cm−1 undergo a large isotope shift on H/D isotope substitution indicating the involvement of protons in the formation of the FeIII–OOH species i.e. compound 0 (Fig. 8B, S10 and S11†). The other reactive intermediate, compound I, is characterized by an absorption band at 670 nm (Fig. 3 and 4) along with resonance Raman bands, ν4 and ν2 at 1369 cm−1 and 1606 cm−1 respectively, in the higher energy region and 850 cm−1 in the lower energy region (Fig. 6, 7, 8A, C and S12A†). The 850 cm−1 band shifts to 809 cm−1 in isotope labelled solvent (H2O18), which reaffirms the identity of compound I (Fig. 8C and S12†). This intermediate in the peroxidase catalytic cycle of low-spin heme–Aβ has been proposed to be the active oxidant responsible for its peroxidase activity (TMB oxidation), which is greater relative to the high-spin analogue. Such a difference in the peroxidase activity of high-spin and low-spin heme–Aβ can be explained by considering the stability and population of the active oxidant, compound I for the two complexes. Note that the aforementioned TMB oxidation (formation of a charge-transfer complex) can also occur due to the generation of OH˙,88–90 but for low-spin heme–Aβ, TMB oxidation is mainly attributed to the formation of compound I in the presence of H2O2 (peroxidase-like mechanism) as confirmed by the above spectroscopic results.
It appears that the reaction of heme–Aβ with oxidants like H2O2 or m-CPBA gets influenced by the amino acid residues present in the distal pocket of the heme center consistent with 2nd sphere effects observed in other metalloenzymes.63–65,91 We have previously observed that the reaction of high-spin heme–Aβ with H2O2 or m-CPBA occurs too fast to accumulate any compound 0, while a relatively unstable compound I is observed.19,22 On the other hand, the reaction of low-spin heme–Aβ and H2O2 is significantly slower (∼105 times) and the intermediates, compound 0 and compound I, are relatively stable (Fig. 3 and 4 and Table 2). The main difference between high-spin and low-spin heme–Aβ is the attachment of a distal His to the FeIII center of heme in the latter case (Fig. 1), which is responsible for the slower rate of the reaction, and greater stability of the reaction intermediates. In the case of low-spin heme–Aβ, the presence of a His residue at the distal site of heme likely makes its displacement by H2O2 slow resulting in a slower rate of formation of compound 0.
| Heme–Aβ(1-40) complexes | Compound 0 | Compound I | ||
|---|---|---|---|---|
| Formation rate (s−1) | Decay rate (s−1) | Formation rate (s−1) | Decay rate (s−1) | |
| Heme–Aβ(WT)(HS) | Not observed | Not observed | 4.70 × 101 | 24.0 × 10⁻¹ |
| Heme–Aβ(Y10F)(HS) | Not observed | Not observed | 5.50 × 101 | 4.00 × 10⁻¹ |
| Heme–Aβ(WT)(LS) | 1.60 × 10⁻² | 1.5 × 10⁻⁴ | 8.50 × 10⁻³ | No decay |
| Heme–Aβ(Y10F)(LS) | 2.35 × 10⁻² | 3.5 × 10⁻⁴ | 10.0 × 10⁻³ | No decay |
Low-spin heme–Aβ exhibits an observed kH/kD ∼ 3.5 for compound I formation. Note that the formation of compound I for high-spin heme–Aβ shows a kH/kD of ∼2, in which case the distal arginine residue (Arg5) acts as a proton source for O–O bond heterolysis19,22 and assists in the formation of compound I. A relatively higher KIE for the low-spin complex could likely indicate the absence of any preorganized proton transfer amino acid side chain like Arg5. This has precedence in site directed mutants of cytP450, where very high KIE is observed because of a possible water mediated proton transfer due to the lack of a preorganized proton source.92,93
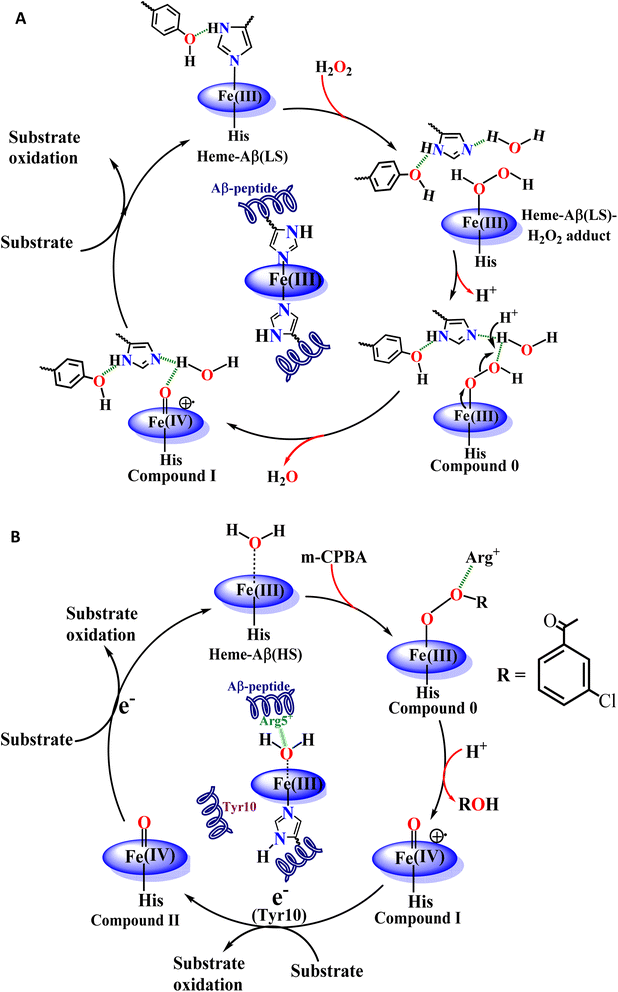
The Tyr10 residue exhibits various redox activity in high-spin heme–Aβ complexes. It donates an electron to oxygen and is responsible for ROS generation.6,94 Additionally, it is involved in transferring an electron to the active oxidant compound I and results in its reductive decay in high-spin heme–Aβ complexes (Scheme 1B).19,22 However, as evident from the kinetics of WT Aβ and Tyr10Phe Aβ, it does not exhibit redox activity towards compound I in the case of low-spin heme–Aβ complexes (670 nm trace, Fig. 3D and 4D). This redox inactivity of the Tyr10 residue in low-spin heme–Aβ is also supported by our previous observations, where a 50% decrease in PROS formation was observed for low-spin heme–Aβ(WT).42 This likely indicates that in low-spin heme–Aβ because of the coordination of a distal His to the heme–Fe center, the Tyr10 residue is no longer favorably disposed (in terms of the position and redox potential) to exhibit redox activity.
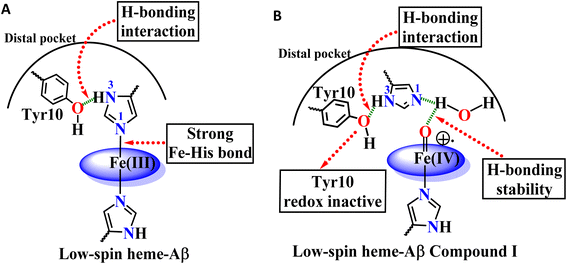
The Tyr10Phe mutant of low-spin heme–Aβ reacts with H2O2 resulting in the formation of compound 0 and compound I, similar to native low-spin heme–Aβ. However, the rate of formation of compound 0 corresponding to 600 nm is much faster for the Tyr10Phe mutant as compared to the native complex (Fig. S9†). Furthermore, resonance Raman data show that, although both these complexes involve the same set of intermediates i.e., compound 0 and compound I, their population is higher for the low-spin heme–Aβ(Tyr10Phe) mutant as compared to the native complex (Fig. 6–8). These observations suggest that the absence of the Tyr10 residue facilitates the attack of H2O2 on the heme center of low-spin heme–Aβ. A higher population of the active oxidant compound I of the low-spin heme–Aβ Tyr10Phe mutant possibly accounts for its higher peroxidase activity relative to the native complex (Fig. 2B). In fact, similar observations are reported in the case of cytochrome c, where the stabilization of distal FeIII–methionine bonding occurs through H-bonding interaction with a second sphere tyrosine residue (Tyr67).95 It is reported that in the absence of Tyr67 in cytochrome c, the enzyme exhibits many fold increased peroxidase activity compared to native cytochrome c.95 In the case of wild type low-spin heme–Aβ a similar scenario may be envisaged, wherein H-bonding interaction between Tyr10 and distal His (involving Tyr-O and His-N3-H) makes the FeIII-His bond stronger by increasing the basicity of the histidine residue, thereby decelerating the attack by H2O2 (Fig. 12 and Scheme 1A). This H-bonding interaction between the phenol–O of Tyr10 and the distal N3–H of His is likely to deplete the electron density of Tyr-O, diminishing its redox activity and altering the effect of Tyr10 in low-spin heme–Aβ.
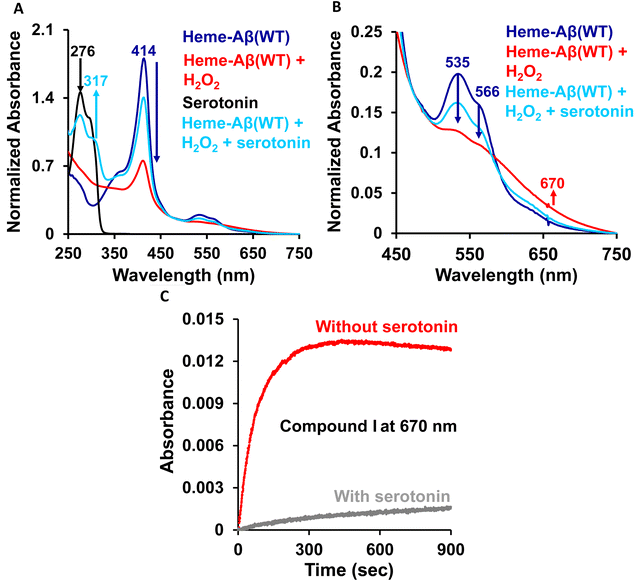
The high stability of compound I of low-spin heme–Aβ may well be attributed to the presence of water molecules in its distal pocket (Fig. 12). This prediction of the water-mediated stability of compound I of low-spin heme–Aβ is verified using a bulky substrate like the neurotransmitter serotonin. The results show that in the presence of serotonin, the reaction of low-spin heme–Aβ and H2O2 does not produce any significant amount of compound I; rather serotonin oxidation is observed (Fig. 11). Earlier theoretical studies demonstrate that similar to the low-spin heme–Aβ complex, compound I of cytP450 is found to be stable in the absence of the substrate. Such stability of compound I of cytP450 occurs due to H-bonding interaction with the neighboring water molecules. The presence of the substrate at the distal site however enhances the oxidizing capacity of compound I of cytP450 by displacing the water molecules involved in H-bonding interaction with compound I.96 A similar H-bonding interaction from nearby water molecules, may be held by the distal His residue, is assumed for compound I of heme–Aβ low-spin (Fig. 12B and Scheme 1A), which is disrupted in the presence of the substrate, serotonin, explaining the stability of this reactive intermediate.
In contrast to the low-spin counterpart, high-spin heme–Aβ as well as its Tyr10 mutant results in a relatively unstable compound I species, which exhibits a fast decay (within a few seconds) (Table 2 and Scheme 1B).
4. Conclusion
In conclusion, low-spin bis-His heme–Aβ reacts with H2O2 to generate stable compound 0 and compound I as reaction intermediates. In comparison with high-spin heme–Aβ, the formation of these reactive intermediates for the low-spin complex is significantly slower and the intermediates are relatively stable. A more stable compound I of low-spin heme–Aβ therefore is mainly responsible for its enhanced peroxidase activity as compared to its high-spin analogue. Notably, the slower formation and greater stability of compound 0 and compound I for low-spin heme–Aβ are attributed to the second sphere interactions, which is different from its high-spin counterpart. Unlike high-spin heme–Aβ, the presence of distal His for the low-spin complex slows down the reaction between heme–Aβ and H2O2, resulting in a slower rate of formation of compound 0, whereas the absence of any preorganized proton source for low-spin heme–Aβ slows down the formation of compound I. In this case, the neighboring water molecule serves as a conduit for the necessary proton transfer (Scheme 1A). The absence of a preorganized proton source for low-spin heme–Aβ is evident from a higher KSIE value of ∼3.5 for compound I formation, which is ∼2 for the high-spin complex due to the presence of a preorganized Arg5 residue in the distal pocket.The stability of compound I for low-spin heme–Aβ on the other hand depends on several factors that include the redox inactivity of the Tyr10 residue and the presence of an array of H-bonding interactions in the distal pocket (Scheme 1A). In comparison to high-spin heme–Aβ, the incapability of Tyr10 to participate in the one electron reduction of compound I for low-spin heme–Aβ can be explained by a possible H-bonding interaction of Tyr10 with distal His (Scheme 1). Such H-bonding interaction moreover strengthens the Fe–His bond, which resists the attack of H2O2 on the heme center (Fig. 12). Thus, in the absence of Tyr10, a greater amount of compound 0 and compound I is formed, which results in a greater peroxidase activity of the low-spin heme–Aβ Tyr10 mutant (Y10F) relative to the wild type. Another important factor for the stability of compound I is the presence of its surrounding water molecules that stabilize the intermediate through H-bonding (Fig. 12). The presence of a bulky substrate such as TMB or serotonin however diminishes this H-bonding network to make compound I reactive. This suggests that compound I of low-spin heme–Aβ can oxidize neurotransmitters like serotonin, which is important in human brain function. Importantly, among all the different forms of Aβ, the oligomers and small aggregates are found to contain significant amounts of low-spin heme–Aβ, relative to larger fibrillary aggregates. Since it is well established that the oligomeric forms of Aβ are most neurotoxic,55–57,62,97 the presence of low spin heme–Aβ in oligomeric aggregates can be detrimental to the AD brain owing to its significantly higher peroxidase activity. This can potentially cause the oxidation of neurotransmitters, a key pathological feature of AD, making this study highly relevant to AD pathogenesis.
Author contributions
S. G. D. and A. D. supervised the project and revised the manuscript. S. G. D. and A. K. N. designed the experiments. A. K. N., M. R. and C. D. performed the experiments. All authors contributed to the data analysis and are involved in the preparation of the manuscript.Conflicts of interest
There are no conflicts to declare.Acknowledgements
We thank DST, SERB India, for financial support (grants EMR/2014/000392 and CRG/2020/000561). A. K. N thanks the Indian Association for the Cultivation of Science and M. R. and C. D. thank the Council of Scientific and Industrial Research for Senior Research Fellowship, respectively.References
- Z. Breijyeh and R. Karaman, Molecules, 2020, 25, 5789 CrossRef CAS PubMed.
- H. Akiyama, S. Barger, S. Barnum, B. Bradt, J. Bauer, G. M. Cole, N. R. Cooper, P. Eikelenboom, M. Emmerling, B. L. Fiebich, C. E. Finch, S. Frautschy, W. S. Griffin, H. Hampel, M. Hull, G. Landreth, L. Lue, R. Mrak, I. R. Mackenzie, P. L. McGeer, M. K. O'Banion, J. Pachter, G. Pasinetti, C. Plata-Salaman, J. Rogers, R. Rydel, Y. Shen, W. Streit, R. Strohmeyer, I. Tooyoma, F. L. Van Muiswinkel, R. Veerhuis, D. Walker, S. Webster, B. Wegrzyniak, G. Wenk and T. Wyss-Coray, Neurobiol. Aging, 2000, 21, 383–421 CrossRef CAS PubMed.
- D. J. Hayne, S. Lim and P. S. Donnelly, Chem. Soc. Rev., 2014, 43, 6701–6715 RSC.
- M. Roy, A. K. Nath, I. Pal and S. G. Dey, Chem. Rev., 2022, 122, 12132–12206 CrossRef CAS PubMed.
- H. Jahn, Dialogues Clin. Neurosci., 2013, 15, 445–454 CrossRef PubMed.
- D. Pramanik, C. Ghosh, S. Mukherjee and S. Ghosh, Coord. Chem. Rev., 2013, 257, 81–92 CrossRef CAS.
- J. Hardy and D. J. Selkoe, Science, 2002, 297, 353–356 CrossRef CAS PubMed.
- F. Kametani and M. Hasegawa, Front. Neurosci., 2018, 12, 25 CrossRef PubMed.
- L. M. F. Gomes, J. C. Bataglioli and T. Storr, Coord. Chem. Rev., 2020, 412, 213255 CrossRef CAS.
- K. P. Kepp, Chem. Rev., 2012, 112, 5193–5239 CrossRef CAS PubMed.
- M. A. Lovell, J. D. Robertson, W. J. Teesdale, J. L. Campbell and W. R. Markesbery, J. Neurol. Sci., 1998, 158, 47–52 CrossRef CAS PubMed.
- Z. Xiao, L. Gottschlich, R. van der Meulen, S. R. Udagedara and A. G. Wedd, Metallomics, 2013, 5, 501–513 CrossRef CAS PubMed.
- A. Rauk, Chem. Soc. Rev., 2009, 38, 2698–2715 RSC.
- A. K. Nath, A. Ghatak, A. Dey and S. G. Dey, Chem. Sci., 2021, 12, 1924–1929 RSC.
- A. Popa-Wagner, S. Mitran, S. Sivanesan, E. Chang and A.-M. Buga, Oxid. Med. Cell. Longevity, 2013, 2013, 963520 Search PubMed.
- C. Garza-Lombó, Y. Posadas, L. Quintanar, M. E. Gonsebatt and R. Franco, Antioxid. Redox Signaling, 2018, 28, 1669–1703 CrossRef PubMed.
- C. Cheignon, M. Tomas, D. Bonnefont-Rousselot, P. Faller, C. Hureau and F. Collin, Redox Biol., 2018, 14, 450–464 CrossRef CAS PubMed.
- T. Storr, Can. J. Chem., 2020, 99, 1–9 CrossRef.
- I. Pal, A. K. Nath, M. Roy, M. Seal, C. Ghosh, A. Dey and S. G. Dey, Chem. Sci., 2019, 10, 8405–8410 RSC.
- S. C. Drew, Front. Neurosci., 2017, 11, 317 CrossRef PubMed.
- E. Karran, M. Mercken and B. De Strooper, Nat. Rev. Drug Discovery, 2011, 10, 698–712 CrossRef CAS PubMed.
- M. Roy, I. Pal, A. K. Nath and S. G. Dey, Chem. Commun., 2020, 56, 4505–4518 RSC.
- Y. Li, M. Nguyen, M. Baudoin, L. Vendier, Y. Liu, A. Robert and B. Meunier, Eur. J. Inorg. Chem., 2019, 2019, 4712–4718 CrossRef CAS.
- J. Zhao, Q. Shi, H. Tian, Y. Li, Y. Liu, Z. Xu, A. Robert, Q. Liu and B. Meunier, ACS Chem. Neurosci., 2021, 12, 140–149 CrossRef CAS PubMed.
- D. Chiabrando, F. Vinchi, V. Fiorito, S. Mercurio and E. Tolosano, Front. Pharmacol., 2014, 5, 61 Search PubMed.
- R. Gozzelino, Curr. Alzheimer Res., 2016, 13, 174–184 CrossRef CAS PubMed.
- A. K. Nath, C. Ghosh, M. Roy, M. Seal and S. Ghosh Dey, Dalton Trans., 2019, 48, 7451–7461 RSC.
- H. Atamna and W. H. Frey, Proc. Natl. Acad. Sci. U. S. A., 2004, 101, 11153–11158 CrossRef CAS PubMed.
- H. Atamna and K. Boyle, Proc. Natl. Acad. Sci. U. S. A., 2006, 103, 3381–3386 CrossRef CAS PubMed.
- A. K. Nath and S. G. Dey, Dalton Trans., 2022, 51, 4986–4999 RSC.
- C. Ghosh, M. Seal, S. Mukherjee and S. Ghosh Dey, Acc. Chem. Res., 2015, 48, 2556–2564 CrossRef CAS PubMed.
- F. J. Wolters, H. I. Zonneveld, S. Licher, L. G. M. Cremers, on behalf of the Heart Brain Connection Collaborative Research Group, M. K. Ikram, P. J. Koudstaal, M. W. Vernooij and M. A. Ikram, Neurology, 2019, 93, e917–e926 CrossRef CAS PubMed.
- A. L. Lumsden, J. T. Rogers, S. Majd, M. Newman, G. T. Sutherland, G. Verdile and M. Lardelli, Front. Neurosci., 2018, 12, 533 CrossRef PubMed.
- Y. Peng, X. Chang and M. Lang, Int. J. Mol. Sci., 2021, 22, 12442 CrossRef CAS PubMed.
- K. M. Cullen, Z. Kócsi and J. Stone, Neurobiol. Aging, 2006, 27, 1786–1796 CrossRef CAS PubMed.
- P. A. Yates, R. Sirisriro, V. L. Villemagne, S. Farquharson, C. L. Masters, C. C. Rowe and For the AIBL Research Group, Neurology, 2011, 77, 48–54 CrossRef CAS PubMed.
- M. Fisher, V. Vasilevko, G. F. Passos, C. Ventura, D. Quiring and D. H. Cribbs, Stroke, 2011, 42, 3300–3303 CrossRef PubMed.
- C.-W. Wu, P.-C. Liao, L. Yu, S.-T. Wang, S.-T. Chen, C.-M. Wu and Y.-M. Kuo, Neurobiol. Dis., 2004, 17, 367–377 CrossRef CAS PubMed.
- H. Atamna, D. W. Killilea, A. N. Killilea and B. N. Ames, Proc. Natl. Acad. Sci. U. S. A., 2002, 99, 14807–14812 CrossRef CAS PubMed.
- Y. El Khoury, A. Schirer, C. Patte-Mensah, C. Klein, L. Meyer, M. Rataj-Baniowska, S. Bernad, D. Moss, S. Lecomte, A.-G. Mensah-Nyagan and P. Hellwig, ACS Chem. Neurosci., 2021, 12, 2940–2945 CrossRef CAS PubMed.
- D. Pramanik and S. G. Dey, J. Am. Chem. Soc., 2011, 133, 81–87 CrossRef CAS PubMed.
- C. Ghosh, S. Mukherjee, M. Seal and S. G. Dey, Inorg. Chem., 2016, 55, 1748–1757 CrossRef CAS PubMed.
- L. C. Berumen, A. Rodríguez, R. Miledi and G. García-Alcocer, Sci. World J., 2012, 2012, 823493 Search PubMed.
- K. Sengupta, S. Chatterjee, D. Pramanik, S. G. Dey and A. Dey, Dalton Trans., 2014, 43, 13377–13383 RSC.
- K. J. Reinikainen, H. Soininen and P. J. Riekkinen, J. Neurosci. Res., 1990, 27, 576–586 CrossRef CAS PubMed.
- L. Volicer, P. J. Langlais, W. R. Matson, K. A. Mark and P. H. Gamache, Arch. Neurol., 1985, 42, 1158–1161 CrossRef CAS PubMed.
- C. C. Meltzer, G. Smith, S. T. DeKosky, B. G. Pollock, C. A. Mathis, R. Y. Moore, D. J. Kupfer and C. F. Reynolds III, Neuropsychopharmacology, 1998, 18, 407–430 CrossRef CAS PubMed.
- J. J. Rodríguez, H. N. Noristani and A. Verkhratsky, Prog. Neurobiol., 2012, 99, 15–41 CrossRef PubMed.
- D. Muck-Seler, P. Presecki, N. Mimica, M. Mustapic, N. Pivac, A. Babic, G. Nedic and V. Folnegovic-Smalc, Prog. Neuro-Psychopharmacol. Biol. Psychiatry, 2009, 33, 1226–1231 CrossRef CAS PubMed.
- G. M. Whitford, Neuropsychobiology, 1986, 15, 133–142 CrossRef CAS PubMed.
- S. Mukherjee, M. Seal and S. G. Dey, JBIC, J. Biol. Inorg. Chem., 2014, 19, 1355–1365 CrossRef CAS PubMed.
- U. Sengupta, A. N. Nilson and R. Kayed, EBioMedicine, 2016, 6, 42–49 CrossRef PubMed.
- E. N. Cline, M. A. Bicca, K. L. Viola and W. L. Klein, J. Alzheimer's Dis., 2018, 64, S567–S610 CAS.
- S. Makin, Nature, 2018, 559, S4–S7 CrossRef CAS PubMed.
- A. K. Sharma, S. T. Pavlova, J. Kim, D. Finkelstein, N. J. Hawco, N. P. Rath, J. Kim and L. M. Mirica, J. Am. Chem. Soc., 2012, 134, 6625–6636 CrossRef CAS PubMed.
- Y. Huang, H.-J. Cho, N. Bandara, L. Sun, D. Tran, B. E. Rogers and L. M. Mirica, Chem. Sci., 2020, 11, 7789–7799 RSC.
- L. Sun, H.-J. Cho, S. Sen, A. S. Arango, T. T. Huynh, Y. Huang, N. Bandara, B. E. Rogers, E. Tajkhorshid and L. M. Mirica, J. Am. Chem. Soc., 2021, 143, 10462–10476 CrossRef CAS PubMed.
- P. D. Josephy, T. Eling and R. P. Mason, J. Biol. Chem., 1982, 257, 3669–3675 CrossRef CAS PubMed.
- L. A. Marquez and H. B. Dunford, Biochemistry, 1997, 36, 9349–9355 CrossRef CAS PubMed.
- C. Bacchella, J. T. Brewster, S. Bähring, S. Dell'Acqua, H. D. Root, G. D. Thiabaud, J. F. Reuther, E. Monzani, J. L. Sessler and L. Casella, Molecules, 2020, 25, 5044 CrossRef CAS PubMed.
- H. Atamna, W. H. Frey II and N. Ko, Arch. Biochem. Biophys., 2009, 487, 59–65 CrossRef CAS PubMed.
- R. Khodarahmi and M. R. Ashrafi-Kooshk, Int. J. Biol. Macromol., 2017, 100, 18–36 CrossRef CAS PubMed.
- G. Smulevich, Biochem. Soc. Trans., 1995, 23, 240–244 CrossRef CAS PubMed.
- T. L. Poulos, Chem. Rev., 2014, 114, 3919–3962 CrossRef CAS PubMed.
- X. Huang and J. T. Groves, Chem. Rev., 2018, 118, 2491–2553 CrossRef CAS PubMed.
- W. D. Hewson and L. P. Hager, J. Biol. Chem., 1979, 254, 3182–3186 CrossRef CAS PubMed.
- S. Yokota and H. Fujii, J. Am. Chem. Soc., 2018, 140, 5127–5137 CrossRef CAS PubMed.
- M. Tanaka, K. Matsuura, S. Yoshioka, S. Takahashi, K. Ishimori, H. Hori and I. Morishima, Biophys. J., 2003, 84, 1998–2004 CrossRef CAS PubMed.
- I. G. Denisov, T. M. Makris and S. G. Sligar, J. Biol. Chem., 2002, 277, 42706–42710 CrossRef CAS PubMed.
- T. Kawano, S. Muto, M. Adachi, H. Hosoya and F. Lapeyrie, Biosci., Biotechnol., Biochem., 2002, 66, 646–650 CrossRef CAS PubMed.
- M. Ibrahim, I. G. Denisov, T. M. Makris, J. R. Kincaid and S. G. Sligar, J. Am. Chem. Soc., 2003, 125, 13714–13718 CrossRef CAS PubMed.
- R. Davydov, T. M. Makris, V. Kofman, D. E. Werst, S. G. Sligar and B. M. Hoffman, J. Am. Chem. Soc., 2001, 123, 1403–1415 CrossRef CAS PubMed.
- H. Kim, P. J. Rogler, S. K. Sharma, A. W. Schaefer, E. I. Solomon and K. D. Karlin, Angew. Chem., Int. Ed., 2021, 60, 5907–5912 CrossRef CAS PubMed.
- A. Singha and A. Dey, Chem. Commun., 2019, 55, 5591–5594 RSC.
- A. Ivancich, G. Mazza and A. Desbois, Biochemistry, 2001, 40, 6860–6866 CrossRef CAS PubMed.
- A. T. Smith, W. A. Doyle, P. Dorlet and A. Ivancich, Proc. Natl. Acad. Sci. U. S. A., 2009, 106, 16084–16089 CrossRef CAS PubMed.
- J. T. Colvin, R. Rutter, H. J. Stapleton and L. P. Hager, Biophys. J., 1983, 41, 105–108 CrossRef CAS PubMed.
- K. J. Paeng and J. R. Kincaid, J. Am. Chem. Soc., 1988, 110, 7913–7915 CrossRef CAS.
- V. Palaniappan and J. Terner, J. Biol. Chem., 1989, 264, 16046–16053 CrossRef CAS PubMed.
- C. M. Hosten, A. M. Sullivan, V. Palaniappan, M. M. Fitzgerald and J. Terner, J. Biol. Chem., 1994, 269, 13966–13978 CrossRef CAS PubMed.
- K. Jayaraj, A. Gold, R. N. Austin, L. M. Ball, J. Terner, D. Mandon, R. Weiss, J. Fischer, A. DeCian, E. Bill, M. Müther, V. Schünemann and A. X. Trautwein, Inorg. Chem., 1997, 36, 4555–4566 CrossRef CAS PubMed.
- K. Sengupta, S. Chatterjee and A. Dey, ACS Catal., 2016, 6, 1382–1388 CrossRef CAS.
- A. Ghatak, S. Bhunia and A. Dey, ACS Catal., 2020, 10, 13136–13148 CrossRef CAS.
- S. Kushal, C. Sudipta, S. Subhra and D. Abhishek, Proc. Natl. Acad. Sci. U. S. A., 2013, 110, 8431–8436 CrossRef PubMed.
- J. R. Kincaid, A. J. Schneider and K. J. Paeng, J. Am. Chem. Soc., 1989, 111, 735–737 CrossRef CAS.
- S. Hashimoto, Y. Tatsuno and T. Kitagawa, Proc. Natl. Acad. Sci. U. S. A., 1986, 83, 2417–2421 CrossRef CAS PubMed.
- S. Bhakta, A. Nayek, B. Roy and A. Dey, Inorg. Chem., 2019, 58, 2954–2964 CrossRef CAS PubMed.
- A. Robert and B. Meunier, ACS Nano, 2022, 16, 6956–6959 CrossRef CAS PubMed.
- S. Scott, H. Zhao, A. Dey and T. B. Gunnoe, ACS Catal., 2020, 10, 14315–14317 CrossRef CAS.
- B. Meunier and A. Robert, J. Phys. Chem. C, 2019, 123, 28513–28514 CrossRef CAS.
- Y. Lu, S. M. Berry and T. D. Pfister, Chem. Rev., 2001, 101, 3047–3080 CrossRef CAS PubMed.
- M. Vidakovic, S. G. Sligar, H. Li and T. L. Poulos, Biochemistry, 1998, 37, 9211–9219 CrossRef CAS PubMed.
- S. Chatterjee, K. Sengupta, B. Mondal, S. Dey and A. Dey, Acc. Chem. Res., 2017, 50, 1744–1753 CrossRef CAS PubMed.
- D. Pramanik, C. Ghosh and S. G. Dey, J. Am. Chem. Soc., 2011, 133, 15545–15552 CrossRef CAS PubMed.
- W. Lan, Z. Wang, Z. Yang, T. Ying, X. Zhang, X. Tan, M. Liu, C. Cao and Z.-X. Huang, PLoS One, 2014, 9, e107305 CrossRef PubMed.
- R. Lonsdale, J. Oláh, A. J. Mulholland and J. N. Harvey, J. Am. Chem. Soc., 2011, 133, 15464–15474 CrossRef CAS PubMed.
- A. L. Lublin and S. Gandy, Mt. Sinai J. Med., 2010, 77, 43–49 CrossRef PubMed.
Footnote |
| † Electronic supplementary information (ESI) available. See DOI: https://doi.org/10.1039/d2sc05008k |
| This journal is © The Royal Society of Chemistry 2022 |

