 Open Access Article
Creative Commons Attribution 3.0 Unported Licence
Ionophore-based ion-selective electrodes: signal transduction and amplification from potentiometry
Jingying
Zhai
*a,
Dajing
Yuan
*b and
Xiaojiang
Xie
 *c
*c
aAcademy for Advanced Interdisciplinary Studies, Southern University of Science and Technology, Shenzhen, 518055, China. E-mail: zhaijy@sustech.edu.cn
bAnhui Key Laboratory of Chemo-Biosensing, College of Chemistry and Materials Science, Anhui Normal University, Wuhu, 241000, PR China. E-mail: dajing.yuan@ahnu.edu.cn
cDepartment of Chemistry, Southern University of Science and Technology, Shenzhen, 518055, China. E-mail: xiexj@sustech.edu.cn
First published on 14th January 2022
Abstract
Ionophore-based ion-selective electrodes (ISEs) are traditionally used in potentiometry to measure the open circuit potential against a reference electrode. However, the sensitivity of ISEs is limited by the well-known Nernstian slope, which is not satisfactory for application in a narrow sample concentration range. Recently, several innovative methods have been proposed to develop chemical ion sensors by transducing the electrode potential into other electrochemical and optical signals including charge, current, electrochemiluminescence, fluorescence, and color change. These approaches result in signal amplification and increased sensitivity. Moreover, they enable user-friendly colorimetric and self-powered sensing concepts that are very attractive to point-of-care testing and environmental monitoring. The sensing concepts are highlighted in this perspective along with a discussion on the outstanding issues and challenges for the future.
Introduction
Ion-selective electrodes (ISEs) containing ionophores are a well-known family of chemical sensors with wide application in clinical diagnosis, environmental monitoring, and other fields. ISEs are typically utilized in potentiometry, where the open-circuit potential is recorded at zero current condition against a reference electrode.1,2 The electrode potential changes linearly with the logarithm of the activity of the target ions in the sample in the Nernst response region.ISEs are advantageous due to their versatility, low cost and power consumption, and high selectivity due to a variety of ionophores.1,3–14 The potentiometric sensor response has been theoretically well described by the phase-boundary potential model.15 The Nikolsky–Eisenman formula and Bakker's modification can be used to account for interfering ions.16 For a number of cations such as K+, Na+, and Ca2+, excellent selectivity values have been achieved with corresponding optimized ionophores for routine use in biological samples.
Recently, improving the sensitivity of potentiometric ISEs has been regarded an important task especially for samples with a narrow target ion concentration range. With a ten-fold primary ion activity change in the Nernstian response range, the theoretical potential ideally changes by 2.303 RT/zF, with R, T, z, F representing the ideal gas constant, temperature in Kelvin, valence of the ion, and Faraday's constant, respectively. For example, the K+, Na+, and Cl− concentrations in healthy human serum are respectively in the range of 3.5 to 5.0 mM, 135 to 145 mM, and 96 to 106 mM. According to the Nernst equation, these concentrations cause electrode potential changes of 9.5, 1.9, and 2.6 mV at 37 °C, respectively. In environmental monitoring, the pH of seawater is closely associated with anthropogenic CO2 emission and the sustainability of marine ecosystems.17–21 The average pH of surface seawater has dropped by 0.1 units since the industrial revolution and is still decreasing at a rate of ca. 0.002 units per year. For common potentiometric glass electrodes, the precision of 0.003 pH units is not sufficient to accurately trace the pH changes of oceanic water. Accounting for the errors from signal drift and liquid junction potentials from the reference electrode,22,23 improving the sensitivity of potentiometric ISEs undoubtedly becomes a meaningful task for the wider application of ISEs.
During the past few decades, innovative studies have been reported on improving the sensitivity by converting the electrode potential into other electrochemical or optical signals. In this invited contribution, we aim to highlight the principle and characteristics of these new signal transduction approaches and discuss the issues requiring further research.
Coulometric readout of solid-contact ISEs (SC-ISEs) with conducting polymer
Bobacka's group introduced a coulometric signal transduction principle with solid contact ISEs (SC-ISEs).24 As shown in Fig. 1a, the potential between the SC-ISE and the reference electrode is held constant at 0 V and the current between the SC-ISE and the counter electrode is monitored over time.24 The SC-ISE contains a cation-sensitive membrane and a conducting polymer layer as the ion-to-electron transducer, such as poly(3,4-ethylenedioxythiophene) (PEDOT) doped with poly(styrenesulfonate) (PSS). A change of primary ion activity in the sample will change the phase-boundary potential at the sample-membrane interface by ΔE, which will be compensated by the redox reaction in the conducting polymer layer. A transient current then starts to flow until the SC-ISE reaches equilibrium again and there is no more voltage difference between the SC-ISE and the reference electrode. Integration of the current over time results in the total charge, which is used to quantify the primary ion activity. Fig. 1b and c show the profiles of the transient current and the cumulative charge over time for a K+-selective SC-ISE where the K+ concentration was changed between 0.01 and 0.02 M. | (1) |
 | (2) |
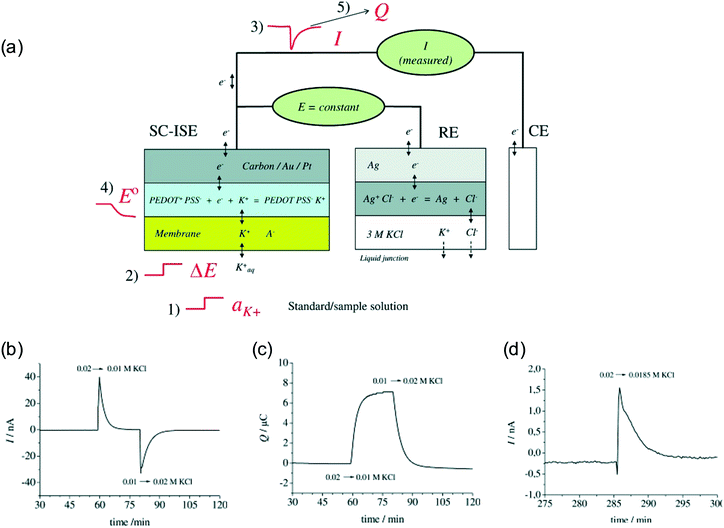 | ||
| Fig. 1 (a): The working principle of constant potential coulometry with SC-ISEs and the conducting polymer transducer. A change of sample K+ activity (1) causes a change of boundary potential ΔE (2), which in turn causes a transient current (3). The current results in the redox of the conducting polymer layer and changes the standard potential of the SC-ISE (4). Integration of the current over time gives the cumulated charge (5). (b): Experimental transient current over time when the sample was changed between 0.02 M and 0.01 M KCl. (c): Cumulated charge upon the indicated sample KCl change. (d): Experimental transient current upon sample KCl change from 0.02 to 0.0185 M. Adapted from ref. 24. Copyright: Wiley-VCH. | ||
With the change of sample ion activity, the transient current decays exponentially, which resembles a typical charging current in a RC circuit. Bakker and Bobacka proposed a capacitive model to account for the coulometric signal transduction readout of SC-ISEs with conducting polymers.25 From the model, the current decays according to eqn (1) when the primary ion activity changes from ai (initial) to ai (final), where s is the slope of the ISE, zi is the charge of the primary ion, Rcell is the resistance of the electrochemical cell and Ccp is the capacitance of the conducting polymer layer. The model was well correlated with the experimental Cl−-selective SC-ISE and could be applied to other SC-ISEs as well. For simplicity, this model did not take into account the concentration polarization due to the current pulse, which was later modified by Mikhelson et al. by introducing a Contrellian term as expressed in eqn (2), where N is a constant associated with the electrode cross-sectional area.26
The influence of electrode geometry, thickness of the ion-selective membrane (ISM), and divalent target ions such as Ca2+ and Pb2+ were also systematically studied.27–29 According to eqn (1) and (2), the current increases with decreasing resistance, which means a thin ISM with large cross-sectional area is beneficial. The coulometric response of nitrate, perchlorate, and sulfate solid-contact anion-sensitive electrodes was also recently realized.30 Therefore, the platform is potentially applicable to a variety of cations and anions.
Compared with traditional potentiometric ISEs, the new method, coined as constant potential coulometry, is able to detect very small changes of target ion activity. For example, Fig. 1d shows the transient current change between 0.02 and 0.0185 M K+.24 According to the authors, the method could differentiate a change of 5 μM at a concentration of 5 mM K+, representing only a 0.1% change of K+ activity.28 Increasing charge capacity of the conducting polymer helps further enhance the sensitivity but also leads to longer data acquisition time.25,28–31 The time constant in eqn (1) and (2) increases with increasing capacitance and resistance, and is typically a few minutes. There is also a baseline drift due to the conducting polymers, which will be discussed later. Therefore, it is still challenging to follow very rapid sample ion concentration change.
Besides conducting polymers, Qin and co-workers also used a layer of ordered mesoporous carbon as the ion-to-electron transducer for NO3−-selective SC-ISEs.32 Prussian blue was also adopted in the study of the capacitive model to detect Na+.25 In the case of Pb2+ selective ISEs, the current response was found to be limited by the ion transport in the conducting polymer layer, which is likely caused by the sequestration of Pb2+ by PEDOT(PSS).29 Additionally, repeated redox of the conducting polymers is known to cause an irreversible decrease of charge capacity and stability. Therefore, the material serving as the ion-to-electron transducing layer is very important and can be further explored.
ISE in series with electronic capacitor
While the constant potential coulometry with SC-ISEs was able to enhance the sensitivity by increasing the charge capacity of the conducting polymers, the sample time remained relatively long (several to tens of minutes) and there was a drift of residual current of the baseline. To eliminate the baseline drift and shorten the sample time, Bakker and coworkers recently proposed a coulometric method for ISEs by introducing an electronic capacitor into the electrochemical cell.33–37 As shown in Fig. 2a, the electronic capacitor was connected in series with the ISM.34 The open-circuit potential (OCP) was maintained according to the reference solution and the current between the working and the auxiliary electrode was recorded over time. Similar to SC-ISEs, the change of sample ion concentration requires the circuit to compensate for the electrode potential at the sample-ISM interface, which is fulfilled here by the charging electronic capacitor.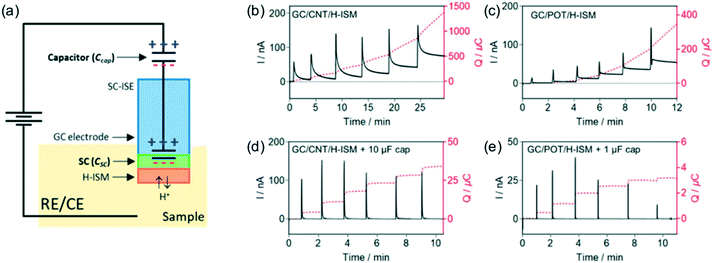 | ||
| Fig. 2 (a): An illustration of an electronic transistor connected in series with a SC-ISE for operation under constant applied potential. (b): Chronoamperometric (solid black line) and chronocoulometric (dashed red line) response of GC/CNT/H-ISE without a capacitor for the measurement of pH. (c): Chronoamperometric and chronocoulometric response of GC/POT/H-ISE without a capacitor for the measurement of pH in the same sample. (d): Chronoamperometric and chronocoulometric response of GC/CNT/H-ISE with a capacitor for the measurement of pH. (e): Chronoamperometric and chronocoulometric response of GC/POT/H-ISE with a capacitor for the measurement of pH in the same sample. Sample: 10 mM universal buffer and 10 mM NaCl. Adapted from ref. 34. Copyright: American Chemical Society. | ||
Compared with the conducting polymer POT and carbon nanotubes (CNTs), shown in Fig. 2b and c, the charging of electronic capacitors required a much shorter time. With a conducting polymer such as POT, charging and discharging are connected with the transport of compensating ionic sites in the ISM, which leads to a long response time. As shown in Fig. 2d and e, the observed current transients stabilized within a few minutes when the electronic capacitor was added. The principle was demonstrated with Ag/AgCl to measure Cl−. Using tridodecylamine as an H+ ionophore, ultrasensitive pH measurements were achieved with dramatically higher precision compared to conventional potentiometry. A pH difference of 0.001 units was easily differentiated in seawater and buffer solutions. However, high resistance between the working and counter electrodes lowered the observed transient current, which unfortunately forbids the use of the state-of-the-art glass electrode because of the high resistance (50 to 500 MΩ).
SC-ISEs were compatible with the electronic capacitors. With appropriate choice of the electronic capacitor, electrical charges are dominantly cumulated on the electronic transistor according to Kirchhoff's law. Further, the charge in an electronic capacitor can be stored during the sensing process for further readout. A self-powered sensing concept was introduced based on the capacitors and successfully applied to detect physiological concentrations of K+ in artificial sweat samples.37 Furthermore, information memorized in the capacitor could be used to develop deployable sensors to monitor sample changes within a defined period of time. This was recently demonstrated to identify incurred pH changes in a river water sample during an interval of 2 h.36 Therefore, adding electronic capacitors to ISEs not only increased the sensitivity but also resulted in new applications that are inaccessible with traditional potentiometry.
Converting electrode potential to optical signals
Recently, the potentials of ISEs have been converted into optical signals and in some cases the sensitivity was also improved. With optical signals, the sensor could be remotely interrogated and multiple analytes could be differentiated at different wavelengths. In addition, colorimetric sensors can be analyzed by the naked eye. Ionophore-based optical sensors are widely recognized with superior selectivity compared to water soluble ion indicators.1,3,38–40 However, the measurements depend on the concentration of a reference ion such as H+ as well as positively charged dyes.41–54 Secondly, traditional optical sensors generate signals directly in the samples, which could suffer from the color, autoluminescence, and turbidity of the sample. Although sample pretreatment with paper-based devices and hydrogels have been integrated in ion-selective optical sensors,54–64 complete separation between the sample and detection compartments could overcome potential background optical interference.Through signal transduction from ISEs, Bakker and coworkers first converted the electrode potential into electrogenerated chemiluminescence (ECL).65,66 As shown in Fig. 3a, a K+ ISE was used as a reference electrode to modulate the potential of a working electrode where ECL was produced. Ruthenium bipyridine complexes are widely used to generate ECL in the presence of a sacrificial amine. Changing the K+ activity shifted the reference potential and resulted in the shift of the ECL peak during a linear voltage scan, which was detected by a photomultiplier tube (PMT). The approach was later extended to the chronopotentiometric mode with improved sensitivity over narrow concentration ranges.67
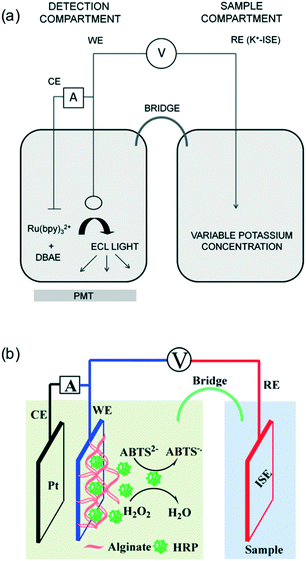 | ||
| Fig. 3 (a): An illustration of the setup to convert the potential of a potassium ISE in the sample compartment to an ECL signal in the detection chamber where the oxidation of Ru(bpy)32+ and 2-(dibutylamino)ethanol (DBAE) produces light at the gold electrode surface. The evolution of ECL during a linear scan of applied potential was recorded with a PMT. Adapted from ref. 65. (b): An illustration of the optical ion-sensing platform based on ISE-modulated release of the enzyme HRP from alginate gel. The released HRP was used to catalyze ABTS2− to form the green ABTS−˙. Adapted from ref. 68. Copyright: American Chemical Society. | ||
With a similar three-electrode setup, Qin and coworkers utilized the potential of ISEs to control the release of the enzyme horseradish peroxidase (HRP) from an iron–alginate gel layer.68 As shown in Fig. 3b, the gel layer was deposited on top of the working electrode and the ISE was placed in the sample solution and physically separated from the detection compartment. The release of HRP was indirectly controlled by the reduction of Fe3+ to Fe2+, which decreased the hydrogel crosslinking. The released HRP was then collected to catalyze the oxidation of 2,2′-azino-bis(3-ethylbenzothiozoline-6-sulfonic acid) (ABTS) by H2O2, generating a green color. The platform was applied for the visual detection of NH4+ and Cl− using their corresponding SC-ISEs.
In the abovementioned approaches, the ECL chemical reagents in the detection compartment and the HRP-related kit all require special care during sample preparation, storage, and handling. To simplify the process, Xie and coworkers used a light emitting diode (LED) as the optical signal source.69 As shown in Fig. 4a, a LED was integrated into the electrochemical cell for chronoamperometry with an ISE serving as the reference electrode. With fixed applied potential, the potential change of the ISE was grafted across the LED, resulting in a change of light intensity. The advantages of using LEDs include their low cost, long lifetime and stability. Moreover, as shown in Fig. 4b and c, recording the light intensity with a photomultiplier tube (PMT) offered excellent resolution to differentiate small changes of sample ion activity. Using a combination of LEDs with different color may also lead to naked-eye-observable color change, which could be explored in the future.
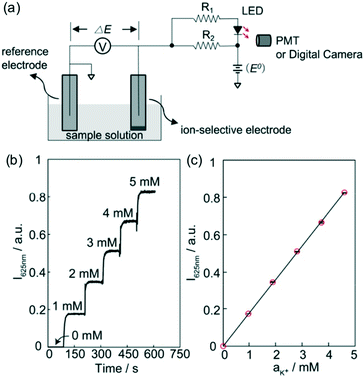 | ||
| Fig. 4 (a): Schematic illustration of the electrochemical-to-optical signal transduction principle under chronopotentiometry control. The voltage applied across the LED was modulated by the potential of an ISE that was physically separated. (b): Change of LED light intensity at 625 nm monitored with PMT when the sample K+ concentration increased from 0 to 5 mM as indicated. (c): The linear calibration of the light intensity against K+ activity. Adapted from ref. 69. Copyright: American Chemical Society. | ||
However, the ECL and LED approaches still require sophisticated instrumentation such as PMT. Using visual color change as the signal could dramatically decrease the cost. The Bakker group recently reported a different strategy to convert potential into visually detectable signals.70 As shown in Fig. 5a, this approach takes advantage of one or several bipolar electrodes where an ionophore-based potentiometric ISE is connected to a detection compartment. In the detection compartment, a redox indicator is transformed between different oxidation states with different color. A thin layer (50 μm) of ferroin (10 mM) was dissolved with 100 mM KCl between an ITO electrode and a Ag/AgCl foil. Similar to what happens in constant potential coulometry, at fixed applied potential, any change of electrode potential of the ISE is compensated by the redox of ferroin in the detection chamber until a new equilibrium is established. Ferroin is a well-known redox indicator that changes from red to blue on oxidation. This approach was successfully demonstrated with ISEs for Na+, K+, Ca2+, Cl−, CO32−, and pH.70,71Fig. 5b shows the vivid color of the detection chamber with different real samples. This approach is also attractive in that the colorimetric dynamic range could be tuned by the applied potential such that color change occurs in the analyte concentration range of interest.
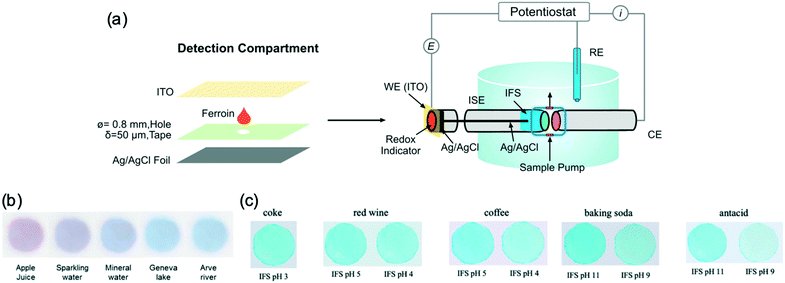 | ||
| Fig. 5 (a): Construction of the closed bipolar electrode system to physically separate the detection compartment from the sample. The detection compartment, filled with a thin layer of the redox indicator ferroin, is connected with an ISE. WE: working electrode. RE: reference electrode. CE: counter electrode. IFS: inner filling solution. (b): Images captured in the detection compartment for different samples at which a potential at 1.10 V is applied. (c): Photographs of the Prussian Blue films in the detection compartment of the self-powered bipolar pH sensor with different IFS. Adapted from ref. 10 and 70. Copyright: American Chemical Society. | ||
However, the redox of ferroin in a thin layer is limited by mass transport, which makes the sensor response relatively long (several minutes). This was improved by using a layer of electrochromic materials on the transparent electrode to replace the ferroin solution. The conversion between Prussian blue and Prussian white was demonstrated in a potentiometric sensing array.10,72 The response time was shortened to 11 s (t95%) compared with the estimated 3 min of the ferroin-based sensors.72 The sensors can be self-powered as well given their relatively low circuit resistance. This was recently demonstrated for pH measurements over a wide range of 2 to 10.5 and in real samples including coffee, coke, red wine, baking soda, and antacid (Fig. 5c).10 However, the sensitivity of the color change is not as good as that with pH sensors operating in potentiometry and coulometry.
Other signal transducers were employed in the bipolar system including Zn2+, poly(3-octylthiophene) (POT), and polyaniline (PANi). PANi was used with reverse dialysis and changed color in response to different nitrate concentrations.73 As shown in Fig. 6a, the electrogenerated Zn2+ was complexed by a ligand to result in fluorescence that increased with increasing sample K+ concentration. More directly, the redox of POT (Fig. 6b) caused significant fluorescence change of the polymer layer with changing sample chloride concentration.74 However, similar to measuring the light from ECL and LED, the quantitative analysis of fluorescence intensity is also instrumentally demanding. In addition, the sensitivity and other comparisons between fluorescence and classical potentiometry need to be fully characterized in the future.
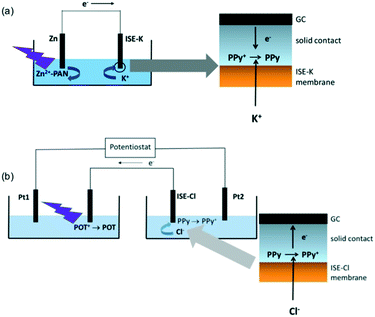 | ||
| Fig. 6 Schemes of the reported bipolar ISE systems to convert potential to the fluorescence change of POT (a) or for the fluorescence determination of zinc ion concentration change. Adapted from ref. 73 and 74. Copyright: Wiley-VCH and Elsevier, respectively. | ||
ISEs coupled to photoelectrodes
Ding and Qin reported a strategy to convert the potential of ISEs into photoelectric current.75 As shown in Fig. 7a, a Ca2+-selective electrode was used in the reference channel to predefine the actual working electrode potential. The working electrode was coated with a ZnSe/r-GO composite that shows a photoelectric effect. Upon white light irradiation, a photocurrent was generated and the current intensity was modulated by the reference potential of the ISE. Fig. 7b shows the TEM image of the prepared ZnSe/r-GO, which was found to influence the intensity of the photocurrent (Fig. 7c). ZnG-1, 2, 3, 4 and 5 indicate ZnSe/r-GO composites with different levels of GO (10, 20, 30, 40, and 50 mg, respectively). Therefore, the choice of photoelectrode materials is very important to obtain high sensitivity and stable current. Commercial photoelectrodes can also be attempted in the future considering their excellent stability. Fig. 7d and e show the change of photoelectric current over a narrow Ca2+ concentration range from 4.2 to 6.1 mM. Due to the enhanced sensitivity, the method was successfully applied to determine the calcium concentrations in seawater samples with high resolution.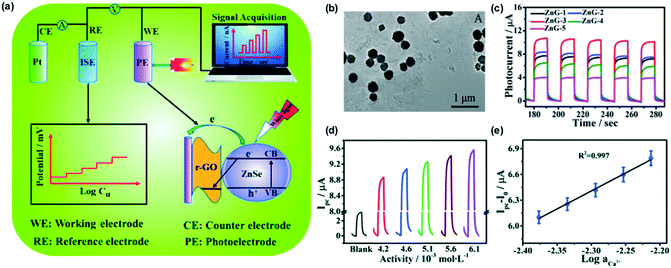 | ||
| Fig. 7 (a): An illustration of the PEC sensing platform to read the potentiometric response of an ISE. (b): TEM image of the as-prepared ZnSe/r-GO. (c): Time traces of the photocurrent responses of ZnG-1, 2, 3, 4, and 5 composite photoelectrodes at a potential of 0.25 V. (d): Photocurrent responses of the ZnSe/r-GO modified GE electrodes with variable calcium activities from 4.2 to 6.1 mM. (e): Corresponding calibration curve. Adapted from ref. 75. Copyright: Royal Society of Chemistry. | ||
Following a similar principle, Yin and Yuan replaced the photoelectrode with a glassy carbon electrode for the non-enzymatic amperometric measurements of H2O2.76 H2O2 was oxidized at the glassy carbon working electrode to O2 at a fixed potential relative to the ISE, which was connected to the reference channel. Changing the potential of the ISEs resulted in a change of anodic current. The method was evaluated with SC-ISEs for Ca2+ and NO3− and showed better or comparable sensitivity with respect to potentiometric ISEs.
Summary and outlook
Potentiometric ISEs have been limited by the Nernstian slope, which is not sufficiently sensitive. There has been a growing interest in increasing sensitivity by converting the potentiometric response of ISEs to various other signals including charge, current, color and fluorescence. One could argue that classical potentiometry would be sufficiently sensitive if the measurement of Nernst voltage could reach microvolt-precision without suffering electromagnetic interference. Unfortunately, this is not the case in practice and it seems the precise and accurate measurement of current is more attainable in many cases.We categorized the proposed strategies according to the form of signal output. It is difficult to conclude which one is best suited depending on the intended application. For fixed potential coulometry with SC-ISEs, the sluggish redox kinetics of the conducting polymer caused a long interrogation time and a baseline drift. The introduction of an electronic capacitor shortened the measurement to a reasonable time of around 10 s, but this is still longer than classical potentiometry. For high-throughput applications such as the routine clinical measurement of body fluids, the sample time still seems too long. Secondly, repeated use of the electrodes with current passing through the conducting polymer could lead to degradation and decreased sensitivity. With electronic capacitors, it is important to choose the proper capacitance and fully discharge it after each measurement to avoid charge accumulation, which was recently demonstrated by automatic electronic control.35 The long-term stability of the method is yet to be optimized and the automation of sample handling is highly recommended. Nonetheless, the enhancement of sensitivity has been fully characterized, and this is the most prominent among existing ion-selective methodologies.
By connecting an ISE to the reference channel, the electrode potential was converted to different optical signals including ECL, light of LED, enzyme-catalyzed color change, and electrochromism. The new optical signal transductions energized the field by making ion-selective sensors promising for point-of-care testing and on-site environmental tests. Some key features include 1) the separation of the detection compartment from the sample to avoid optical interference; 2) establishing ion-selective optical sensing without a second reference ion. However, the change of light intensity is not accurately perceived by the naked eye and requires instrumentation for quantitative analysis. Additionally, the quantitation from color change is not sensitive especially with the naked eye. Therefore, it is difficult to directly compare the sensitivity with classical potentiometric ISEs. Although image analysis with software can provide the numbers in hue or RGB values, the precision is still influenced by external environmental factors during image acquisition. The release of the enzyme HRP and the subsequent reactions, generating ECL, and the color change from the electrochromic materials also require rigorous handling of reagent solutions, which is not very user-friendly for automation and standardization. The LED-based approach is very attractive in terms of stability and cost. However, accurate measurement of the light intensity change requires PMT.
To summarize, recent advances have shown that the sensitivity limit of potentiometric ISEs can be improved with various signal transduction approaches. While the sensitivity was delightfully enhanced, there are different trade-offs to consider, such as long sample time and heavy instrumentation. However, research into signal transduction also resulted in a number of new sensing concepts such as self-powered and naked-eye detection. Based on the encouraging results summarized herein, we believe there is a bright future following continued research in this emerging field.
Conflicts of interest
There are no conflicts to declare.Acknowledgements
The authors thank the National Natural Science Foundation of China (B040401, 21874063) and Department of Education of Guangdong Province (2019KTSCX154) for financial support. Y. D. acknowledges the support from the Natural Science Foundation of Anhui Province (2108085QB67).Notes and references
- E. Bakker, P. Bühlmann and E. Pretsch, Chem. Rev., 1997, 97, 3083–3132 CrossRef CAS PubMed.
- E. Bakker, TrAC, Trends Anal. Chem., 1997, 16, 252–260 CrossRef CAS.
- P. Bühlmann, E. Pretsch and E. Bakker, Chem. Rev., 1998, 98, 1593–1687 CrossRef PubMed.
- E. Bakker and E. Pretsch, Angew. Chem., Int. Ed., 2007, 46, 5660–5668 CrossRef CAS PubMed.
- S. C. Ma, V. C. Yang and M. E. Meyerhoff, Anal. Chem., 1992, 64, 694–697 CrossRef CAS PubMed.
- C. C. Young, J. Chem. Educ., 1997, 74, 177–182 CrossRef CAS.
- L. Qi, T. Jiang, R. Liang and W. Qin, Anal. Chem., 2021, 93, 6932–6937 CrossRef CAS PubMed.
- C. R. Rousseau and P. Bühlmann, TrAC, Trends Anal. Chem., 2021, 140, 116277 CrossRef CAS.
- S. S. Sandhu, Y. G. Kotagiri, P. U. A. I. Fernando, M. Kalaj, N. Tostado, H. Teymourian, E. M. Alberts, T. L. Thornell, G. R. Jenness, S. P. Harvey, S. M. Cohen, L. C. Moores and J. Wang, J. Am. Chem. Soc., 2021, 143, 18261–18271 CrossRef CAS PubMed.
- S. Jansod and E. Bakker, Anal. Chem., 2021, 93, 4263–4269 CrossRef CAS PubMed.
- M. Rostampour, B. Bailey, C. Autrey, K. Ferrer, B. Vantoorenburg, P. K. Patel, P. Calvo-Marzal and K. Y. Chumbimuni-Torres, Anal. Chem., 2021, 93, 1271–1276 CrossRef CAS PubMed.
- J. Xu, Z. Zhang, S. Gan, H. Gao, H. Kong, Z. Song, X. Ge, Y. Bao and L. Niu, ACS Sens., 2020, 5, 2834–2842 CrossRef CAS PubMed.
- F. Zhao, Y. Liu, H. Dong, S. Feng, G. Shi, L. Lin and Y. Tian, Angew. Chem., Int. Ed., 2020, 59, 10426–10430 CrossRef CAS PubMed.
- Q. Chen, L.-P. Yang, D.-H. Li, J. Zhai, W. Jiang and X. Xie, Sens. Actuators, B, 2021, 326, 128836 CrossRef CAS.
- E. Bakker, P. Bühlmann and E. Pretsch, Talanta, 2004, 63, 3–20 CrossRef CAS PubMed.
- E. Bakker, R. K. Meruva, E. Pretsch and M. E. Meyerhoff, Anal. Chem., 1994, 66, 3021–3030 CrossRef CAS PubMed.
- K. Caldeira and M. E. Wickett, Nature, 2003, 425, 365 CrossRef CAS PubMed.
- J. C. Orr, V. J. Fabry, O. Aumont, L. Bopp, S. C. Doney, R. A. Feely, A. Gnanadesikan, N. Gruber, A. Ishida, F. Joos, R. M. Key, K. Lindsay, E. Maier-Reimer, R. Matear, P. Monfray, A. Mouchet, R. G. Najjar, G.-K. Plattner, K. B. Rodgers, C. L. Sabine, J. L. Sarmiento, R. Schlitzer, R. D. Slater, I. J. Totterdell, M.-F. Weirig, Y. Yamanaka and A. Yool, Nature, 2005, 437, 681–686 CrossRef CAS PubMed.
- S. C. Doney, V. J. Fabry, R. A. Feely and J. A. Kleypas, Annu. Rev. Mar. Sci., 2009, 1, 169–192 CrossRef PubMed.
- E. B. Osborne, R. C. Thunell, N. Gruber, R. A. Feely and C. R. Benitez-Nelson, Nat. Geosci., 2020, 13, 43–49 CrossRef CAS.
- R. Wang, X. Du, J. Zhai and X. Xie, ACS Sens., 2019, 4, 1017–1022 CrossRef CAS PubMed.
- W. E. Morf, E. Pretsch and N. F. D. Rooij, J. Electroanal. Chem., 2007, 602, 43–54 CrossRef CAS PubMed.
- W. E. Morf, The Principles of Ion-Selective Electrodes and of Membrane Transport, Elsevier Science, 1981, vol. 2 Search PubMed.
- E. Hupa, U. Vanamo and J. Bobacka, Electroanalysis, 2015, 27, 591–594 CrossRef CAS.
- Z. k. Jarolímová, T. Han, U. Mattinen, J. Bobacka and E. Bakker, Anal. Chem., 2018, 90, 8700–8707 CrossRef PubMed.
- Y. O. Kondratyeva, E. G. Tolstopjatova, D. O. Kirsanov and K. N. Mikhelson, Sens. Actuators, B, 2020, 310, 127894 CrossRef CAS.
- T. Han, U. Vanamo and J. Bobacka, ChemElectroChem, 2016, 3, 2071–2077 CrossRef CAS.
- T. Han, U. Mattinen and J. Bobacka, ACS Sens., 2019, 4, 900–906 CrossRef CAS PubMed.
- T. Han, Z. Mousavi, U. Mattinen and J. Bobacka, J. Solid State Electrochem., 2020, 24, 2975–2983 CrossRef CAS.
- T. Han, U. Mattinen, Z. Mousavi and J. Bobacka, Electrochim. Acta, 2021, 367, 137566 CrossRef CAS.
- U. Vanamo, E. Hupa, V. Yrjänä and J. Bobacka, Anal. Chem., 2016, 88, 4369–4374 CrossRef CAS PubMed.
- H. Wang, B. Yuan, T. Yin and W. Qin, Anal. Chim. Acta, 2020, 1129, 136–142 CrossRef CAS PubMed.
- P. Kraikaew, S. p. Jeanneret, Y. Soda, T. Cherubini and E. Bakker, ACS Sens., 2020, 5, 650–654 CrossRef CAS PubMed.
- P. Kraikaew, S. K. Sailapu and E. Bakker, Anal. Chem., 2020, 92, 14174–14180 CrossRef CAS PubMed.
- P. Kraikaew, S. K. Sailapu and E. Bakker, Sens. Actuators, B, 2021, 344, 130282 CrossRef CAS.
- S. K. Sailapu, N. Sabaté and E. Bakker, ACS Sens., 2021, 6, 3650–3656 CrossRef CAS PubMed.
- S. K. Sailapu, P. Kraikaew, N. Sabaté and E. Bakker, ACS Sens., 2020, 5, 2909–2914 CrossRef CAS PubMed.
- G. Mistlberger, G. A. Crespo and E. Bakker, Annu. Rev. Anal. Chem., 2014, 7, 483–512 CrossRef PubMed.
- X. Xie and E. Bakker, Anal. Bioanal. Chem., 2015, 407, 3899–3910 CrossRef CAS PubMed.
- X. Du and X. Xie, Sens. Actuators, B, 2021, 335, 129368 CrossRef CAS.
- E. Stelmach, E. Nazaruk, K. Maksymiuk and A. Michalska, Anal. Chem., 2021, 93, 13106–13111 CrossRef CAS PubMed.
- W. E. Morf, K. Seiler, B. Rusterholz and W. Simon, Anal. Chem., 1990, 62, 738–742 CrossRef CAS.
- C. Krause, T. Werner, C. Huber and O. S. Wolfbeis, Anal. Chem., 1999, 71, 5304–5308 CrossRef CAS PubMed.
- X. Xie, J. Zhai and E. Bakker, J. Am. Chem. Soc., 2014, 136, 16465–16468 CrossRef CAS PubMed.
- J. Zhai, X. Xie and E. Bakker, Anal. Chem., 2015, 87, 12318–12323 CrossRef CAS PubMed.
- X. Xie and E. Bakker, Anal. Chem., 2015, 87, 11587–11591 CrossRef CAS PubMed.
- X. Xie, A. Gutierrez, V. Trofimov, I. Szilagyi, T. Soldati and E. Bakker, Anal. Chem., 2015, 87, 9954–9959 CrossRef CAS PubMed.
- R. Wang, X. Du, X. Ma, J. Zhai and X. Xie, Analyst, 2020, 145, 3846–3850 RSC.
- R. Wang, Y. Zhou, N. G. Ghalehjoughi, Y. Mawaldi and X. Wang, Anal. Chem., 2021, 93, 13694–13702 CrossRef CAS PubMed.
- L. Wang, S. Sadler, T. Cao, X. Xie, J. M. V. Filseck and E. Bakker, Anal. Chem., 2019, 91, 8973–8978 CrossRef CAS PubMed.
- W. Yang, J. Zhai and X. Xie, Analyst, 2019, 144, 5617–5623 RSC.
- Y. Tang, J. Zhai, Q. Chen and X. Xie, Analyst, 2021, 146, 6955–6959 RSC.
- L. Wang, X. Xie, J. Zhai and E. Bakker, Chem. Commun., 2016, 52, 14254–14257 RSC.
- Y. Soda, D. Citterio and E. Bakker, ACS Sens., 2019, 4, 670–677 CrossRef CAS PubMed.
- X. Du, J. Zhai, X. Li, Y. Zhang, N. Li and X. Xie, ACS Sens., 2021, 6, 1990–2001 CrossRef CAS PubMed.
- X. Du, J. Zhai, D. Zeng, F. Chen and X. Xie, Sens. Actuators, B, 2020, 319, 128300 CrossRef CAS.
- X. Du and X. Xie, ACS Sens., 2017, 2, 1410–1414 CrossRef CAS PubMed.
- X. Wang, Y. Qin and M. E. Meyerhoff, Chem. Commun., 2015, 51, 15176–15179 RSC.
- X. Wang, Q. Zhang, C. Nam, M. Hickner, M. Mahoney and M. E. Meyerhoff, Angew. Chem., Int. Ed., 2017, 56, 11826–11830 CrossRef CAS PubMed.
- H. Shibata, T. G. Henares, K. Yamada, K. Suzuki and D. Citterio, Analyst, 2018, 143, 678–686 RSC.
- Y. Soda, H. Shibata, K. Yamada, K. Suzuki and D. Citterio, ACS Appl. Nano Mater., 2018, 1, 1792–1800 CrossRef CAS.
- P. Kassal, M. Sigurnjak and I. M. Steinberg, Talanta, 2019, 193, 51–55 CrossRef CAS PubMed.
- H. Shibata, Y. Hiruta and D. Citterio, Analyst, 2019, 144, 1178–1186 RSC.
- H. Shibata, Y. Ikeda, Y. Hiruta and D. Citterio, Anal. Bioanal. Chem., 2020, 412, 3489–3497 CrossRef CAS PubMed.
- G. A. Crespo, G. n. Mistlberger and E. Bakker, J. Am. Chem. Soc., 2012, 134, 205–207 CrossRef CAS PubMed.
- G. A. Crespo and E. Bakker, Analyst, 2012, 137, 4988–4994 RSC.
- W. Gao, S. p. Jeanneret, D. Yuan, T. Cherubini, L. Wang, X. Xie and E. Bakker, Anal. Chem., 2019, 91, 4889–4895 CrossRef CAS PubMed.
- J. Ding, E. Lv, L. Zhu and W. Qin, Anal. Chem., 2017, 89, 3235–3239 CrossRef CAS PubMed.
- J. Zhai, L. Yang, X. Du and X. Xie, Anal. Chem., 2018, 90, 12791–12795 CrossRef CAS PubMed.
- S. Jansod and E. Bakker, ACS Sens., 2019, 4, 1008–1016 CrossRef CAS PubMed.
- S. Jansod, M. Cuartero, T. Cherubini and E. Bakker, Anal. Chem., 2018, 90, 6376–6379 CrossRef CAS PubMed.
- S. Jansod, T. Cherubini, Y. Soda and E. Bakker, Anal. Chem., 2020, 92, 9138–9145 CrossRef CAS PubMed.
- E. Jaworska, A. Michalska and K. Maksymiuk, Electrochim. Acta, 2018, 284, 321–327 CrossRef CAS.
- E. Jaworska, A. Michalska and K. Maksymiuk, Electroanalysis, 2020, 32, 812–819 CrossRef CAS.
- X. Hun, X. Xiong, J. Ding and W. Qin, Chem. Commun., 2020, 56, 3879–3882 RSC.
- T. Yin, H. Wang, J. Li, B. Yuan and W. Qin, Talanta, 2021, 232, 122489 CrossRef CAS PubMed.
| This journal is © The Royal Society of Chemistry 2022 |
