 Open Access Article
Long-lasting chemiluminescence bioassays for glucose enabled by a MOFs-in-hydrogel hybrid platform
Minghao
Song
,
Feifei
Shi
,
Ran
Zhang
,
Xueying
Wang
,
Xiaojun
Sun
,
Yuyang
Li
,
Xiang
Ren
 ,
Hongmin
Ma
 * and
Qin
Wei

Collaborative Innovation Center for Green Chemical Manufacturing and Accurate Detection, Key Laboratory of Interfacial Reaction & Sensing Analysis in Universities of Shandong, School of Chemistry and Chemical Engineering, University of Jinan, Jinan 250022, P. R. China. E-mail: chm_mahm@ujn.edu.cn; Tel: +86 531 82767872
First published on 5th August 2022
Abstract
Chemiluminescence (CL) bioassays with stable long-lasting signal outputs have rekindled interest due to their promising application potential in various fields. In this study, long-lasting chemiluminescence bioassays for glucose were achieved by incorporating metal–organic frameworks (MOFs) in an agarose hydrogel matrix. Zeolitic imidazolate framework-8 (ZIF-8) was used as a matrix to load glucose oxidase (GOx) and zeolitic imidazolate framework-67 (ZIF-67) was used as a nanomimic of peroxidase to promote the CL reactions of luminol. ZIF-8 protects the GOx from denaturation under high temperatures for gel formation and enables its slow release due to its pH-responsive capability. Agarose hydrogel was used as a scaffold to disperse the MOF nanocrystals and inhibit molecular diffusion. Based on the achieved strong and long-lasting chemiluminescence signals, cascade catalytic bioassays with a wide detection range were proposed for the sensitive detection of glucose. The detection range of glucose by CL analysis was 0.2–100 mmol L−1 under optimal conditions, and the detection limit was 0.011 mmol L−1 (S/N = 3).
1. Introduction
Glucose is a monosaccharide that is abundant in nature. It is easily absorbed and directly enters the human body to provide energy for vital movement. Glucose is an indispensable nutrient for the human body because it directly provides heat to the body when consumed. It contributes to the metabolic process as one of the main energy sources for the human body.1 Glucose metabolism disorders can result in pathological and physiological changes in tissues and organs, and further deterioration may cause several diseases, such as diabetes,2 cardiovascular disease,3 and Alzheimer's disease.4 Diabetes mellitus is the most common disease caused by the disorder of glucose metabolism.5 Therefore, glucose-level monitoring can be used to timely understand glucose pathological and physiological changes, and provide information support for the prevention and treatment of diabetes.6 Although there have been several methods for determining glucose levels, bioassays with a wide detection range and high sensitivity are still in demand in clinical diagnostics, particularly for blood determination. Therefore, chemiluminescence has become a focused analytical method.Chemiluminescence (CL) is a chemical reaction that results in light being emitted. It is a high-authority analytical tool for detecting and quantifying various biological materials, such as cells,7 microorganisms, proteins,8 DNA,9 RNA, and other analytes.10 Because the luminescent fluorescence method, unlike other fluorescence detection methods, does not require light excitation, spontaneous fluorescence does not generate a background signal.11 This phenomenon provides CL with high sensitivity and a high signal-to-noise ratio.12 However, the traditional CL is usually the flash type. The fast luminescence dynamics make light signal acquisition difficult and results in low analytical accuracy. Moreover, conventional CL analytical techniques are combined with flow injection, which requires additional equipment and a large sample volume. The recent pioneering work by Cui and coworkers reported a long-lasting CL phenomenon in hydrogel systems, which provided slow molecular diffusion and heterogeneous catalysis.13 The hydrogels showed promising applications for glow-type CL. Long-lasting CL emissions have also been reported based on the application of various nanomaterials.14,15 The incorporation of nanobioenzymes into hydrogel systems can provide heterogeneous catalysis platforms for persistent luminescence. Metal–organic frameworks (MOFs) are crystalline materials with pore structures formed by the coordination of metal ions or metal clusters with organic ligands.16 Because of their advantages of high affinity, high stability,17 a certain porosity,18 large loading capacity, and biodegradability,19 MOFs are widely used in loading enzymes and other active biomolecules, increasing the application potential of enzymes in areas requiring thermal stability, resistance to organic solvents, and recycling.20 Further, MOFs synthesized with unique organic ligands and metal ions, such as ZIF-67, also show intrinsic enzyme properties. Glucose oxidase (GOx) can selectively catalyze glucose oxidation and is often used for the selective detection of glucose. Considering the decomposition characteristics of zeolitic imidazolate framework-8 (ZIF-8) under acidic conditions,21 a delayed-release system22 enabled by loading GOx in ZIF-8 was used to achieve persistent CL signals.
In addition, hydrogels are widely used in treatment23 and disease detection to provide the encapsulation carriers of therapeutic drugs,24 biomacromolecules, and nanomaterials due to their excellent encapsulation capability.25 Hydrogels can be classified as chemically and physically crosslinked26 based on the type of network connection.27 Chemical crosslinking is a process in which chemical reactions occur to produce chemical bonds under certain conditions or in the presence of crosslinking agents.28 Physical crosslinking is the process by which polymers are nonchemically bonded or entangled.29 Hydrogels provide more possibilities in biomedical applications,30 such as drug delivery,31 imaging,32 drug carrier,33 and biosensing34 due to their specific spatial network structure. Hydrogels obtained from aqueous polysaccharides are widely used in different fields.35 As a polysaccharide representative, agarose36 has been widely used in biotechnology, medical detection, and pharmacological treatment due to its special hydrophilicity, good biocompatibility, macroporous structure, and thermal-reversible gel properties.37 Agarose has great potential in CL platform construction due to its good biodegradability and strong gelation ability.
In this study, agarose hydrogel was used as scaffolds to disperse MOF nanocrystals. ZIF-8 was used as a matrix to load GOx, and ZIF-67 was used as nanomimics of peroxidase to promote the CL reactions of luminol (Scheme 1B). A CL analysis method with glow-type luminescence and a wide glucose response range was developed based on the combined characteristics of MOFs and agarose gels. The method is easy to operate, sensitive, and stable.
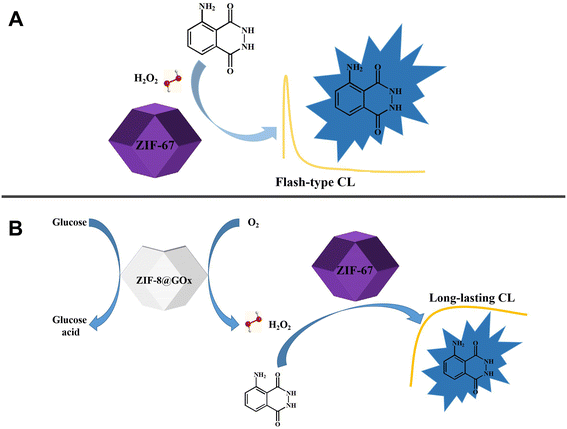 | ||
| Scheme 1 ZIF-67 catalyzes H2O2–luminol flash-type luminescence system (A); long-lasting CL system in “All in One” mode (B). | ||
2. Experimental section
2.1 Materials
Zinc nitrate hexahydrate, glucose and sodium hydrogen carbonate (NaHCO3) were bought from China Medicine Group Shanghai Chemical Reagent Corporation. Luminol was bought from TCI Shanghai Chemical Industry Development Co., Ltd. (Shanghai, China). Agarose (AG), cobaltous nitrate hexahydrate, 2-methylimidazole (2-MIM), sodium carbonate (Na2CO3), glucose oxidase (GOx), sodium chloride (NaCl) and L(+)-ascorbic acid (AA) were bought from Shanghai Macklin Biochemical Co., Ltd. Carbonate buffer solution (CBS) was prepared by mixing Na2CO3 and NaHCO3 solutions and then the pH was adjusted to 8.5. The obtained CBS (pH 8.5) was used for preparation of the luminous solution (5 mmol mL−1 luminol solution).2.2 Apparatus
Scanning electron microscope (SEM) images was obtained using a field emission scanning electron microscope (Zeiss, Germany). X-ray diffraction (XRD) was recorded by X-ray diffractometer. Chemiluminescence (CL) was measured through a multimode microplate reader (TECAN SPARK 20 M, Switzerland).2.3 Preparation of ZIF-67
The preparation of ZIF-67 was based on strategies reported in the literature,38 with minor modifications. First, 0.2930 g Co(NO3)2·6H2O and 0.6490 g 2-methylimidazole were separately dissolved in 20 mL deionized water. Then, the two solutions were mixed at room temperature, stirred for 18 h, centrifuged at 6500 rpm, and washed 5 times.2.4 Preparation of ZIF-8@GOx
The preparation of ZIF-8@GOx was based on strategies reported in the literature,39 with minor modifications. First, 4 mL 5 mg mL−1 GOx was dissolved in 40 mL 2-methyl imidazole (4.1050 g) solution, and 4 mL Zn(NO3)2·6H2O (0.3689 g) solution was added to the mixed solution, stirred at room temperature for 0.5 h, centrifuged at 6500 rpm, and washed 3 times.2.5 Preparation of agarose (AG) hydrogel
Weigh 0.3000 g agarose, add 15 mL deionized water, and stir at 70 °C until all agarose is dissolved. Agarose hydrogel can be obtained after cooling.2.6 Procedures for CL analysis
The agarose hydrogel was dissolved at 70 °C. ZIF-67 luminol and ZIF-8@GOx solutions were added to 200 μL agarose solution at the same time. After mixing, the mixture was rotated for 20 seconds, and 200 μL of the mixed solution was added to a 96-microplate and placed at 4 °C. The mixture is allowed to cool and set overnight in the refrigerator. The loading GOx oxidizes glucose to produce gluconic acid and H2O2, and the gluconic acid promotes the decomposition of ZIF-8 to release more GOx to oxidize glucose and produce more H2O2 since the pore structure of agarose gel allows glucose diffusion into the gel system, and then enters the MOF material through the metal skeleton structure of ZIF-8. Concurrently, H2O2 was accelerated to catalyze luminol under the catalytic action of ZIF-67 to produce CL, and the effect of continuous luminescence was achieved via the diffusion of glucose. Therefore, a certain amount of glucose was added to the solidified mixed gel, and the test was conducted at 37 °C using a microplate reader.3. Results and discussion
3.1 Characterization of ZIF-67
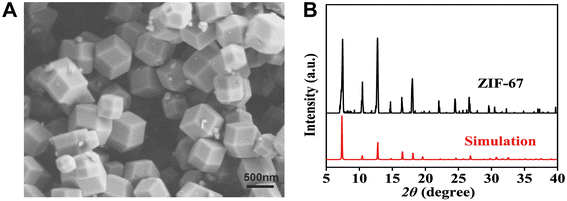
The morphology and crystal structure of the synthesized ZIF-67 were characterized. The XRD pattern of the characterized ZIF-67 (Fig. 1B) is consistent with the simulated spectrum in the literature,38 indicating an appropriate synthesis method. In addition, scanning electron microscope (SEM) images (Fig. 1A) shows that the ZIF-67 is composed of small crystalline particles of uniform size, with an average particle size of about 400 nm.3.2 Characterization of ZIF-8 and ZIF-8@GOx
Morphology and crystal structure characterization were used to compare the synthesized ZIF-8@GOx and ZIF-8. The SEM images showed that ZIF-8 and ZIF-8@GOx had similar shapes. ZIF-8 had a smaller size, with an average size of about 300 nm (Fig. 2A). The average size of ZIF-8@GOx was about 500 nm (Fig. 2C). The results show that the inclusion of GOx did not affect the morphology structure of MOF materials. XRD spectra were used to confirm the effect of GOx on the crystal structure of ZIF-8 and ZIF-8@GOx. Similar XRD patterns showed that the enzyme loading did not affect the crystal structures of ZIF-8. In addition, the XRD spectra (Fig. 2B and D) were consistent with the peak values reported in the literature.39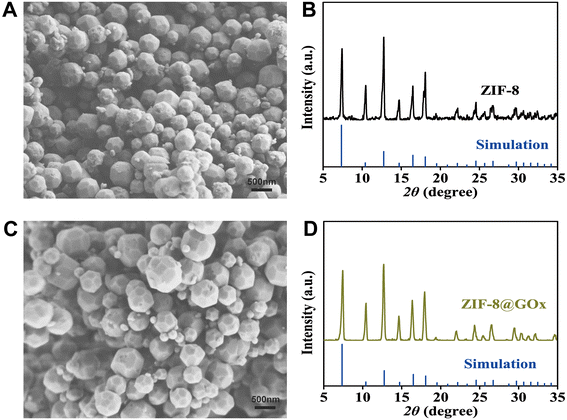 | ||
| Fig. 2 SEM images of ZIF-8 (A) and ZIF-8@GOx (C); XRD characterization and simulation of ZIF-8 (B) and ZIF-8@GOx (D). | ||
3.3 Characterization of agarose gel
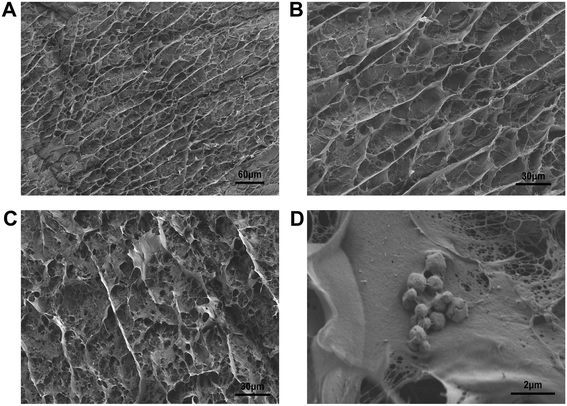
SEM characterization of agarose gel and mixed gel doped with test materials was conducted. From the SEM images (Fig. 3C and D), the MOF materials were confirmed to be mixed into the agarose gel. The addition of MOF materials did not affect the gel's pore structure. Concurrently, the gel's pore structure validated our speculation, allowing us to obtain a continuous result through the diffusion of the object to be measured in the pore structure.3.4 Verification of the gel effect
50 μL 5 mmol mL−1 H2O2 was added to 200 μL aqueous solution doped with luminol solution and ZIF-67 catalyst and agarose gel for 20 min for CL kinetics test to verify the continuous enhancement effect of gel on CL. Fig. 4A shows that the CL signal intensity reached a maximum when H2O2 was just added to the solution, and the luminescence intensity decreased as time changed. Although the signal in the gel system was smaller than that in the solution, the luminescence intensity of the strongest signal lasted for about 8–10 min. Therefore, by comparing the CL kinetic signals in solution and gel, it was confirmed that the gel can enhance CL persistence.3.5 Verification of the catalytic effect of ZIF-67
The CL signals of ZIF-67 in agarose gel with luminol and GOx were compared to verify its catalytic role. Fig. 4B shows that the CL signals of the agarose gel doped with luminol and GOx with and without the addition of ZIF-67 were significantly stronger than those without catalyst addition. This demonstrated that ZIF-67 catalyzed the CL of the H2O2–luminol system, increasing the reaction rate and accumulated CL strength.3.6 Verification of the catalytic effect of ZIF-67
Based on the aforementioned method, GOx was added to one and ZIF-8@GOx to the other while maintaining luminol and ZIF-67. After cooling and solidification, the same amount of the glucose solution was added. Fig. 4C shows that the CL with GOx has temporary retention after reaching the strongest signal, and then the signal intensity gradually decreases with time, whereas the CL signal with ZIF-8@GOx exhibited a long persistence after reaching the strongest signal. Therefore, the CL persistence can be enhanced by loading GOx with ZIF-8.3.7 Optimization of the detection conditions
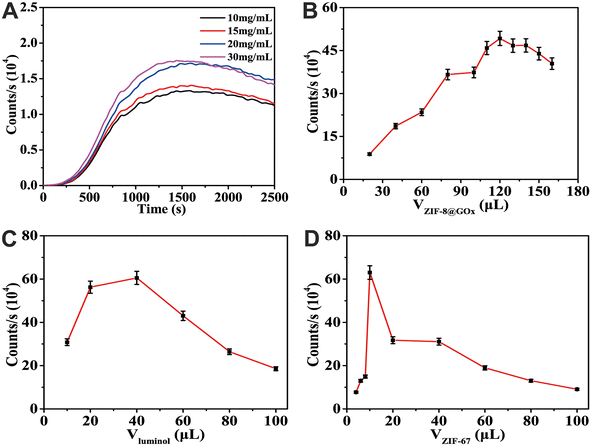
The experimental conditions in this study were selected and optimized to achieve the best performance of the synthesized CL analysis method. First, the CL signal intensity in the immobilized agarose concentration was investigated. Fig. 5A shows that the luminescence intensity increased with an increase in agarose concentration, and the intensities of 20 and 30 mg mL−1 agarose did not change much; however, 30 mg mL−1 agarose cooled and solidified faster. Because the experimental operation is prone to significant errors, an agarose concentration of 20 mg mL−1 was adopted as the reaction's optimal concentration. Fig. 5B shows the influence of different ZIF-8@GOx volumes on CL-intensity changes due to glucose decomposition. The results showed that the luminescence intensity reached a maximum when the volume of ZIF-8@GOx was 120 μL. This may be due to the excessive addition of ZIF-8@GOx, which results in the excessive dispersion of glucose and a decrease in the H2O2 production rate and luminescence intensity. Fig. 5C compares the influence of different volumes of luminol addition amounts on CL. The figure shows optimum luminol intensity when the luminol volume is 40 μL, which should be due to a decrease in CL intensity when luminol volume is extremely large and part of the luminol diffuses into MOF materials. When the amount of ZIF-67 added is larger than 10 μL (Fig. 5D), the solution diffuses into the pore structure of ZIF-67, resulting in less solution participating in the reaction, lowering the CL intensity.3.8 Analysis performance test of CL analysis
The detection range of glucose by CL analysis was 0.2–100 mmol L−1 under optimal conditions. Fig. 6A shows that the strongest CL signal increased as the glucose concentration in the sample increased. Fig. 6B shows that the glucose concentration was between 2 and 100 mmol L−1, and the CL intensity had a linear relationship with the logarithm of glucose concentration. The linear calibration curve was counts per s = 423![[thin space (1/6-em)]](https://www.rsc.org/images/entities/char_2009.gif) 260.08
260.08![[thin space (1/6-em)]](https://www.rsc.org/images/entities/char_2009.gif) lg
lg![[thin space (1/6-em)]](https://www.rsc.org/images/entities/char_2009.gif) c − 74
c − 74![[thin space (1/6-em)]](https://www.rsc.org/images/entities/char_2009.gif) 788.105 (R2 = 0.9934), and the detection limit was 0.011 mmol L−1 (S/N = 3). In addition, the maximum luminescence intensity displayed a linear relationship with the glucose concentration in the range of 0.2–8 mmol L−1 (Fig. 6C), and the linear equation was counts per s = 42
788.105 (R2 = 0.9934), and the detection limit was 0.011 mmol L−1 (S/N = 3). In addition, the maximum luminescence intensity displayed a linear relationship with the glucose concentration in the range of 0.2–8 mmol L−1 (Fig. 6C), and the linear equation was counts per s = 42![[thin space (1/6-em)]](https://www.rsc.org/images/entities/char_2009.gif) 059.88c − 12
059.88c − 12![[thin space (1/6-em)]](https://www.rsc.org/images/entities/char_2009.gif) 747.9 (R2 = 0.9960). The proposed CL sensor has a wider linear detection range than earlier studies, which may be due to the long-term effect of the MOF material loading and the pore structure of the agarose gel on the CL intensity.
747.9 (R2 = 0.9960). The proposed CL sensor has a wider linear detection range than earlier studies, which may be due to the long-term effect of the MOF material loading and the pore structure of the agarose gel on the CL intensity.
Table 1 compares the detection performance of this method for glucose, including linear range and detection limit, to those of other detection methods. In comparison, this method offers a wider detection range and higher sensitivity.
| Sensor fabrication scheme | Detection range of glucose | Limit of detection (LOD) | Ref. |
|---|---|---|---|
| Ratiometric fluorescence | 1–10 mmol L−1 | 0.16 mmol L−1 | 40 |
| Enzymatic electrochemical sensor | 0.05–0.7 mmol L−1 | 0.017 mmol L−1 | 41 |
| Fluorometric biosensor | 2–10 mmol L−1 | — | 42 |
| Colorimetric immunoassay | 0.05–0.50 mmol L−1 | 0.020 mmol L−1 | 43 |
| Photoelectrochemical enzyme sensor | 1.0–19 mmol L−1 | 0.080 mmol L−1 | 44 |
| Chemiluminescence | 0.2–100 mmol L−1 | 0.011 mmol L−1 | This work |
3.9 Anti-interference test
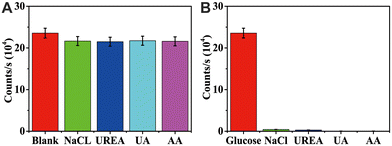
Some interfering substances (NaCl/UREA/UA/AA) were selected for the interference test to evaluate the anti-interference performance of the detection method. Fig. 7 shows that the signal obtained after adding interfering substances to the glucose solution had little difference compared with the test signal of a blank sample with the same concentration of glucose solution (Fig. 7A). Concurrently, the luminescence signal collection of glucose solution and the aqueous solution of interfering substances show that the luminescence signal is so weak that it can be almost ignored when only interfering substances are present (Fig. 7B). Therefore, this detection method has good anti-interference performance and provides research space for detecting actual samples.3.10 Actual sample testing
The glucose concentration was detected in blood samples using the standard addition method to evaluate the feasibility and accuracy of this CL analysis and detection method in practical analysis (Table 2). Standard glucose solutions of 0.2, 1.0, and 1.5 mmol L−1 were added to the diluted sample to be tested. The average recoveries of this method were 97.8% and 102% with RSD of 2.12–3.54% (<5%); the proposed CL assay can be used to determine glucose in the blood.| Glucose in the blood of rats after dilution (mmol L−1) | The added (mmol L−1) | The detection content (mmol L−1, n = 5) | Mean (mmol L−1) | RSD (%) | Recovery (%) |
|---|---|---|---|---|---|
| 0.340 | 0.200 | 0.550, 0.570, 0.530, 0.520, 0.540 | 0.542 | 3.54 | 101 |
| 1.00 | 1.31, 1.36, 1.30, 1.28, 1.34 | 1.32 | 2.42 | 97.8 | |
| 1.50 | 1.85, 1.87, 1.82, 1.90, 1.92 | 1.87 | 2.12 | 102 |
4. Conclusion
In this study, a CL assay was developed to detect the glucose concentration. In agarose gel system, the H2O2 produced by ZIF-8 loaded GOx oxidized glucose catalyzes the oxidation of luminol under ZIF-67 to produce sustained CL. This is due to loading capacity of agarose gel and the GOx release behavior induced by gluconic acid in the decomposition of ZIF-8. By producing gluconic acid, ZIF-8 breaks down and GOx is released to achieve sustained luminescence. The detection limit was 0.011 mmol L−1, exhibiting good specificity and reproducibility. Because of the aforementioned advantages, ZIF-8@GOx has significant potential for detecting glucose levels using the CL of the H2O2–luminol system catalyzed by ZIF-67 in an agarose gel system. In addition, H2O2–luminol can be diffused in ZIF-8 to achieve the effect of sustained chemiluminescence, which has a certain reference value in the study of a sustained cold light source due to the metal skeleton structure of ZIF-8 and the pore structure of agarose gel. Concurrently, the good linear relationship obtained by detecting blood in rats offers various clinical blood glucose monitoring applications.Conflicts of interest
There are no conflicts to declare.Acknowledgements
This study was financially supported by the Shandong Provincial Natural Science foundation (ZR2020YQ13), a Project of Shandong Province Higher Educational Youth Innovation Science and Technology Program (2020KJC008), and Jinan Scientific Research Leader Workshop Project (2020GXRC048).References
- Q. L. Liao, H. Jiang, X. W. Zhang, Q. F. Qiu, Y. Tang, X. K. Yang, Y. L. Liu and W. H. Huang, Nanoscale, 2019, 11, 10702–10708 RSC.
- H. Li, C. Liu, D. Wang and C. Zhang, Biosens. Bioelectron., 2017, 91, 268–275 CrossRef CAS PubMed.
- D. Bamgboje, I. Christoulakis, I. Smanis, G. Chavan, R. Shah, M. Malekzadeh, I. Violaris, N. Giannakeas, M. Tsipouras, K. Kalafatakis and A. Tzallas, Biosensors, 2021, 11(6), 189–203 CrossRef CAS PubMed.
- A. Munawar, F. Zafar, S. Majeed, M. Irfan, H. Ullah Khan, G. Yasmin and N. Akhtar, J. Electroanal. Chem., 2021, 895, 115469–115475 CrossRef CAS.
- H. Ki, H. Jang, J. Oh, G. R. Han, H. Lee, S. Kim and M. G. Kim, Anal. Chem., 2020, 92, 11530–11534 CrossRef CAS PubMed.
- V. Osuna, A. Vega-Rios, E. A. Zaragoza-Contreras, I. A. Estrada-Moreno and R. B. Dominguez, Biosensors, 2022, 12(3), 137–161 CrossRef CAS PubMed.
- X. L. Xu, N. N. Zhang, G. F. Shu, D. Liu, J. Qi, F. Y. Jin, J. S. Ji and Y. Z. Du, ACS Nano, 2021, 15, 19394–19408 CrossRef CAS PubMed.
- M. Sun, L. Wu, H. Ren, X. Chen, J. Ouyang and N. Na, Anal. Chem., 2017, 89, 11183–11188 CrossRef CAS PubMed.
- Y. Hou, R. Han, Y. Sun, C. Luo and X. Wang, Anal. Chim. Acta, 2022, 1195, 339386 CrossRef CAS PubMed.
- K. Aslan and C. D. Geddes, Chem. Soc. Rev., 2009, 38, 2556–2564 RSC.
- G. C. Van de Bittner, C. R. Bertozzi and C. J. Chang, J. Am. Chem. Soc., 2013, 135, 1783–1795 CrossRef CAS PubMed.
- W. B. Porterfield, K. A. Jones, D. C. McCutcheon and J. A. Prescher, J. Am. Chem. Soc., 2015, 137, 8656–8659 CrossRef CAS PubMed.
- Y. Liu, W. Shen, Q. Li, J. Shu, L. Gao, M. Ma, W. Wang and H. Cui, Nat. Commun., 2017, 8, 1003 CrossRef PubMed.
- P. Dang, X. Liu, H. Ju and J. Wu, Anal. Chem., 2020, 92, 5517–5523 CrossRef CAS PubMed.
- X. Sun, J. Lei, Y. Jin and B. Li, Anal. Chem., 2020, 92, 11860–11868 CrossRef CAS PubMed.
- G. Zhu, M. Zhang, L. Lu, X. Lou, M. Dong and L. Zhu, Sens. Actuators, B, 2019, 288, 12–19 CrossRef CAS.
- J. Mehta, N. Bhardwaj, S. K. Bhardwaj, K.-H. Kim and A. Deep, Coord. Chem. Rev., 2016, 322, 30–40 CrossRef CAS.
- P. Li, J. Modica, A. Howarth, E. Vargas L, P. Moghadam, R. Snurr, M. Mrksich, J. Hupp and O. Farha, Chem, 2016, 1, 154–169 CAS.
- J. Chang, W. Lv, Q. Li, H. Li and F. Li, Anal. Chem., 2020, 92, 8959–8964 CrossRef CAS PubMed.
- C. Gu, L. Bai, L. Pu, P. Gai and F. Li, Biosens. Bioelectron., 2021, 176, 112907 CrossRef CAS PubMed.
- W. H. Chen, G. F. Luo, M. Vazquez-Gonzalez, R. Cazelles, Y. S. Sohn, R. Nechushtai, Y. Mandel and I. Willner, ACS Nano, 2018, 12, 7538–7545 CrossRef CAS PubMed.
- H. Cheng, L. Zhang, J. He, W. Guo, Z. Zhou, X. Zhang, S. Nie and H. Wei, Anal. Chem., 2016, 88, 5489–5497 CrossRef CAS PubMed.
- A. P. Chiriac, A. Ghilan, I. Neamtu, L. E. Nita, A. G. Rusu and V. M. Chiriac, Macromol. Biosci., 2019, 19, e1900187 CrossRef PubMed.
- D. N. Heo, N. J. Castro, S. J. Lee, H. Noh, W. Zhu and L. G. Zhang, Nanoscale, 2017, 9, 5055–5062 RSC.
- X. Gao, X. Li, X. Sun, J. Zhang, Y. Zhao, X. Liu and F. Li, Anal. Chem., 2020, 92, 4592–4599 CrossRef CAS PubMed.
- X. Liang, H. Ding, Q. Wang, M. Wang, B. Yin and G. Sun, New J. Chem., 2021, 45, 861–871 RSC.
- R. Wijayapala, S. M. Hashemnejad and S. Kundu, RSC Adv., 2017, 7, 50389–50395 RSC.
- H. Wang, A. Paul, D. Nguyen, A. Enejder and S. C. Heilshorn, ACS Appl. Mater. Interfaces, 2018, 10, 21808–21815 CrossRef CAS PubMed.
- Y. Lin, S. Wang, S. Sun, Y. Liang, Y. Xu, H. Hu, J. Luo, H. Zhang and G. Li, RSC Adv., 2021, 11, 32988–32995 RSC.
- D. Yang, Chem. Mater., 2022, 34, 1987–1989 CrossRef CAS.
- A. Panwar, M. M. Sk, B. H. Lee and L. P. Tan, RSC Adv., 2022, 12, 7922–7934 RSC.
- J. Liang, X. Dong, C. Wei, D. Kong, T. Liu and F. Lv, RSC Adv., 2017, 7, 6501–6510 RSC.
- L. Yang, Y. Li, Y. Gou, X. Wang, X. Zhao and L. Tao, Polym. Chem., 2017, 8, 5071–5076 RSC.
- M. L. Zhao, W. J. Zeng, Y. Q. Chai, R. Yuan and Y. Zhuo, Anal. Chem., 2020, 92, 11044–11052 CrossRef CAS PubMed.
- Z. Jiang, S. M. Seraji, X. Tan, X. Zhang, T. Dinh, M. Mollazade, A. E. Rowan, A. K. Whittaker, P. Song and H. Wang, Chem. Mater., 2021, 33, 7818–7828 CrossRef CAS.
- G. Apte, A. Lindenbauer, J. Schemberg, H. Rothe and T. H. Nguyen, ACS Omega, 2021, 6, 10963–10974 CrossRef CAS PubMed.
- S. Xie, Y. Chen, Z. Guo, Y. Luo, H. Tan, L. Xu, J. Xu and J. Zheng, Mater. Chem. Front., 2021, 5, 5418–5428 RSC.
- E. Andres-Garcia, L. Oar-Arteta, J. Gascon and F. Kapteijn, Chem. Eng. J., 2019, 360, 10–14 CrossRef CAS.
- X. Wu, J. Ge, C. Yang, M. Hou and Z. Liu, Chem. Commun., 2015, 51, 13408–13411 RSC.
- L. Su, L. Yang, Q. Sun, T. Zhao, B. Liu, C. Jiang and Z. Zhang, New J. Chem., 2018, 42, 6867–6872 RSC.
- V. Myndrul, E. Coy, N. Babayevska, V. Zahorodna, V. Balitskyi, I. Baginskiy, O. Gogotsi, M. Bechelany, M. T. Giardi and I. Iatsunskyi, Biosens. Bioelectron., 2022, 207, 114141–114152 CrossRef CAS PubMed.
- Q. Yu, J. Jiang, Z. Chen, C. Han, X. Zhang, S. Yang, P. Zhou, T. Deng and C. Yu, Sens. Actuators, B, 2022, 350, 130898–130905 CrossRef CAS.
- Q. Liu, Y. Yang, H. Li, R. Zhu, Q. Shao, S. Yang and J. Xu, Biosens. Bioelectron., 2015, 64, 147–153 CrossRef CAS PubMed.
- D. Chen, X. Wang, K. Zhang, Y. Cao, J. Tu, D. Xiao and Q. Wu, Biosens. Bioelectron., 2020, 166, 112466–112470 CrossRef CAS PubMed.
| This journal is © The Royal Society of Chemistry 2022 |

