 Open Access Article
Smectic free-standing films under fast lateral compression
Christoph
Klopp
 a,
Torsten
Trittel
 a,
Kirsten
Harth
 bc and
Ralf
Stannarius
 *a
*a
aDepartment of Nonlinear Phenomena, Institute of Physics, Otto von Guericke University, Universitätsplatz 2, D-39106 Magdeburg, Germany. E-mail: ralf.stannarius@ovgu.de
bDepartment Theory of Soft Matter/Biophysics, Institute of Physics, Otto von Guericke University, Universitätsplatz 2, D-39106 Magdeburg, Germany
cDepartment of Engineering, Drandenburg University of Applied Sciences, Magdeburger Straße 50, D-14770 Brandenburg, Germany
First published on 22nd November 2021
Abstract
Smectic freely-suspended films can wrinkle like solid sheets. This has been demonstrated earlier with shape-fluctuating smectic bubbles. Here, we exploit the collapse of smectic catenoid films with a central equatorial film to expose the latter to rapid lateral compression. Wrinkle formation is observed in the planar film and the thickness dependence of the undulation wavelength is measured. In addition to the central film, its border undergoes an undulation instability as well.
1 Introduction
Wrinkling is a phenomenon often observed in thin solid sheets, in particular when thin stiff surface layers cover elastic or shape-responsive substrates and are exposed to compressive in-plane stress.1–11 The surface area of the thin layer is conserved, while its lateral extension is compressed by external forcing. The wrinkles typically align perpendicular to the direction of unilateral compressive stress, while complex wrinkle morphologies can be observed for isotropic, two-dimensional compression. Typical examples that may be exploited in technical applications are thin layers of a metal or a stiff polymer on thermoresponsive shape-memory polymers4,6 or liquid-crystalline elastomers8,9 where wrinkles can be reversibly generated by temperature changes. One can also use the thermal expansion of polymers to generate wrinkles in a metal surface layer upon cooling,11 or exploit photopolymerization by UV-irradiation.7 In addition to such intrinsically generated stresses, one may generate wrinkles by lateral compression of sandwiched systems consisting of layers with different softness.3 Thin polymer sheets can wrinkle on the surface of a liquid bath upon deformation of the liquid surface5 or under lateral compressing forces.10In some cases, viscous flow in the subphase can affect the wavelength selection. In principle, one can also induce wrinkles in thin layers of sufficiently viscous fluid, when the time scale of local compression by external forces is substantially shorter than the time scale on which the film thickness can increase. Examples are collapsing surface bubbles on a pool12–14 or closed bubbles of smectic liquid crystal films.15,16
Smectic phases represent a unique state of matter between the isotropic liquid phases characterized by fluidity and no long-range positional order of the molecules, and solids characterized by absence of fluidity and often by three-dimensional (3D) positional molecular order. The simplest smectic A (SmA) and smectic C (SmC) phases possess only a one-dimensional molecular order in stacked layers.
A vast amount of literature on smectic phases has shed light on a wide range of structural and dynamic aspects.17 In particular, the ferroelectric and antiferroelectric properties of some smectics18 are the basis of numerous potential applications. The majority of these experiments have been performed in sandwich cells, where the layers are fixed, flow is inhibited and the dynamics is often restricted to electro-optic switching of the optic axis by external forces. Fundamental features of these phases have been discovered in such experiments.
Smectic freely suspended films open the possibility to investigate other aspects, e.g. those related to fluidity in the molecular layers (e.g. ref. 19 and 20). They are remarkable examples of quasi-two-dimensional (2D) liquids. The mesogenic molecules can move freely in the layer plane. These layers are well aligned with the film plane. The study of such films has certain advantages over experiments in sandwich cells when one wants to prepare systems with perfect layer order, in particular for optical and electro-optical techniques. Stable films may have thicknesses as low as a few nanometers (two molecular layers), while at the same time their lateral extensions may reach several centimeters. The huge surface-to-volume ratio of these films makes them excellent objects for the analysis of surface-related effects.
These free standing smectic films look, at first glance, like soap films, but differ from them by their internal structure. Since the molecular layers are stacked parallel to the film surface, the film thickness is discrete and an integer multiple of the smectic layer thickness. In experiments, the films are usually suspended in a rigid frame, and dynamic processes are essentially restricted to reorientations of the director or to flow in the film plane. The films adopt a minimal surface, and with a properly chosen frame geometry, they are ideally flat.
Due to the discrete layered structure, rapid changes of the film area cannot be compensated by local adjustment of the film thickness as in typical soap films. Local thickness changes are associated with the generation of dislocations. This process requires additional energy, which is dissipated during the reorganization. This subtle structural difference from films of low-viscosity soap solutions has considerable consequences in particular when fast transformations of film shapes and sizes are involved. In some earlier studies, the film area was changed dynamically by deflating sphere-cap shaped films on a circular frame.21–23 If the area reduction occurs slowly enough, the excess film material is either transported into the meniscus or it forms circular spots with additional layers on the film surface, so-called ‘islands’. A peculiar effect in reaction to quick film area reduction is found in smectic C films below the transition into the smectic A phase. There, the film area can also be slightly reduced by a phase transition from the tilted smectic C into the smectic A phase.24 This is an almost instant reaction, but of only marginal results.
In other experiments, the film holder sizes were rapidly expanded in order to produce quick film area increases.25 The film can react by forming ‘holes’, i.e. regions with reduced layer number. This involves, similar to island formation and growth, the generation of dislocations, which costs energy.
In experiments with freely floating closed smectic films (bubbles),26,27 spontaneous shape transformations can be observed without a change of the frame geometry. In such films, it was shown that a rapid lateral compression by means of surrounding air streams can lead to spontaneous wrinkling of the films with some preferential wave length.16 Similar phenomena have been known before only from solid sheets or highly viscous liquids.12–14 The wrinkles on smectic bubbles appear as a consequence of the competing effects of air redistribution next to the film and elastic deformation forces by splay of the mesogenic director field.16 Those experiments have been performed primarily in microgravity. Freely floating smectic bubbles were prepared using a catenoid collapse technique.26,28 The air flow around these bubbles is difficult to control. The formation of wrinkles depends in a subtle way on the momentary bubble shapes, on the synchronization of air streams from the opposite poles of the bubbles towards their equator and on the thickness and homogeneity of the smectic films that sets the overall surface area reduction rate.15,29
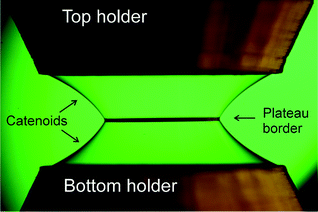
Here, we propose a novel technique to observe the wrinkling of initially flat smectic films under the influence of a controlled and isotropic lateral compression. We employ the collapse of catenoids again, but the catenoids are prepared containing a central film in their waist, see Fig. 1(b). The film response to rapid lateral compression during catenoid collapse is monitored from two perpendicular perspectives. This technique has several advantages. First, we can easily determine the rate of film area reduction from the observation of the central film borders. Second, we can exclude that a curvature of the film is relevant for wrinkle formation as in solid sheets.30 Third, the experiments can be performed under normal gravity because the film remains near the central plane between the sample holders during the experiment.
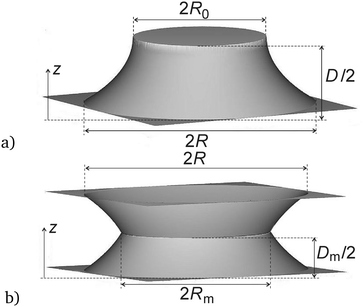 | ||
| Fig. 1 The images show (a) one half of a catenoid without central film and (b) catenoids with central film, both at their maximum extensions before collapse. | ||
2 Catenoid collapse
The minimal surface between two concentric rings with radius R and mutual separation D is described by the equation | (1) |
 | (2) |
In our experiments, we study catenoids with a central film in the z = 0 plane. One can describe each half of the film shape with the same catenoid solutions as above, replacing z by z′ = z ± zm in each of the two halves, respectively. For simplicity, we will call such structures “filled” catenoids here. Then, R0 does no longer represent a real waist radius, it remains a mere fit parameter, viz. the waist radius of a hypothetical extension of the catenoid solution beyond the central film, at z′ = ±zm. The value of zm depends on the contact angle between the films in the Plateau border around the central film. We will consider one of the two halves now: eqn (1) becomes
 | (3) |
 | (4) |
![[thin space (1/6-em)]](https://www.rsc.org/images/entities/char_2009.gif) z′/R0, into eqn (4) one obtains
z′/R0, into eqn (4) one obtains | (5) |
 inserted into eqn (3), yielding
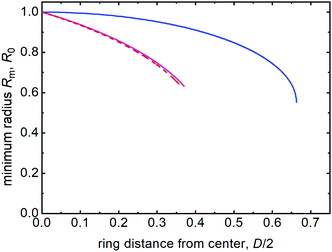
  . The complete graph of the central film radius as a function of the separation of the holder from the catenoid center is shown in Fig. 2 (dashed curve). Beyond a distance of Dm,max ≈ 0.71859R, no stable solution exists. There, the film radius reaches a value of Rm,min ≈ 0.63788R. The shape of the catenoid halves with central film is shown in Fig. 1b for the maximum ring separation.
We note that in addition to the stable catenoid solutions in the graphs of Fig. 2, there exist unstable solutions with much lower central radii. In experiments, they have not been observed. A more comprehensive mathematical treatment of different kinds of solutions with and without central films and with different holder geometries has been published by Alimov et al.32,33
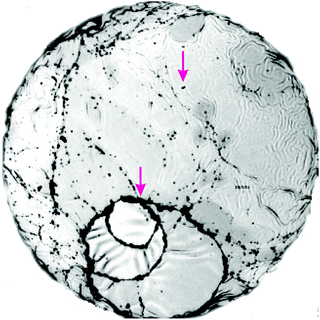
A small detail that is relevant for the catenoids with central films has been demonstrated for soap films by Geminard and Oswald,34 and shown to be even more pronounced in smectic films by Trittel et al.35 The Plateau border has the effect of a negative line tension if it has a finite extension. The consequence is that the equilibrium angle between the three films is not the same, but the central film and both catenoid parts form angles slightly smaller than 120°. If one assumes a realistic angle of 119° for the smectic material,35 the above calculation needs a slight correction, and the maximum achievable ring separation reaches ≈0.74074R, with an inner film radius of about 0.63162R. This scenario is indicated by the magenta curve in Fig. 2 slightly above the dashed graph. An experimental image of a smectic film very close to the stability threshold is shown in Fig. 3. Two catenoid segments are connected to the central film by a Plateau border decorated by extra smectic material which appears dark in transmission. The image demonstrates a particularly thick border.
For our experiments, the situation beyond the stability threshold of ring separation is relevant. Beyond Dm,max, no stable solutions exist anymore except two separate plane films in the holding rings. When a catenoid is stretched beyond the maximum ring separation, an axially symmetric collapse takes place. Thereby, the central film continuously shrinks either to finally form a small satellite bubble, or to shrink into a liquid thread connecting the films in the holding rings.
3 Setup and materials
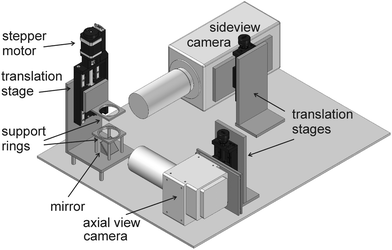
The setup consists of two concentric metal rings of inner diameter 2R = 50 mm, which are mounted coaxially on a rail. Each ring has a flat, ≈1 mm wide surface facing the opposite holder. Fig. 4 sketches the experimental apparatus. The figure shows the two support rings. The lower one is fixed, and the upper one can be moved on a rail with an adjustable velocity by means of the stepper motor. The collapse of the smectic film is much faster than the motion of the upper ring, so that one can assume that after passing the critical ring separation, the dynamics is exclusively governed by the film reorganization at practically constant ring distance. The whole collapse process takes place within less than 200 ms.Two high-speed cameras (Phantom V611 and Phantom VEO 710L) are used to observe the catenoid film. One of them takes the side view, the other one observes the central film in axial direction via a mirror at the bottom. Both cameras are synchronized. They are triggered manually after the collapse. Then, the preceding images are read out from the ring buffer memory. The frame rate of recording is 6200 fps. The spatial resolutions are 16 μm per pixel for the axial view camera and 17.5 μm per pixel for the side view camera.
The material used is a room temperature smectic C mixture with 50 vol% of 2-(4-n-hexyloxyphenyl)-5-n-octylpyrimidine and 50 vol% of 5-n-decyl-2-(4-n-octyloxyphenyl) pyrimidine. The smectic C range of this mixture is between 20 and 53 °C. The surface tension is 22.45 mN m−1 at room temperature.26 In the beginning of the experiment, a small amount of the smectic material is placed on one of the rings. Then, the two flat surfaces of the rings are brought in contact with each other, with the mesogenic material in between. When the rings are slowly separated from each other, an initially nearly cylindrical and then catenoid-shaped smectic film forms. We pull the movable ring to a position close to the critical distance Dmax. There, we determine the thickness of the smectic film with a standard method described in ref. 36. Then, further separation initiates a catenoid collapse, producing two oscillating films at the holders plus one satellite bubble.16,27–29 The primary purpose of this first step is to retain one of the two plane films at the holders. If both films survived, which is the case in most experiments, one is pierced and destroyed. The thickness of the remaining film is often inhomogeneous, but on average its thinnest regions correspond to the film of the preceding catenoid.
With the remaining film on one of the holding rings, we approach the holders again until contact. When the holders are slowly separated again, this film gradually detaches from the holder, and the emerging catenoid has a central film, spanned symmetrically in the middle between the two holders. We increase the ring separation to a position close to the maximum separation Dm,max. Finally, the actual experiment is started by slowly increasing the ring distance beyond the stability limit. The cameras record the subsequent collapse and the video footage is then evaluated by image analysis software (IDL, Matlab).
4 Results
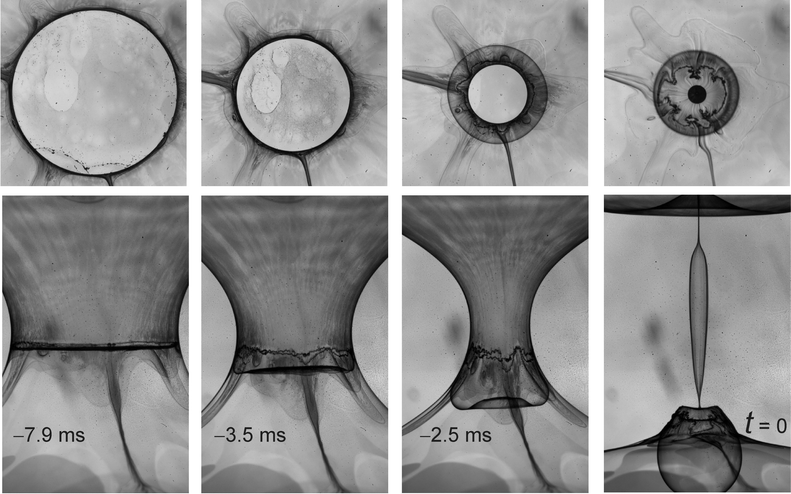
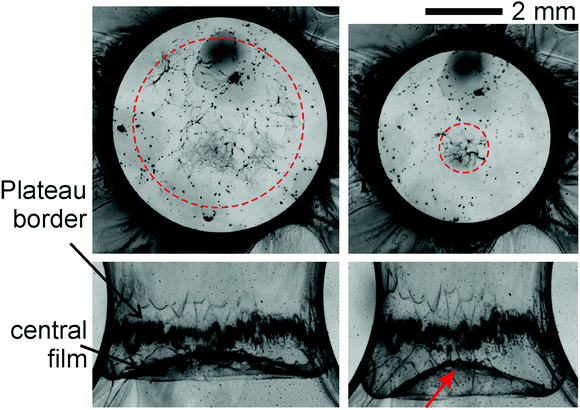
After the critical separation of the holder rings is surpassed, the catenoid collapse is unavoidable. Even when the ring motion is stopped, the collapse proceeds. The central film shrinks radially in the plane. Fig. 5 shows snapshots of both cameras during the collapse of a catenoid with central film in the final milliseconds before pinch-off. The top row shows the axial images (10 × 10 mm2), the bottom row contains the corresponding side views (10 × 16 mm2). The central film is characterized by regions of different thicknesses from a few dozen up to a few hundred nanometers. Fig. 6a shows a typical space-time plot of a central cross section of the film in the same experiment, seen from the axial view camera. A zoomed view of the final contraction before pinch-off can be seen in Fig. 6b. The dark edge in (a and b) represents the Plateau border.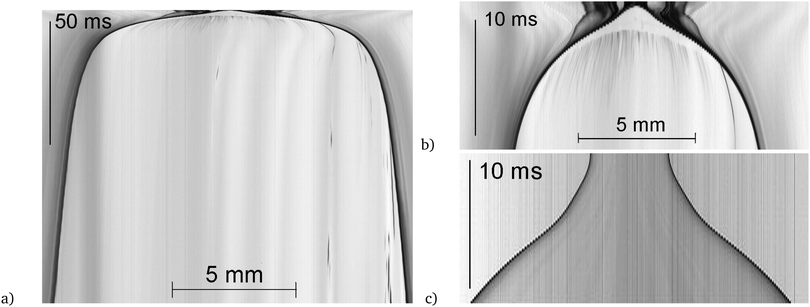 | ||
| Fig. 6 Spatio-temporal plots of a central cross section of the axial camera images in the collapse period preceding pinch-off. Images were recorded under illumination with monochromatic parallel light. Time runs from bottom to top: (a) same catenoid as in Fig. 5, with central film, the dark lines are the Plateau borders; (b) enlarged final phase of (a); (c) collapse of a catenoid of the same film thickness without central film, in side view. The cross-section is taken at the catenoid waist. The pinch-off occurs at positions near the holding rings in this case.28 The spatial scale in (c) is the same as in (b). | ||
Let us first qualitatively discuss the collapse dynamics. The critical waist diameter for a stable catenoid in the present holder geometry is about 28 mm without central film, and about 31.5 mm with film. The plots in Fig. 6 thus show only the late phase of the collapse. The complete collapse of a catenoid with central film (Fig. 6a) proceeds more than one order of magnitude slower than without it (Fig. 6c). The central film produces a resistance against its shrinkage. The reason is that each reduction of the film diameter at constant volume requires a complex reorganization of the smectic layers. Unlike low-viscosity soap films, the smectic film cannot compensate lateral shrinkage by simply increasing its thickness. Either, excess material has to enter the Plateau border, or it has to form islands or disordered chunks on the film. Alternatively, the film can form wrinkles or bulge out of the central plane. A careful inspection of the images shows that flow into the Plateau border is not relevant within the short time interval of the final collapse. It is hindered by dissipation due to the reorganization of the smectic structure in the menisci.17,37 There is a noticeable contribution of chunk formation in the central film, which is probably the dominant contribution in the early stage of film area reduction. They are particularly well seen as dark spots lined up at dislocations in the contrast-enhanced image of Fig. 7. Within the chunks, the smectic layer structure is still present but the layer orientation is not uniform. Focal conics may be involved and numerous defects. This leads to a strongly scattering optical appearance.
At a late stage, a clearly visible film reaction is global bulging. One can see this in Fig. 5 in the bottom row. The central part of the film escapes from the midplane towards one of the two holder rings, in most cases to the bottom one, while the former Plateau border remains on average at the initial height, increasingly undulating. In some cases, the film may finally form a closed bubble as shown in Fig. 5.
We analyze the images of the central film during the final phase of the collapse. As seen in Fig. 6a, there is a rather slow contraction of the Plateau border until the final 10 ms before pinch-off. Then, two competing processes set in that rapidly reduce the film diameter. The first one, as mentioned above, is the global escape of the central film from the plane. The second one is wrinkle formation, which also does not involve reduction of the actual film surface area, but of its outer diameter. In Fig. 6a and b, the onset of wrinkling is indicated by dark stripes. A similar phenomenon has been found earlier in freely floating smectic bubbles.15,16 There are a few remarkable differences though.
First, the compression of the film is isotropic, whereas in the bubbles, unilateral compression is found in most situations. Thus, the wrinkles found in the central flat films have a disordered, fingerprint-like appearance. Wrinkles in the oscillating smectic bubbles are often straight because of a uniaxial compression.16 The wavelengths observed in these bubbles were in general somewhat shorter than in the present experiments because the films were thinner in the former study.
An advantage of the present geometry is that the film thickness in one and the same film can be quite different in different locations. Thus, one can easily determine the film thickness dependence of the dominating wrinkling wavelength λ. An example is shown in Fig. 8. Two regions of the shrinking film were selected, cut out and Fourier transformed. The corresponding FFT power spectra are seen in the bottom graph. There, we averaged the intensity over all angular directions on the FFT spectrum belonging to a given wave number q = 2π/λ. The corresponding film thicknesses were estimated from the interference maxima and minima of the film. Because the short observation time of a few hundred milliseconds did not allow a spectroscopic analysis, the local film thickness is obtained only accurate to ±1/4 interference order (≈±37 nm). The exponential growth rate of the wrinkle amplitude is of the order of 103 s−1. A clear tendency of a wavelength dependence of this rate is not measurable, but the wrinkles in thinner film regions in the same film in general appear earlier. This may be caused by a faster growth rate of wrinkles in thinner films. The problem with our observation direction normal to the film is that the wrinkles become visible only after they have reached a substantial height, where the amplitude is already comparable to a quarter of the wavelength. The initial growth of the undulations, where a linear stability analysis16 can be performed, is hidden. When the film area shrinks, the pattern is compressed and the wavelengths shrink as well. Thus we expect that the observed patterns do not exactly reflect the wavelengths selected in the early pattern formation phase, but may be systematically smaller. For the functional form of the wavelength vs. film thickness curve this has no consequences since all wavelengths shrink at the same relative rate. With increasing film shrinkage, the undulations become clearly visible even in the side views of the catenoids, they may finally reach amplitudes much larger than the undulation wavelengths (see Fig. 10 below).
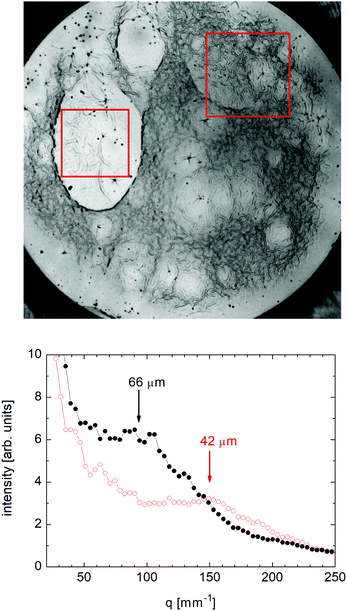 | ||
| Fig. 8 Top: Contrast enhanced axial view of the central film of the catenoid in Fig. 5, 6 ms before pinch-off, image size 6 × 6 mm2. Two regions with film thicknesses of 160 ± 40 nm (left square in the image, filled symbols in the graph) and 90 ± 40 nm (top right square in the image, open symbols) were cut out and Fourier transformed, yielding the spectra in the bottom graph. | ||
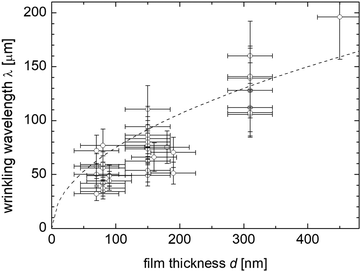
In our earlier study of these patterns on freely floating smectic bubbles, a model was developed that describes a wavelength selection mechanism.16 In order to test the predictions of the model, we have determined the pattern wavelengths in different experiments. Usually, two to three homogeneously thick regions can be chosen in each experiment. We excluded all regions where the film either has thickness gradients or where the determination of the film thickness was ambiguous. Fig. 9 shows the film thickness dependence of the visible undulations.
Another aspect of the film dynamics is that the wrinkles disappear, starting from the outer edge of the film, when the film bulges out of the original plane. Then, the compressing radial forces are relieved and the wrinkles flatten. This is seen in Fig. 6b, where the dark stripes indicating wrinkles disappear in the outer regions of the film. Similarly, the film flattened again in the outer regions of Fig. 8, top. Fig. 10 shows this phenomenon in detail for a selected experiment. About 5 ms before the pinch-off, the complete central film is covered by wrinkles, and the film begins to leave its axial position towards one of the catenoid holders. The images show the film 3.2 ms and 2.4 ms before pinch-off, respectively. The wrinkle pattern can be seen both in side and axial views. It disappears in the regions where the film can escape to an axial orientation.
On the other hand, the Plateau border contains smectic bulk material in non-negligible quantities. The rapid shrinkage of the contact line between the films forces the border to develop large amplitude undulations as well, as is seen in Fig. 10. These undulations cannot be relieved by the bulging of the central film, so they persist until the pinch-off. The cause of this instability is similar to that for the film wrinkles: The smectic material contained in the previous Plateau border cannot be redistributed fast enough, so that the border keeps its length, or reduces it only slightly, while the circumference of the catenoid waist shrinks.
5 Discussion
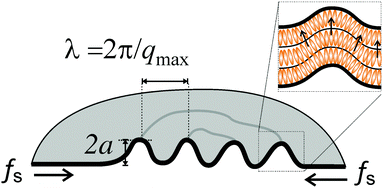
An explanation of the wrinkling mechanism has been proposed in ref. 16. A similar model can be used here. The wavelength is selected dynamically. We assume that a broad wavelength spectrum of film undulations consists of independently growing or shrinking modes in the initial linear regime of low amplitudes. The dispersion relation of those modes gives a wavelength of the fastest growing mode, which will dominate the pattern. The surface area of the film is assumed to be constant on the time scale of wavelength selection. A sketch of the wrinkling film is shown in Fig. 11.It was assumed that three essential combatants are involved: The first one is a radial force of the Plateau border and catenoid film acting on the outer periphery of the central film that causes reduction of the film diameter. The second, counteracting force originates from the elastic deformation of the smectic layers and involves splay distortions of the director field. The third contribution arises from the redistribution of air on both sides of the film from the hills to the valleys of the undulation. Under the assumption that the thickness of the flowing air layers is roughly of the order of the undulation wavelength, a selected wavelength of
 | (6) |
At larger deformations, one may have to include other elastic terms in the model for the wrinkling dynamics, in particular the smectic layer compression modulus. It does not play a role in the linear approximation. Upon further compression of the film after the wavelength selection, the pattern becomes compressed as well, the undulations are fixed to the local film material.16
When this model and the film thickness dependence of eqn (6) is compared to the experimental data of Fig. 9, one finds a qualitative agreement at least in the clear trend, even though the experimental accuracy does not allow to confirm a square root dependence of λ(d).
In the model,16 the growth rate of the fastest mode is proportional to d−1/2. The experimental observation that wrinkles appear earlier in thin film regions is consistent with this expected dependence of the growth rates. Note that the data of Fig. 9 were compiled from approximately one dozen experiment runs. Comparison with eqn (6) presupposes that the external compressing force fs is always the same. This assumption seems to be justified since the collapse dynamics of all evaluated catenoids is similar. A crude estimate of the coefficients of eqn (6) from the experimental data of Fig. 9 is λ ≈ 0.25 m1/2 . Together with an estimate of a typical splay elastic constant K11 of the order of 10 pN, this yields a radial force per length fs of the order of 20 nN m−1. This force is larger than that estimated for the forces acting in the freely floating bubbles. It is not easy to compare both experiments on a quantitative level since in the bubble experiment, complex air flow and pressure conditions around the bubble cause the film deformations. In the experiments with filled catenoids the situation is much more reproducible. A quantitative prediction of the forces acting on the central film, however, requires some complex computations, taking into account the surface area reduction of the catenoid segments as well as the energy dissipated in the airflow out of the catenoids. It can be done in principle, but was beyond the scope of the present study.
An explanation for the slightly stronger than square-root dependence of the wavelength on the film thickness could be that the thicker regions are primarily islands that are surrounded by dislocations. At these dislocations, the smectic material preferentially collects in the form of chunks (Fig. 7). This relieves the compressing forces inside the island, thus leading to comparably larger wavelengths of the wrinkles.
The wrinkles form as a consequence of the different timescales of film area shrinkage (fast) and reorganization of the smectic film material in chunks or islands (slow) or flow into the Plateau borders (slow). Thus, the wrinkles disappear as soon as the compression rate drops below a certain value or if the film area shrinkage is even reversed to expansion. When the central film bulges out of its original level (Fig. 10), the regions where the film is still rather flat remain compressed while the outer regions where the film escapes into the third dimension can relieve compression. This is the reason why the wrinkles disappear, starting from the film periphery, when the central film bulges out of the equatorial plane of the catenoid.
6 Summary
We have demonstrated a method for quick film area reduction of smectic freely suspended films. In contrast to earlier methods21–23 where the area reduction is driven by the surface tension of the film itself, the catenoid collapse produces a much faster area shrinkage. Because of the axial symmetry of the initial catenoid, the shrinkage is isotropic in the plane. The shrinking films are initially flat and the wrinkle formation occurs in the flat films, in contrast to earlier observations in freely floating bubbles.16 A formation of bulges within islands that was found in freely floating bubbles was not observed in the flat films.In principle, one can control the dynamics of the catenoid collapse by using different atmospheric pressures, or by replacing the surrounding gas by a gas of different density. One may also limit the effusion rate of gas through the catenoid holder rings. The gas flow is the limiting factor of the catenoid collapse in the final stage of our experiments when wrinkling sets in. In addition to the wrinkle formation of the flat films, we also observe the undulation of the film border (Fig. 5 and 10). The smectic material contained in the former Plateau border cannot be redistributed fast enough. Thus, the length of this region cannot quickly adapt to the shrinking catenoid waist without forming undulations. The dominating wavelength is of the order of 100 μm. Here, another model must be sought for the wavelength selection mechanism.
There are several advantages of the present experimental technique over the observation of wrinkles in smectic free-floating bubbles. A pronounced advantage is that one finds film regions of different thicknesses in one and the same film. Thus, the wrinkling wavelength and its dependence on film thickness can be measured in a single experiment. Another advantage is the good reproducibility of the experiment. Furthermore, the results show that the local curvature of the background film is irrelevant for the pattern formation mechanism, in contrast to wrinkles described by Paulsen et al.30 The nature of the compression forces is easier analyzed in the present experiment. Whereas in the freely floating bubbles, the air flow around the bubble is difficult to determine and to estimate, a quantitative evaluation of the forces acting on the Plateau border in a filled capillary should in principle be possible by numerical simulation of the film and air dynamics.
The importance of the present experiment is twofold. First, it provides an easy access to a unique pattern forming mechanism in low viscosity fluids, without the need for microgravity experiments. Second, the evaluation of the wavelengths and in particular their film thickness characteristics provides novel information on the resistance of smectic films to bending of the layers. In our model, we have explained this bending rigidity by the splay deformations of the director, assuming a smectic A model for the films. Actually, our films are initially in the smectic C phase where the model is not quite correct, but one may expect a compression-induced phase transition to the smectic A phase similar to rupturing bubbles.24 We have not been able to prepare filled catenoids of smectic A films so far, mainly because smectic A films are less robust to rupture during fast shape transformations. An important future step will be the extension of these observations to other smectic materials, in order to elucidate the influences of material parameters on the pattern structure and dynamics.
Author contributions
All authors contributed equally to this manuscript.Conflicts of interest
There are no conflicts of interest to declare.Acknowledgements
This study was funded by DFG with project STA 425/40 and by DLR within project 50WM2054. KH was supported by DFG with project HA8467/2-1. The authors acknowledge Kira Zierau for participating in some experiments.References
- E. Cerda and L. Mahadevan, Phys. Rev. Lett., 2003, 90, 074302 CrossRef CAS PubMed.
- J. Genzer and J. Groenewold, Soft Matter, 2006, 2, 310 RSC.
- L. Pocivavsek, R. Dellsy, A. Kern, S. Johnson, B. Lin, K. Y. C. Lee and E. Cerda, Science, 2008, 320, 912 CrossRef CAS.
- N. Liu, W. M. Huang, S. J. Phee and T. H. Tong, Smart Mater. Struct., 2008, 17, 057001 CrossRef.
- J. Huang, B. Davidovitch, C. D. Santangelo, T. P. Russell and N. Menon, Phys. Rev. Lett., 2010, 105, 038302 CrossRef PubMed.
- Y. Zhao, W. M. Huang and Y. Q. Fu, J. Micromech. Microeng., 2011, 21, 067007 CrossRef.
- Y. Tokudome, K. Suzuki, T. Kitanaga and M. Takahashi, Sci. Rep., 2012, 2, 683 CrossRef.
- A. Agrawal, P. Luchette, P. Palffy-Muhoray, S. L. Biswal, W. G. Chapmana and R. Verduzco, Soft Matter, 2012, 8, 7138 RSC.
- H. Soni, R. A. Pelcovits and T. R. Powers, Phys. Rev. E, 2016, 94, 012701 CrossRef.
- M. Pineirua, N. Tanaka, B. Roman and J. Bico, Soft Matter, 2013, 9, 10985 RSC.
- N. Bowden, S. Brittain, A. G. Evans, J. W. Hutchinson and G. M. Whitesides, Nature, 1998, 393, 146 CrossRef CAS.
- G. Debrégeas, P. de Gennes and F. Brochard-Wyart, Science, 1998, 279, 1704–1707 CrossRef.
- R. da Silveira, S. Chaïeb and L. Mahadevan, Science, 2000, 287, 1468–1471 CrossRef CAS.
- A. T. Oratis, J. W. M. Bush, H. A. Stone and J. C. Bird, Science, 2020, 369, 685 CrossRef CAS PubMed.
- K. Harth, PhD thesis, Otto von Guericke University, Magdeburg, 2016.
- K. Harth, T. Trittel, K. May and R. Stannarius, Soft Matter, 2019, 15, 6769 RSC.
- P. Oswald and P. Pieranski, Smectic and Columnar Liquid Crystals: Concepts and Physical Properties Illustrated by Experiments, Taylor & Francis, Boca Raton, 2005 Search PubMed.
- S. Lagerwall, Ferroelectric and Antiferroelectric Liquid Crystals, Wiley-VCH, 1999 Search PubMed.
- Z. H. Nguyen, M. Atkinson, C. S. Park, J. Maclennan, M. Glaser and N. Clark, Phys. Rev. Lett., 2010, 105, 268304 CrossRef.
- A. Eremin, S. Baumgarten, K. Harth, R. Stannarius, Z. H. Nguyen, A. Goldfain, C. S. Park, J. E. Maclennan, M. A. Glaser and N. A. Clark, Phys. Rev. Lett., 2011, 107, 268301 CrossRef CAS PubMed.
- C. D. Muzny and N. A. Clark, Phys. Rev. Lett., 1992, 68, 804–807 CrossRef PubMed.
- C. Muzny, PhD thesis, University of Colorado at Boulder, 1994.
- P. Oswald, J. Phys., 1987, 48, 897–902 CrossRef.
- T. Trittel, K. Harth and R. Stannarius, Soft Matter, 2017, 13, 3199 RSC.
- K. Harth and R. Stannarius, Ferroelectrics, 2014, 468, 92–100 CrossRef CAS.
- K. May, K. Harth, T. Trittel and R. Stannarius, Europhys. Lett., 2012, 100, 16003 CrossRef.
- K. May, K. Harth, T. Trittel and R. Stannarius, ChemPhysChem, 2014, 15, 1508 CrossRef CAS PubMed.
- F. Müller and R. Stannarius, Europhys. Lett., 2006, 76, 1102 CrossRef.
- P. Dähmlow, T. Trittel, K. May, K. Harth and R. Stannarius, Liq. Cryst., 2018, 45, 993 CrossRef.
- J. D. Paulsen, E. Hohlfeld, H. King, J. Huang, Z. Qiu, T. P. Russell, N. Menon, D. Vella and B. Davidovitch, Proc. Natl. Acad. Sci. U. S. A., 2016, 113, 1144 CrossRef CAS PubMed.
- M. Ito and T. Sato, Eur. J. Phys., 2010, 31, 357–365 CrossRef.
- M. M. Alimov and K. G. Kornev, Fluid Dyn., 2019, 54, 44–57 CrossRef.
- M. M. Alimov, A. V. Bazilevsky and K. G. Kornev, Phys. Fluids, 2021, 33, 052104 CrossRef CAS.
- J.-C. Geminard, A. Zywocinski, F. Caillier and P. Oswald, Philos. Mag. Lett., 2004, 84, 199 CrossRef CAS.
- T. Trittel, R. Aldred and R. Stannarius, Philos. Mag., 2011, 91, 2343 CrossRef CAS.
- R. Stannarius, C. Cramer and H. Schüring, Mol. Cryst. Liq. Cryst., 1999, 329, 1035 CrossRef CAS.
- T. Trittel, K. Harth, C. Klopp and R. Stannarius, Phys. Rev. Lett., 2019, 122, 234501 CrossRef CAS PubMed.
| This journal is © The Royal Society of Chemistry 2022 |

