 Open Access Article
Creative Commons Attribution 3.0 Unported Licence
Transition in the growth mode of plasmonic bubbles in binary liquids†
Marvin
Detert
 ab,
Yibo
Chen
a,
Harold J. W.
Zandvliet
 b and
Detlef
Lohse
 *ac
*ac
aPhysics of Fluids Group, Department of Science and Technology, Max Planck Center for Complex Fluid Dynamics and J. M. Burgers Centre for Fluid Dynamics, MESA+ Institute for Nanotechnology, University of Twente, 7500AE Enschede, The Netherlands. E-mail: d.lohse@utwente.nl
bPhysics of Interfaces and Nanomaterials, MESA+ Institute for Nanotechnology, University of Twente, 7500 AE Enschede, The Netherlands
cLaboratory for Fluid Physics, Pattern Formation and Biocomplexity, Max Planck Institute for Dynamics and Self-Organization, 37077 Göttingen, Germany
First published on 12th May 2022
Abstract
Multi-component fluids with phase transitions show a plethora of fascinating phenomena with rich physics. Here we report on a transition in the growth mode of plasmonic bubbles in binary liquids. By employing high-speed imaging we reveal that the transition is from slow evaporative to fast convective growth and accompanied by a sudden increase in radius. The transition occurs as the three-phase contact line reaches the spinodal temperature of the more volatile component leading to massive, selective evaporation. This creates a strong solutal Marangoni flow along the bubble which marks the beginning of convective growth. We support this interpretation by simulations. After the transition the bubble starts to oscillate in position and in shape. Though different in magnitude the frequencies of both oscillations follow the same power law  , which is characteristic of bubble shape oscillations, with the surface tension σ as the restoring force and the bubble's added mass as inertia. The transitions and the oscillations both induce a strong motion in the surrounding liquid, opening doors for various applications where local mixing is beneficial.
1 Introduction
Bubbles and bubble nucleation are omnipresent in a wide variety of phenomena in nature and technology ranging from everyday life, such as boiling and sparkling wine, via industrially relevant fields like catalysis and electrolysis, to medical applications, such as ultrasound contrast agents.1–4 The richness of phenomena becomes even larger in multicomponent systems,5 in particular when they involve phase transitions.6One example of such a system is a plasmonic bubble, which is created at immersed noble metal nanoparticles irradiated by a laser.7–13 In such a system light absorption via surface plasmon resonance leads to abundant heat causing the nucleation and growth of bubbles.1,6 These bubbles are initially almost solely composed of vapor, but eventually grow to be dominated by diffusion of dissolved gas from the surrounding liquid.14–17 Multiple recent studies elucidated a variety of fascinating phenomena occurring with plasmonic bubbles, such as a competition between solutal and thermal Marangoni forces leading to a bouncing bubble in the early growth stages,18 the formation of droplet plumes due to a Marangoni instability in ternary liquids19 or the deposition of gold nanoparticles from a suspension.20 Moreover, a multitude of potential applications of these bubbles has been demonstrated, e.g. in catalysis,21–23 medicine24–28 or microfluidics.29–32
This paper adds another surprising phenomenon to the rich phenomenology of physiochemical hydrodymanics involving plasmonic bubbles in binary liquids. Again, it builds on the preferential evaporation of one component of the binary liquid, which can lead to a bouncing bubble in the early growth stage via competing thermal and solutal Marangoni forces.18 The key idea here is to carry this on even further and to study what happens if we now take a drastic difference in the volatility of the two components of the binary liquids, much larger than we did before in Zeng et al. (2021).18 As we will see, this will lead to even stronger preferential evaporation and thereby larger concentration gradients, which gives rise to two new phenomena: one is a sudden, instantaneous transition in growth mode that is found for a variety of binary liquids. We study this experimentally via highspeed imaging and compare our results with simulations in order to identify the driving mechanism. The other phenomenon is a bubble oscillation right after the transition with a frequency that differs by an order of magnitude from that of the bouncing bubble. To rationalize our findings we propose a mechanism based on the competition between inertia and surface tension.
The paper is organised as follows: first, the experimental setup and the preparation of binary liquids are introduced in Section 2. Then, the transition in the growth mode is described in Section 3.1, followed by an detailed examination in Section 3.2. From this a mechanism is derived in Section 3.3 and supported by simulations. In Section 4 the bubble oscillations are discussed and compared to established theoretical predictions. Finally, the paper ends with conclusions and an outlook on further experiments and applications in Section 5.
2 Experimental setup and procedure
2.1 Experimental setup
A fused silica substrate decorated with an array of gold nanoparticles (d ≈ 70 nm) was placed in a quartz cuvette (10 × 10 × 45 mm) filled with a binary liquid (as described in detail in an earlier study19). To create plasmonic bubbles the array was irradiated with a continuous, 532 nm laser (Cobalt Samba, 532 nm, 300 mW) from the bottom with a laser spot diameter of dL ≈ 40 μm. A polarizer and a half-wave plate were used to control the laser power which was measured via a photodiode power sensor (S130C; ThorLabs). The bubble dynamics was captured with two high-speed cameras; one for the bottom-view (Photron SA7/NOVA S16) and the other for the side-view (Photron SAZ/NOVA S12). Both cameras were equipped with a 5× working distance objective (LMPLFLN; Olympus) and were operated at frame rates up to 5 kHz. Two light sources, a Schott ACE I and a Schott KL2500, provided back light illumination for the high-speed imaging.2.2 Binary liquid preparation
In order to study a wide range of parameters multiple binary liquids at different mixing ratios were prepared. We first performed a coarse scan of the binary liquids in steps of 10% volume fraction. Then, regions of interest were mapped with steps of 2% volume fraction. To avoid evaporation, the mixtures were immediately transferred to the cuvette after preparation. Every binary liquid we used was composed of acetone with another miscible organic solvent, such as benzyl alcohol (BnOH), cyclohexanone (CHN), 1-heptanol and 1-butanol all from Sigma-Aldrich. These liquids were chosen as they have a significantly higher boiling temperature than acetone (see Table 1) and hence are less volatile. Additionally, they have a higher refractive index than acetone, in particular BnOH. Therefore, changing the local concentration due to preferential evaporation will change the refractive index, which should become qualitatively visible in the imaging.| Property | Benzyl alcohol | Cyclohexanone | 1-Heptanol | 1-Butanol | Acetone |
|---|---|---|---|---|---|
| Refractive index | 1.54 | 1.45 | 1.42 | 1.40 | 1.36 |
| Boiling temperature (K) | 478.5 | 428.5 | 449.7 | 390.8 | 329.2 |
| Density (kg m−3) | 1046 | 947 | 822 | 810 | 790 |
| Thermal cond. (W (m K)−1) | 0.156 | 0.149 | 0.159 | 0.135 | 0.157 |
| Heat capacity (J (mol K)−1) | 124.8 | 124.8 | 173.5 | 173.7 | 123.7 |
| Latent heat of vap. (kJ mol−1) | 46.9 | 37.3 | 46.0 | 43.3 | 29.1 |
| Surface tension (mN m−1) | 39.1 | 34.9 | 26.8 | 24.5 | 23.7 |
| Viscosity (mPa s) | 5.93 | 2.26 | 6.92 | 2.94 | 0.32 |
| Vapor pressure (kPa) | 0.008 | 0.40 | 0.02 | 0.64 | 24.50 |
| Transition | Yes | Yes | Yes | No | — |
3 Transition in growth mode
3.1 Phenomenology
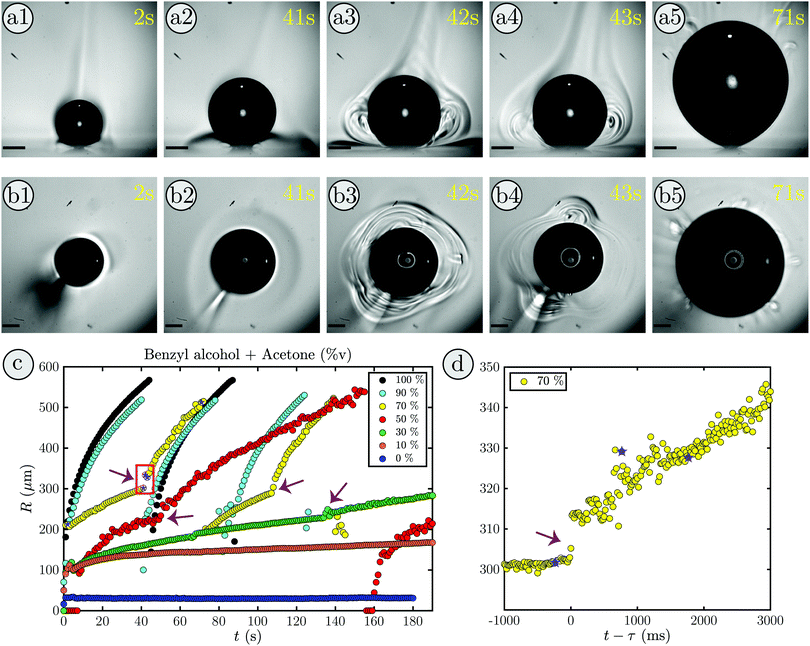
An interesting phenomena occurred when a bubble grows in a binary liquid composed of 30%v benzyl alcohol and 70%v acetone. Supplementary movie 1, ESI† shows the measured bubble radius (right) during the bubble growth viewed from the bottom (left) and the side (middle). Snapshots of the first growth cycle are shown in Fig. 1(a1)–(b5), (a) in side-view and (b) in bottom-view.Initially, the bubble grows slowly (a1-a2), as expected, and a shadow forms close to the substrate (in Fig. 1(a2)). Similarly, in the bottom-view (in Fig. 1(b2)) the surrounding of the bubble shows a slight change in contrast. Moreover, a brighter plume above the bubble can be identified which corresponds to the bright structure in the bottom left of Fig. 1(b2). After 42 s, as shown in (a3), a sudden transition occurs and plume-like structures with rolls inside appear next to the bubble, while the shadowed region almost vanishes. The bottom-view in (b3) shows that this happens in every direction with three dominant plumes forming. Additionally, the transition is accompanied by a distinct increase in bubble size. At 43 s two plumes remain (see (b4)) and the rolls have developed further, while the depletion zone is completely gone (see (a4)). Then, the rolls and the bubble keep growing (see supplementary movie 1, ESI†) until the bubble reaches its maximum volume in (a5) and detaches. Afterwards, the whole process repeats itself. Additionally, after the transition, some bubble oscillations can be seen in supplementary movie 1 (ESI†). These oscillations will be discussed in detail in Section 4.
The contrast changes in the rolls and shadowed region only occur for mixtures and not in pure fluids. They are most pronounced if the difference in volatility and refractive index of the components of the binary liquid is large. Therefore, we interpret this as a change in the local refractive index due to a change in the local acetone concentration. Hence, the shadowed region in the beginning is considered to be a region of acetone depletion, whereas the plume above the bubble appears due to acetone enrichment caused by acetone vapor condensation. In addition, that means the rolls at the transition reflect the changes in the local acetone concentration and thereby indicate the onset of liquid motion along the rolls.
The evolution of the radius during the bubble growth is shown in Fig. 1(c) in yellow. The point at which the bubble undergoes a transition in growth mode (42 s) is clearly visible by a distinct increase in radius (red box). In movie Supplementary: Movie 2, ESI† and Fig. 1(d) the transition at τ = 41.23 s is shown in detail. Clearly, the jump in radius is almost instantaneous and the growth behavior changes drastically. Before the transition the growth of the radius is slow and dominated by the influx of dissolved air contained in the binary liquid as observed before for n-alkanes.14 However, after the transition the bubble grows rapidly until it detaches and the original growth mode is recovered for the new bubble. This, in conjunction with the formation of rolls around the bubble indicates that the bubble undergoes a transition from slow evaporative to convective growth. Prior studies from Zeng et al. (2021) support this as they have observed a strong flow near the bubble via particle image velocimetry measurements in the same system with an ethanol–water binary liquid.18
By systematically varying the mixing ratio of the binary liquid, the acetone fraction range in which the bubble undergoes a transition can be determined. Some exemplary cases are shown in Fig. 1(c). While the bubble undergoes a transition for intermediate acetone ratios (fA = 30–70%v) there is none in pure acetone (black), nor in pure benzyl alcohol (blue), nor in binary mixtures close to these pure liquids (fA = 90%v and fA = 10%v). Moreover, with increasing fA the bubble grows faster, irrespective of whether a transition takes place or not. This is readily explained by the fact that the bubble is mostly composed of air11,15,17 and the dissolved air entering the bubble during the evaporation of acetone is its main contributor. In comparison to water, where the air influx is purely diffusion driven,11 for the organic liquids the air solved in the fluid that enters when the fluid evaporates becomes more important. This is the case, because the solubility of air decrease in water with temperature, but increases in most organic liquids. Hence, the surrounding, heated fluid becomes slightly under-saturated in our case and hinders the growth via diffusion. Consequently, more available acetone implies that more acetone evaporates and more air enters the bubble, thereby accelerating the bubble growth.
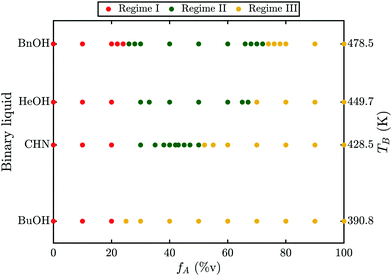
To investigate whether this phenomenon is limited to a specific binary liquid, the experiments have been repeated for acetone mixed with either CHN or 1-heptanol or 1-butanol. While no transition could be observed for the case of 1-butanol, both CHN and 1-heptanol exhibit a transition and a similar behavior to benzyl alcohol. The results for these binary liquids are summarized in a phase diagram in Fig. 2. For all combinations shown, three different regimes can be identified. First, for low acetone ratios the bubble grows slowly and undergoes no transition (regime I, red). Then, for intermediate ratios the bubble undergoes a transition in growth mode (regime II, green). Finally, for high acetone ratios no transition occurs and the bubble grows fast and detaches (regime III, yellow). Regime II ranges from fA = 26–72%v for BnOH (a), fA = 30–67%v for 1-heptanol (b), fA = 30–50%v for CHN (c) and does not exist for 1-butanol. Clearly, the size of regime II depends on the fluid as it decreases from BnOH via 1-heptanol, and CHN to 1-butanol. Comparing the liquids properties, listed in Table 1, the boiling temperature (TB, right axis in Fig. 2) matches the decrease in regime II and hence we identify TB as the most probable determining parameter. In order to understand why TB should be relevant and what mechanism causes the bubble to undergo a transition, a more detailed examination of this phenomenon is required.
3.2 Behavior at the transition
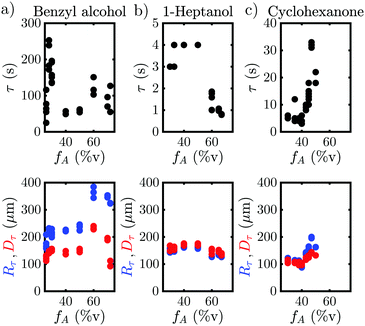
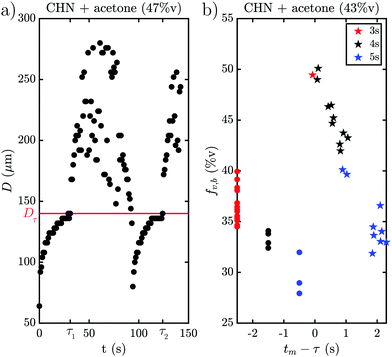
The behavior when the bubble undergoes a transition in growth mode is shown in Fig. 3 for the three cases BnOH (a), 1-heptanol (b) and CHN (c). The top row shows the time τ after nucleation at which the transition occurs and the bottom row the footprint diameter Dτ (red) and the bubble radius Rτ (blue) right before the transition as a function of the acetone ratio fA. Noticeably, τ varies drastically between the different fluids from a rapid transition τ < 5 s for 1-heptanol via multiple seconds τ < 40 s for CHN up to a few minutes τ < 260 s for BnOH. Moreover, we note that τ does not follow the trend in TB as TB (HeOH) > TB (CHN), but instead seems to depend on the surface tension (σ), as σ (BnOH) > σ (CHN) > σ (HeOH). On the other hand, Rτ is of the same order of magnitude for all three binary liquids ranging from Rτ = 158–385 μm for BnOH, Rτ = 126–183 μm for 1-heptanol and Rτ = 84–200 μm for CHN. Surprisingly, there is a sudden increase in Rτ and Dτ for the case of BnOH fA = 60%v. Remarkably, Dτ lies almost completely between 100–200 μm for all measured cases (except for the aforementioned BnOH with fA = 60%v) and remains almost constant. Considering that the bubble cross section Dτ at the wall at transition is rather constant, while τ and Rτ vary for the various cases, it seems worthwhile to further investigate the region close to the wall and the exact temporal behavior of the footprint diameter D (t). An exemplary case of the whole evolution of the footprint diameter D (t) is shown in Fig. 4(a) for CHN with fA = 47%v. While D (t) initially grows, it starts to stabilize before each transition with Dτ = 140 μm at τ1 = 31 s and τ2 = 124 s, respectively. Right after each transition at τ, D (t) increases rapidly. While this is similar to the behavior of the bubble radius R(t), it differs by the stabilization before the transition and the fact that Dτ is comparable for all binary liquids. Furthermore, if we take another look at supplementary movie 2 (ESI†), the gradients in grey-scale and the plumes appear first at the three-phase contact line. All this indicates that the mechanism originates at the three-phase contact line.Another question which arises is whether the drastic change in bubble volume at the transition is caused by an influx of gas, evaporation or a combination of both? To find out, the bubble composition has been determined by studying the shrinkage of the bubble after exposure to a laser pulse, as done by Zaytsev et al.16 The method employed in that paper is based on the fact that the condensation of vapor is orders of magnitude faster than the dissolution of gas. Hence, the initial drop in bubble volume during its shrinkage reflects the vapor fraction. The remainder of the bubble content is gas (i.e. air). The result of this method is shown in Fig. 4(b) for CHN with fA = 43%v, where red, black and blue indicate a laser pulse length of 3 s, 4 s and 5 s, respectively. Without a transition the bubble consists mostly of gas with a vapor fraction fv,b ≈ 33%v, which is slightly lower for longer exposure (blue curve) as the bubble has more time to grow via diffusion. However, right after the transition the vapor fraction instantly jumps to fv,b = 50%v and then decreases within 2 s back to the pre-transition level of fv,b ≈ 33%v. So, the transition is accompanied by a drastic change in composition and the mechanism thus explains the initial burst of vapor production and bubble growth. With this we have collected enough hints to explain the mechanism.
3.3 Driving mechanism of the transition
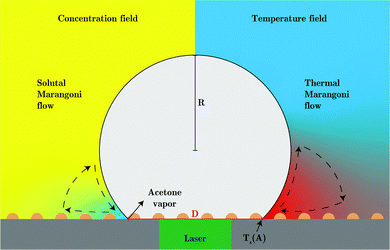
Summarizing the earlier results, the boiling temperature of the fluid determines whether a transition takes place. The evaporation happens at the stagnating three-phase contact line and is accompanied by an initial burst of vapor production. Combining all these facts we propose a mechanism that explains why the bubble undergoes a transition in the growth mode. First, we determine the Jakob number Ja, which is the ratio between the heat needed to reach the boiling temperature of the liquid (sensible heat) and the latent heat of vaporization. For all cases that exhibit a transition we find 0.2 < Ja < 0.7, showing that most energy is spend on the evaporation of the liquid and not on heating it. Consequently, evaporative cooling is important in our system.Initially, the bubble grows fast and exceeds the area that is heated by the laser. Then, the bubble growth slows down and the footprint diameter D (t) remains constant. As D (t) stagnates, acetone replenishment only occurs via diffusion and hence the local acetone concentration decreases, thus reducing the evaporation rate. Since the evaporative cooling decreases, while the heat influx due to the continuous laser irradiation remains the same, the temperature at the contact line slowly increases. As long as the boiling temperature of the less volatile fluid is comparable to the spinodal temperature of acetone Ts (A) ≈ 0.9Tc = 457 K,35 it should not evaporate significantly. Thereby, it neither limits the temperature increase due to latent heat, nor contributes to the vapor fraction fv,b in the bubble. Once the temperature of the contact line reaches Ts (A), the latent heat of vaporization of acetone vanishes and almost all the remaining acetone in the mixture near the contact line will instantly evaporate without energy cost. This leads to a jump in bubble radius R (t) and also increases the vapor fraction fv,b inside the bubble as the additional volume is solely composed of vapor. At the same time, the rapid evaporation causes a sudden decrease in the local acetone concentration fA,l at the contact line. Hence, a strong gradient in surface tension to the ambient fA is created along the bubble, as fA,l ≪ fA, which leads to Marangoni flow. This flow ambient liquid along the bubble interface and marks the onset of streaming, as sketched in Fig. 5. The thermal Marangoni flow can be neglected, as the Marangoni numbers for the solutal and thermal Marangoni flow are  and
and  , i.e. Mas ≫ Mat. Here μ is the dynamic viscosity of the binary liquid, Δσc and ΔσT are the surface tension gradients caused by concentration and temperature and α and κ are the mass and thermal diffusivity. Once the flow sets in, it will supply fresh fluid with the ambient acetone concentration fA to the contact line, where acetone will preferentially evaporate. Consequently, a concentration gradient is maintained, allowing the streaming to persist. Besides that, the incoming fresh fluid will reduce the size of the depletion zone. As acetone contains more dissolved air than the less volatile fluids and evaporates easier, the growth of the bubble will accelerate once convection sets in and be similar to pure acetone (as observed in Fig. 1). As the growth is again dominated by the influx of dissolved air, the bubble composition shifts back towards the lower vapor fraction shortly after the transition.
Because this mechanism predicts a transition only when the boiling temperature Tb of the less volatile fluid is comparable to the spinodal temperature Ts (A) of the volatile one, it explains why no transition occurs for 1-butanol and why regime II increases with Tb. Besides this, it also explains why no transition occurs close to the pure fluids. For high fA the bubble grows too fast to reach Ts (A) at the contact line. On the other hand, for low fA the concentration gradient to the local fA,l is small and therefore the Marangoni flow becomes weak and not enough acetone can be resupplied to enhance the growth. Besides this, it provides a potential explanation to the surprising behavior of τ that seems to depend on the surface tension. It might be caused by the contact angle of the fluid, as it increases on the hydrophilic substrate from BnOH via CHN to HeOH, presumably due to their surface tensions. As the contact angle increases and approaches 90°, the heated liquid layer trapped between the bubble and the substrate shrinks and thereby reduces the distance between fA,l and fA. In turn, this could facilitate the onset of the solutal Marangoni flow and thereby decrease τ.
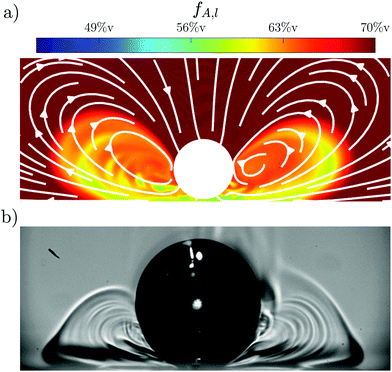
In order to verify this suggested mechanism, simulations for a Marangoni instability at a catalytic plane are performed (details of this simulation can be found in Li et al. (2021)19). The result of the simulations for Mas = 5 × 10⁵ is shown in Fig. 6(a) and compared to the experimental data. Both cases show the bubble at t–τ = 0.5 s with Rτ = 300 μm. However, the simulations do not take into account bubble growth, so that the bubble is 5% larger in the experiment compared to the simulation with Re (t) = 315 μm and Rs (t) = 300 μm, respectively. For the simulations the local acetone concentration fA,l is shown via a color map, while the resulting flow is indicated by white arrows. The concentration gradients in the experimental data are indicated by different shades of gray. There is good qualitative agreement between the simulations and experiments as both show the same rolls and general structure. This further supports that the mechanism originates from a Marangoni instability.
The mechanism also predicts the same transition for other binary liquids as long as Tb of the less volatile fluid is comparable to Ts of the volatile one. One such combination is BnOH (Tb = 478.5 K) with ethanol (Ts (E) ≈ 464 K).35 Indeed, a transition could also be observed for this binary fluid as shown in supplementary movie 3 (ESI†) though no systematic analysis has been performed.
Summarizing this section, we conclude that the proposed mechanism is consistent with all our observations and explains why and when a bubble undergoes a transition in growth behavior.
4 Bubble oscillations
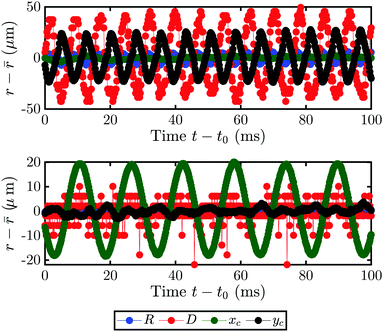
As eluded in Section 3, the bubble not only grows faster after the transition, but can also be accompanied by oscillations. Two different kinds of motion can be observed: the bubble can either oscillate about its spherical shape or be displaced partially from the laser spot and orbit around it. While both clockwise and counterclockwise orbiting can occur, once one is present the direction will not change anymore during the bubble growth. Supplementary movie 4 (ESI†) for 1-hepanol with fA = 77%v and supplementary movie 5 (ESI†) with fA = 72%v respectively show exemplary cases of these motions in bottom- and side-view.In order to understand this phenomenon, we investigated the behavior on the much shorter timescale of milliseconds. The motion of the bubble is recorded in side-view and parameters such as the motion of its center-coordinates xc (t), yc (t), radius R (t) and the footprint diameter D (t) are extracted. Fig. 7 shows the bubble motion as deviation of the mean for an example of the oscillation (a) and the orbiting (b) from t0 = 7 s. The directions x and y are parallel and perpendicular to the substrate, respectively. In the case of an oscillating bubble, the bubble remains pinned to the laser spot (as xc (t) remains constant) and oscillates in shape as yc (t) shows a clear periodic signal. Interestingly, D (t) oscillates with the same frequency as yc (t), albeit with a phase shift of about 180°. In contrast, the orbiting motion is not accompanied by any other motion as only xc (t) oscillates. Additionally, the frequency of the oscillation and orbiting are clearly different. However, a bubble can switch from one kind of motion to another during its growth.
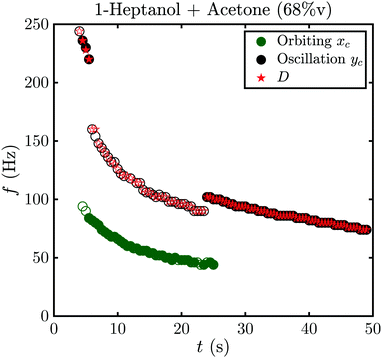
An example of this is shown in Fig. 8 for fA = 68%v, where the frequency during the whole life of the bubble is shown as a function of time. Closed symbols represent the main motion of the bubble, whereas open symbols also consider small amplitude oscillations. In both cases the bubble starts with shape oscillations yc (t) (black) which are accompanied by oscillations of the footprint diameter D (t) (red). Then, the motion switches to orbiting xc (t) (green) with a brief moment at t = 5.5 s where both motions are present and overlap. If only large amplitude motions are considered, there is no other motion present until shape oscillations appear again at t = 24 s and become dominant at t = 25 s. However, if small amplitude oscillations are not neglected oscillations in yc (t) and D (t) become visible during the orbiting. Surprisingly, those oscillations have about twice the frequency of xc (t) with  . Additionally, they have a different frequency compared to the same motion with a large amplitude (closed symbols), as clearly visible at t = 24 s. Therefore, in the following analysis only the large amplitude oscillations will be considered. The reason why the bubble switches motion is not clear, however, one possible explanation could be that it is caused by an asymmetry. E.g., the local pinning could vary and lead to a small displacement of the bubble center from the laser spot. Then, the bubble would first move along a line and then undergo a transition into an orbiting motion. We have indeed observed such a behavior, though no detailed analysis has been performed.
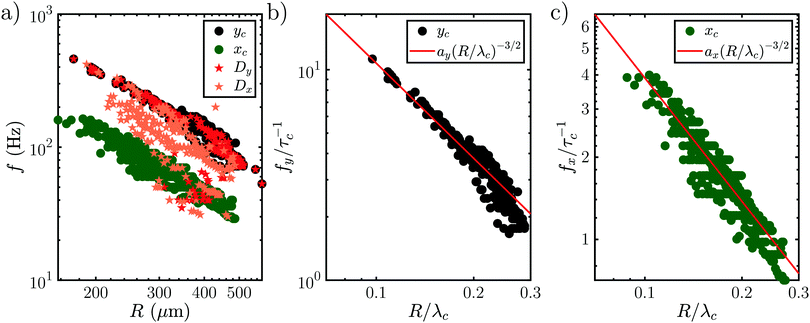
Interestingly, all data for the oscillation and orbiting modes at different laser powers and concentration collapse on one curve, as shown in Fig. 9(a). Stars show the motion in D (t) if an oscillation (Dy (t)) or orbiting (Dx (t)) is detected. Similar to Fig. 7, the frequency of D (t) matches the oscillation, but not the orbiting. However, clearly both kinds of motion follow a power law with  .
.
In order to understand this behavior we have another look at Fig. 5 where the situation is similar. In this case the bubble has grown rapidly and hence the temperature at the contact line is lower. Nevertheless, both thermal and solutal Marangoni flows are still present, since gradients in temperature and concentration remain (as sketched in Fig. 5). Similar to Section 3.3 it is reasonable to neglect the effect of the thermal Marangoni flow at the interface because Mas ≫ Mat. Then, the solutal Marangoni flow pushes the contact line inwards and in response the bubble elongates perpendicular to the substrate (along the y-axis). However, surface tension acts against this deformation and drives the bubble back to its spherical shape. Consequently, the contact line extends again and the whole process repeats itself, as for a spring-mass system. Basically, we have a small perturbation driven by solutal Marangoni flow and surface tension acts against it. Lamb determined the response frequency ω of a gas bubble in another inviscid fluid to a small perturbation of the interface using surface waves as36,37
 follows. If also viscosity is taken into account, the angular frequency ω remains the same, though damping occurs with
  , where ν is the kinematic viscosity of the surrounding fluid.36,37 This predicted power law matches the experimental findings very well. We non-dimensionalize R and f with the capillary length
  and the characteristic time
  , with g the gravitational acceleration. Both motions are shown in Fig. 9(b) and (c) with a fitted power law fiτc = ai (R/λc)−3/2, i = x, y with prefactors ai. We find ax = 0.124(2) and ay = 0.339(3) which are in order of magnitude agreement with the theoretical prediction (ay = 1). The comparatively lower prefactors are reasonable, as the theoretical prediction is for a free bubble, whereas in our experiments the bubble is at a wall. Analogous to e.g. the narcissus effect in acoustically driven shape oscillations, the wall can be replaced by a mirror image of the bubble. Both experiments and theory show that this would reduce the resonance frequency and can be understood as effectively increasing the added mass and the size of the oscillating bubble.38,39
Surprisingly, the orbiting motion also obeys the power law derived for shape oscillations. In order to understand this we have to take into account the previously neglected small amplitude oscillations (see Fig. 8). As their frequency is the second harmonic of the orbiting frequency and varies from the large amplitude oscillations, we assume they couple with the orbiting motion. We assume that they couple to the second harmonic of the dominant orbital motion, because it is the closest harmonic to their original frequency when shape oscillations are dominant. The small shape oscillations can be explained by the same mechanism used for the large amplitude oscillations, though the prefactor may change due to the coupling with the orbiting. Because of the coupling, the scaling of the small shape oscillation should transfer to the orbiting motion, too. Hence, it follows the same behavior as the large amplitude shape oscillations.
5 Conclusions and outlook
We experimentally found the new phenomenon that a transition in growth behavior of plasmonic bubbles occurs for binary liquids. This transition is driven by solutal Marangoni flow and massive evaporation once the spinodal temperature (Ts) of the more volatile fluid has reached the three-phase contact line. Consequently, this transition can only be observed in binary fluids, where the boiling temperature of the less volatile fluid (Tb) is comparable to Ts. The Marangoni flow also causes the bubble to deform. This deformation is opposed by surface tension, leading to bubble oscillations. Both shape oscillations and an orbiting motion around the laser spot are found and they follow the same power law , matching the expectation for shape oscillations. Surprisingly, the orbiting motion also follows the same power law, because it is coupled to small amplitude shape oscillations that persist during the orbiting.
Both the transition and the oscillations cause motion in a volume more than an order of magnitude larger than the bubble and hence can be very beneficial for mixing, e.g. in catalysis or microfluidics. This is particularly relevant, because a wide range of fluids can be used as long as they satisfy that one is significantly more volatile (i.e. Tb ≲ Ts).
Further experiments that study the effect of other parameters, e.g. viscosity via silicon oils, are suggested. Another interesting aspect of the mechanism is that it does not require plasmonic heating, but only a localized heat source. Thus, we envision that our results could be reproduced with other heat sources, such as small resistive heaters, which removes the need of optical access to benefit from the enhanced mixing.
Author contributions
The experiments have been performed by M. Detert and the simulations by Y. Chen. The experiments were conceptualized by M. Detert, H. J. W. Zandvliet and D. Lohse. M. Detert, H. J. W. Zandvliet and D. Lohse have contributed to the interpretation of the data and to writing the manuscript.Conflicts of interest
There are no conflicts to declare.Acknowledgements
We thank Pierre Chantelot, Xiaolai Li and Binglin Zeng for fruitful discussions. This work was supported by the Netherlands Center for Multiscale Catalytic Energy Conversion (MCEC), an NWO Gravitation programme funded by the Ministry of Education, Culture and Science of the government of the Netherlands and by the European Union's Horizon 2020 research and innovation programme under the Marie Skłodowska–Curie grant agreement No 801359. Open Access funding provided by the Max Planck Society.References
- D. Lohse, Phys. Rev. Fluids, 2018, 3, 110504 CrossRef.
- D. Chu, X. Sun, Y. Hu and J.-A. Duan, Soft Matter, 2019, 15, 7398–7403 RSC.
- J. Miguet, M. Pasquet, F. Rouyer, Y. Fang and E. Rio, Soft Matter, 2020, 16, 1082–1090 RSC.
- N. Arai, S. Watanabe, M. T. Miyahara, R. Yamamoto, U. Hampel and G. Lecrivain, Soft Matter, 2020, 16, 695–702 RSC.
- D. Lohse and X. Zhang, Nat. Rev. Phys., 2020, 2, 426–443 CrossRef.
- A. Prosperetti, Annu. Rev. Fluid Mech., 2017, 49, 221–248 CrossRef.
- A. O. Govorov and H. H. Richardson, Nano Today, 2007, 2, 30–38 CrossRef.
- Z. Fang, Y.-R. Zhen, O. Neumann, A. Polman, F. J. García de Abajo, P. Nordlander and N. J. Halas, Nano Lett., 2013, 13, 1736–1742 CrossRef CAS PubMed.
- G. Baffou, J. Polleux, H. Rigneault and S. Monneret, J. Phys. Chem. C, 2014, 118, 4890–4898 CrossRef CAS.
- X. Liu, L. Bao, M. Dipalo, F. De Angelis and X. Zhang, Sci. Rep., 2015, 5, 1–9 Search PubMed.
- Y. Wang, M. E. Zaytsev, H. L. The, J. C. Eijkel, H. J. Zandvliet, X. Zhang and D. Lohse, ACS Nano, 2017, 11, 2045–2051 CrossRef CAS PubMed.
- S. Maheshwari, M. Van Der Hoef, A. Prosperetti and D. Lohse, J. Phys. Chem. C, 2018, 122, 20571–20580 CrossRef CAS PubMed.
- G. Baffou, F. Cichos and R. Quidant, Nat. Mater., 2020, 19, 946–958 CrossRef CAS PubMed.
- M. E. Zaytsev, G. Lajoinie, Y. Wang, D. Lohse, H. J.-W. Zandvliet and X. Zhang, J. Phys. Chem. C, 2018, 122, 28375–28381 CrossRef CAS.
- X. Li, Y. Wang, M. E. Zaytsev, G. Lajoinie, H. Le The, J. G. Bomer, J. C.-T. Eijkel, H. J.-W. Zandvliet, X. Zhang and D. Lohse, J. Phys. Chem. C, 2019, 123, 23586–23593 CrossRef CAS PubMed.
- M. E. Zaytsev, Y. Wang, Y. Zhang, G. Lajoinie, X. Zhang, A. Prosperetti, H. J. Zandvliet and D. Lohse, J. Phys. Chem. C, 2020, 124, 5861–5869 CrossRef CAS.
- Y. Zhang and A. Prosperetti, Int. J. Heat Mass Transfer, 2021, 167, 120814 CrossRef CAS.
- B. Zeng, K. L. Chong, Y. Wang, C. Diddens, X. Li, M. Detert, H. J. Zandvliet and D. Lohse, Proc. Natl. Acad. Sci. U. S. A., 2021, 118, e2103215118 CrossRef CAS PubMed.
- X. Li, Y. Chen, Y. Wang, K. L. Chong, R. Verzicco, H. J. Zandvliet and D. Lohse, Phys. Rev. E: Stat., Nonlinear, Soft Matter Phys., 2021, 104, 1–11 Search PubMed.
- Q. Zhang, R. D. Neal, D. Huang, S. Neretina, E. Lee and T. Luo, ACS Appl. Mater. Interfaces, 2020, 12, 26680–26687 CrossRef CAS PubMed.
- J. R. Adleman, D. A. Boyd, D. G. Goodwin and D. Psaltis, Nano Lett., 2009, 9, 4417–4423 CrossRef CAS PubMed.
- P. Christopher, H. Xin and S. Linic, Nat. Chem., 2011, 3, 467–472 CrossRef CAS PubMed.
- G. Baffou and R. Quidant, Chem. Soc. Rev., 2014, 43, 3898–3907 RSC.
- L. R. Hirsch, R. J. Stafford, J. A. Bankson, S. R. Sershen, B. Rivera, R. E. Price, J. D. Hazle, N. J. Halas and J. L. West, Proc. Natl. Acad. Sci. U. S. A., 2003, 100, 13549–13554 CrossRef CAS PubMed.
- D. Lapotko, Nanomedicine, 2009, 4, 813–845 CrossRef CAS PubMed.
- E. Y. Lukianova-Hleb, X. Ren, J. A. Zasadzinski, X. Wu and D. O. Lapotko, Adv. Mater., 2012, 24, 3831–3837 CrossRef CAS PubMed.
- Q. Fan, W. Hu and A. T. Ohta, Lab Chip, 2014, 14, 1572–1578 RSC.
- L. Minai, M. Hamra and D. Yelin, Nanoscale, 2018, 10, 17807–17813 RSC.
- K. Zhang, A. Jian, X. Zhang, Y. Wang, Z. Li and H.-Y. Tam, Lab Chip, 2011, 11, 1389 RSC.
- K. Namura, K. Nakajima, K. Kimura and M. Suzuki, Appl. Phys. Lett., 2015, 106, 1–6 CrossRef.
- K. Namura, K. Nakajima, K. Kimura and M. Suzuki, Appl. Phys. Lett., 2016, 108, 071603 CrossRef.
- F. Tantussi, G. C. Messina, R. Capozza, M. Dipalo, L. Lovato and F. De Angelis, ACS Nano, 2018, 12, 4116–4122 CrossRef CAS PubMed.
- NIST Chemistry WebBook, NIST Standard Reference Database Number 69, ed. P. J. Linstrom and W. Mallard, National Institute of Standards and Technology, Gaithersburg MD, 20899, 2021 Search PubMed.
- K. D. Chen, Y. F. Lin and C. H. Tu, J. Chem. Eng. Data, 2012, 57, 1118–1127 CrossRef CAS.
- R. C. Reid, Am. Sci., 1976, 64, 146–156 CAS.
- H. Lamb, Hydrodynamics, Cambridge University Press, Reprinted by Dover 1945, New York, 6th edn, 1932 Search PubMed.
- C. A. Miller and L. E. Scriven, J. Fluid Mech., 1968, 32, 417–435 CrossRef.
- P. Marmottant, M. Versluis, N. de Jong, S. Hilgenfeldt and D. Lohse, Exp. Fluids, 2006, 41, 147–153 CrossRef.
- A. O. Maksimov, J. Sound Vib., 2005, 283, 915–926 CrossRef.
Footnote |
| † Electronic supplementary information (ESI) available: Experimental videos of the bubble growth and transition as well as bubble oscillations in bottom- and side-view. See DOI: https://doi.org/10.1039/d2sm00315e |
| This journal is © The Royal Society of Chemistry 2022 |

