 Open Access Article
Domain dynamics of phase-separated lipid membranes under shear flow†
Tsutomu
Hamada
 *a,
Shino
Mizuno
a and
Hiroyuki
Kitahata
 b
b
aSchool of Materials Science, Japan Advanced Institute of Science and Technology, Nomi City, Ishikawa 923-1292, Japan. E-mail: t-hamada@jaist.ac.jp
bDepartment of Physics, Graduate School of Science, Chiba University, Chiba 263-8522, Japan
First published on 24th November 2022
Abstract
The dynamical behaviour of lateral domains on phase-separated lipid vesicles under external flow is reported. A microfluidic chamber was used for the immobilization of vesicles and the application of shear. Microscopic observation revealed that domains tended to be localized at the vortex center and to exhibit a stripe morphology as the flow speed increased. We clarified the dependency of domain behaviors on the flow speed and lipid mixing fraction. The cholesterol ratio in the membrane affected these domain behaviors. Next, we investigated the growth of domains under flow. We discuss the mechanism of these trends by considering the free energy of phase separation, and reproduce the experimental results by numerical simulations. These findings may lead to a better understanding of the dynamical properties of the membrane under nonequilibrium situations and the biophysical mechanism of cellular mechanotransduction.
1. Introduction
It is important to understand the physicochemical mechanism that governs the dynamical response of a cellular interface with lipid bilayer membranes to external stimuli. The lipid membrane is a fluid self-assembled structure. The properties of soft membranes can lead to the dynamic organization of their interfacial structure. Within fluid membranes, lateral domains called lipid rafts are organized with high lipid order.1 The membrane lateral heterogeneity is considered to be a form of order–disorder liquid phase separation that develops due to the interaction between lipid molecules.2 The regulation of membrane lateral organization is essential for cell physiology. The phase-separated domains are expected to play a role in many cellular processes, such as molecular sorting, signal transduction and endocytic trafficking, where domains can be organized to effectively associate specific molecules in response to stimulation.3,4To reveal the physical properties of membrane phase separation, giant lipid vesicles have been actively studied as model membranes.5–7 Vesicles that consist of a lipid with a low melting temperature (e.g. unsaturated lipids), a lipid with a high melting temperature (e.g. saturated lipids) and cholesterol show phase separation into domains, as directly observed by fluorescence microscopy.8 Several studies have considered a phase diagram with lipid mixing fractions and temperature to observe the co-existence of ordered and disordered phases.9,10 The liquid-ordered (Lo) phase is rich in saturated lipids and cholesterol, and the liquid-disordered (Ld) phase is rich in unsaturated lipids, where each phase corresponds to rafts and the surrounding fluid membrane, respectively. When the cholesterol mixing ratio is low, the solid-ordered (So) phase is formed. Thus, a change in membrane lipids and/or the addition of some molecular components alters phase behaviours. The characteristics and stability of domains, such as their size and morphology, have also been examined.11–13 Furthermore, studies have focused on domain dynamics through the application of physical stimuli, such as pressure,14–16 photo-irradiation,17 an electric field,18 and a temperature gradient.19
Recent studies have examined vesicles under shear flow.20 Shear is a typical nonequilibrium stimulus that can be applied to soft-bio matter, and the dynamics of phase-separated membranes under nonequilibrium conditions are now being studied. A better understanding of membrane dynamics under shear is also important for the development of a model of endothelial cells, where shear stress has been reported to be converted into biochemical signalling within plasma membranes.21 Although it has been revealed that membrane fluidity of cell membranes plays an important role in mechanotransduction,22–24 the detailed mechanism remains unclear. Using a model membrane system, some earlier studies reported streamlines in immobilized vesicles under shear flow.25–27 However, few studies have focused on membrane phase behaviour under shear. Honerkamp-Smith et al. used phase-separated domains as a tracer in a flow to measure membrane viscosity.28 Sturzenegger et al. observed the relaxation of phase-separated domains just after the flow was arrested.29 There have been no further systematic studies on the dynamical motion of phase-separated domains on a vesicle surface under shear flow.
In this study, we investigated the dynamical behaviour of lateral domains on phase-separated lipid vesicles under external flow. A microfluidic chamber was used for the immobilization of vesicles and the application of shear stress. Microscopic observation revealed domain dynamics on a vesicle surface; domains tended to be localized at the vortex center as the flow speed increased. We show the dependency of domain behaviours on the flow speed and lipid mixing fraction. The mechanism of these trends is discussed by considering the free energy with respect to phase separation. We performed a numerical simulation based on the Cahn–Hilliard equation with a convection term to reproduce the dynamics of the phase separation under flow on the vesicle surface.
2. Experimental
2.1 Materials
Dioleoyl phosphatidylcholine (DOPC), dipalmitoyl phosphatidylcholine (DPPC), cholesterol (chol), and 1,2-dipalmitoyl-sn-glycero-3-phosphoethanolamine-N-[methoxy(polyethylene glycol)-2000] (PEG-PE) were obtained from Avanti Polar Lipids. The fluorescent phospholipid N-(rhodamine red-X)-1,2-dihexadecanoyl-sn-glycero-3-phosphoethanolamine triethylammonium salt (rho-PE, λex = 560 nm, λem = 580 nm) was obtained from Invitrogen. Deionized water was obtained using a Millipore Milli Q purification system.2.2 Preparation of giant vesicles
Giant vesicles were prepared from a dry lipid film using the natural swelling method: the lipid mixture dissolved in chloroform/methanol along with rho-PE and glucose in a glass test tube were dried under vacuum for >2 h to form thin lipid films.30 Next, the films were hydrated with deionized water at 37–55 °C for several hours. The final concentrations were 0.5 mM lipids (DOPC/DPPC/chol) with 0.5 mol% rho-PE, 2 mol% PEG-PE, and 3 mM glucose. We changed the cholesterol concentration from 10 to 30%; 10% chol (DOPC/DPPC/chol/PEG-PE = 45/43/10/2), 20% chol (DOPC/DPPC/chol/PEG-PE = 40/38/20/2), and 30% chol (DOPC/DPPC/chol/PEG-PE = 35/33/30/2).2.3 Microscopic observation
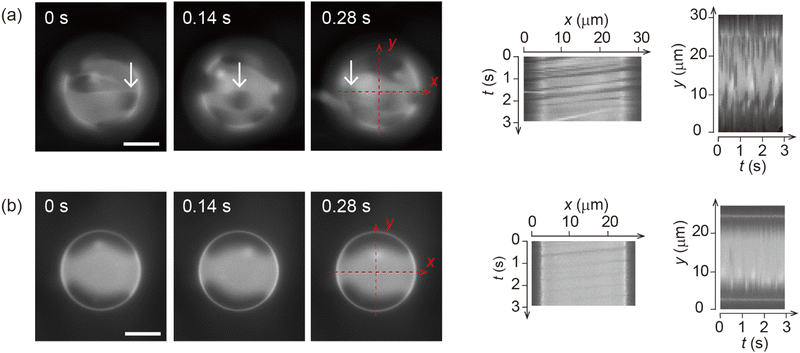
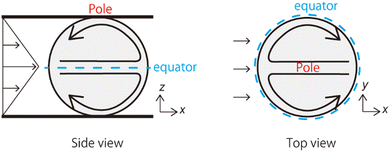
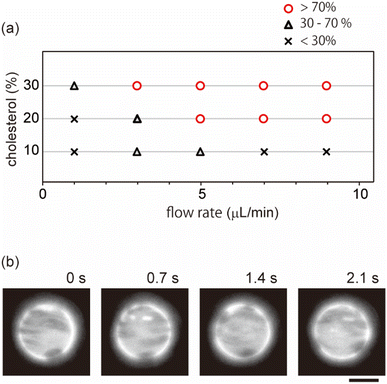
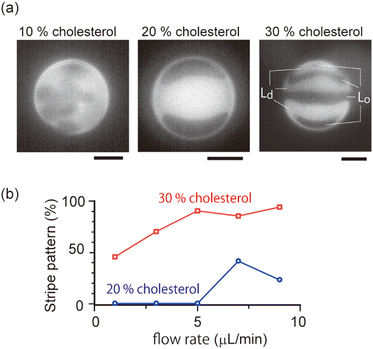
A micro-chamber (Weir-filter chip, microfluidic ChipShop) was used to apply external flow to vesicles (Fig. S1, ESI†). The chamber is designed to immobilize vesicles by gradually decreasing the height to 10 μm (slope angle is 4°). The applied flow rate was controlled using a syringe pump (Legato 100, KD Scientific). The shear stress σ was estimated by σ = 6ηQ/(wd2), where η is the viscosity of the medium (10−3 Pa s), Q is flow rate, w is channel width (7 mm) and d is channel depth (10 μm).29,31 The phase-separated membrane surface was observed by fluorescence microscopy (Ti2, Nikon). A standard filter set (G-2A: ex 510–560 nm, dichroic mirror 575 nm, em 580 nm) was used to monitor the fluorescence of rho-PE, which stains the liquid-disordered (Ld) phase.To make the phase diagram, we counted >15 vesicles under each condition (flow rate and cholesterol contents). We determined the domain localization if the localization was maintained during the observation period of ≥20 s for each liposome. Localization was defined as when domains remained at the vortex center and did not move around on the center line parallel to the flow, i.e., x-line in Fig. 1. In the counting of localization, we determined it by the localization behaviour of larger domains, even if domains that are smaller than localized domains move around on the vesicle surface. In addition, stable stripe pattern of domains is also counted as the localization (Fig. 4a). The temperature of the samples was controlled at 25 °C using a microscope stage (type 10021, Japan Hitec).
To observe domain growth, the temperature was first set at 40 °C, where the membrane becomes homogeneous. Next, we decreased the temperature to 25 °C at a rate of 20 °C min−1 using the microscope stage to induce phase separation.
3. Results and discussion
Fig. 1 shows the shear-induced motion of domains on phase-separated giant vesicles. Within the membrane surface, the liquid-ordered (Lo) phase domains were surrounded by the liquid-disordered (Ld) phase that is stained with the dye. The direction of external flow in the images is from left to right. The application of external flow induces the movement of lipid molecules in the membrane interface, and phase-separated domains change position under the flow. When the flow speed was slow, domains moved on the membrane surface along the streamline (Fig. 1a and Fig. 2). When the speed increased, the motion of domains changed; domains tended to be localized at the vortex center (Fig. 1b). The spatiotemporal diagrams along the x–y axes on the vesicle surface show the difference in domain motion with and without localization (Fig. 1). On the x-line, which is parallel to the flow, the motion of some domains was observed at low speed (Fig. 1a), whereas domains showed little motion at high speed due to localization (Fig. 1b). On the y-line, which is perpendicular to the flow, domains were located randomly at low speed (Fig. 1a), and maintained their locations at high speed (Fig. 1b).It is known that the initial size of domains before the application of flow is determined thermodynamically. When we observed vesicles with small-sized domains, during the localization process, small domains rapidly fused into larger domains. After localization, when the flow speed returned to slow or stopped, the domains were still large. When we observed vesicles with initially large-sized domains, the domains tended to show the localization without fusion. Once shear flow stopped, the localized domains diffused on the vesicle surface as was observed in the case without shear flow. Domain movement on a hemisphere of vesicles is shown in Fig. 1; the other hemisphere showed essentially the same trend of domain motion (see ESI†). This indicates that the vesicles did not tumble in the flow direction. Notably, the vesicles sometimes tumbled in the lateral direction of the flow when the external flow was subtly changed due to the existence of other vesicles in the chamber. The large tumble changed the flow pattern on the vesicle surface, and the domain localization was temporarily disturbed. After stopping the tumbling, the domains again exhibited the localization. In our experiment, we consider that the vesicle shape is somewhat ellipsoidal rather than completely spherical. When the external flow pushes vesicles (the bending modulus is ∼10−19 J)5,8 into the narrow space of the chamber, a membrane region that contacts the chamber tends to become flat and the vesicle is deformed from sphere. The effect of the vesicle deformation might be seen in microscopic images of the domain localization; the localized domain shape was boomerang-like.
Next, we investigated effects of the lipid mixing fraction and flow rate on domain localization. Fig. 3a shows a phase diagram of the localization behaviour of domains. As the flow speed increased, domains on the vesicles with 20% and 30% cholesterol tended to show localization. Next, we used vesicles with 10% cholesterol. Lipid membranes with a low cholesterol ratio are known to produce domains with a solid-ordered (So) phase rather than a liquid-ordered (Lo) phase.9 In contrast to vesicles with 20% and 30% cholesterol, vesicles with 10% cholesterol did not tend to exhibit localization; even when the flow speed became fast, domains moved on the membrane surface along streamline (Fig. 3b). A high flow rate led to the dispersion of domains rather than to localization.
As shown in the phase diagram (Fig. 3a), cholesterol had important effects on the domain localization behaviour. We also found that some localized domains showed a stripe pattern. Fig. 4a shows typical images of the membrane surface with 10%, 20%, and 30% cholesterol under shear flow; 10%, 20% and 30% cholesterol membranes correspond to no localization, spot localization and stripe localization, respectively. When a relatively large-sized domain was localized at the vortex center, the domain separated into several domains as in the stripe form. This trend was observed more often for 30% cholesterol membranes than for 20% cholesterol membranes, and a high flow speed tended to induce this phenomena (Fig. 4b). In addition, the number of stripes formed in the 30% cholesterol membranes tended to be greater than that of the 20% cholesterol membranes. In the stripe pattern, the Lo phase was frequently observed at the vortex center.
The results regarding domain localization suggest that external flow can gather domains distributed on the membrane surface. We then investigated the growth of domains under flow. Fig. 5a shows images of domain growth on the membrane surface without and with flow. First, we set the membrane to be homogeneous above the miscibility transition temperature.9 After the temperature fell below the miscibility transition temperature, many small domains appeared all over the membrane. Without flow (Fig. 5a upper), the generated domains showed Brownian motion and became larger through collision and fusion with each other. After several minutes, the number of domains decreased and the average size of domains increased. In contrast, domain growth under flow is shown in Fig. 5a (bottom). Domains tended to move toward the vortex center, and could become larger sooner than without flow. We did not observe a clear difference in the miscibility temperature without and with flow during heating and cooling the membranes.
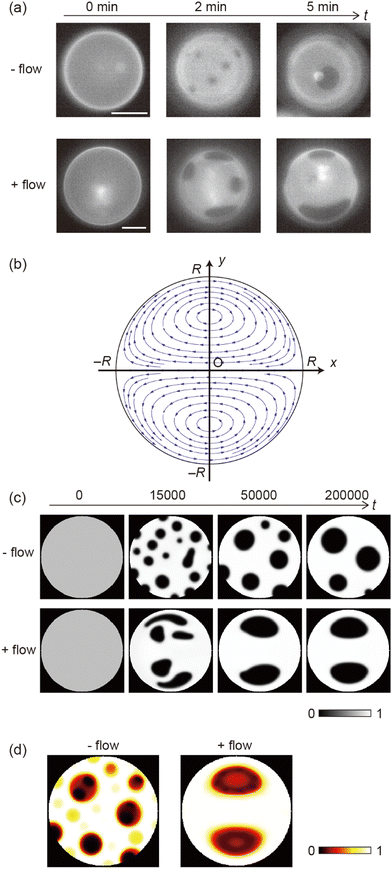 | ||
Fig. 5 (a) Image sequences of domain growth without (upper) and with (bottom) shear flow (8.0 μL min−1). The membrane is 20% chol. The direction of external flow is from left to right. Scale bars are 10 μm. The temperature was controlled to decrease from 40 °C to 25 °C. (b) Flow profile given by eqn (8) or (9). (c) Results of a numerical simulation to reproduce the experimental observation without (upper) and with (bottom) flow. The bar shows the order parameter. (d) Time average of snapshots from t = 0–100![[thin space (1/6-em)]](https://www.rsc.org/images/entities/char_2009.gif) 000 in the numerical simulation shown in (c). 000 in the numerical simulation shown in (c). | ||
To discuss the mechanism of the observed domain dynamics under shear, we consider a simplified two-dimensional model. Actually, in order to quantitatively reproduce the experimental results by numerical simulation, we have to construct a mathematical model including many factors, such as the vesicle deformation, phase separation dynamics on the vesicle, two-dimensional hydrodynamic flow on the vesicle surface, and three-dimensional hydrodynamic flow inside and outside of the vesicle. The quantitative reproduction of the experimental results using the three-dimensional simulation based on such a complex model is beyond the scope of this paper. Instead, we try to extract the essential mechanism on the coupling between the phase separation and shear stress. Therefore, we construct a two-dimensional mathematical model to describe the coupling between the phase separation dynamics and the shear due to the two-dimensional hydrodynamic flow on the vesicle surface in the present study. We performed a numerical simulation based on the Cahn–Hilliard equation with a convection term to reproduce the dynamics of phase separation under shear on the vesicle surface.32–36 Let us consider a two-dimensional circular region Ω with radius R, and order parameter u(r, t), where u = 0 and 1 correspond to the minor and major phases on the surface; i.e., the local free energy can be described as
 | (1) |
 | (2) |
 | (3) |
 | (4) |
 | (5) |
 , and the characteristic width of the interface is proportional to
  . K denotes the speed of the evolution. By the calculation of the functional derivative, the evolution equation can be explicitly given as
 | (6) |
 | (7) |
The flow profile υ(r) is assumed to have symmetric roll structures in a circular region, which are explicitly given as
 | (8) |
 | (9) |
The parameters are set at R = 100, K = 1, f0 = 1, and ε = 1. The flow intensity V0 is varied as a parameter. Due to the conservation of u, we set the initial condition so that u has stochastic values that follow a uniform distribution with an amplitude of 0.005. The mean value of u is set to be u0. Here we set u0 = 0.75. We adopt the Neumann boundary condition, i.e., we consider no diffusive or convective flow across the region boundary. The numerical calculation was performed using the finite volume method for spatial derivative and the explicit method (Euler method) for time evolution with spatial and time steps of Δx = 1 and Δt = 0.005. We checked the convergence of the simulation results by varying spatial and time steps (see Fig. S2 in ESI†). We use the dimensionless values for all the variables and parameters in the numerical simulation.
Fig. 5c shows a reproduction of the experimental results of domain growth without (V0 = 0) and with flow (V0 = 0.1). Without flow, the domains gradually increased in size over time. In contrast, with flow, the domains grew quickly due to localization at the vortex center. This simulation can reproduce the experimentally obtained phenomena as shown in Fig. 5a. Fig. 5d shows the average of the time-dependent domain pattern in the numerical simulation from t = 0 to 100![[thin space (1/6-em)]](https://www.rsc.org/images/entities/char_2009.gif) 000. Although domains were randomly distributed without flow, the position of domains was localized around the vortex center with flow. Localization is mainly due to the energy cost of interfacial tension. When the flow induces the deformation of domains, interfacial energy increases. The stable state should correspond to the localization of a domain at the vortex center, where the deformation of domains is small and the interface does not move.
000. Although domains were randomly distributed without flow, the position of domains was localized around the vortex center with flow. Localization is mainly due to the energy cost of interfacial tension. When the flow induces the deformation of domains, interfacial energy increases. The stable state should correspond to the localization of a domain at the vortex center, where the deformation of domains is small and the interface does not move.
The present results revealed that external flow induces dynamical pattern of phase-separated domains within a bilayer vesicle, such as localization at the vortex center. The localization trends depended on the cholesterol content of the membrane. Moreover, the numerical simulation can reproduce the experimental results of the localization behavior during the growth of domains. Studies on flow dynamics of vesicles have been performed using two types of vesicles: free-standing ones and immobilized ones, which are a model of red blood cells and endothelial cells, respectively. Free-standing vesicles in flow show deformations, tank-treading and tumbling motions, and the dynamics was well studied experimentally, numerically and theoretically.20 Using immobilized vesicles, most experimental and theoretical studies focused on streamlines around vesicles and on the membrane.25–28 Few reports monitored phase-separated domains within immobilized vesicles under shear. Honerkamp-Smith et al. observed flowing domains under a flow and traced them to measure membrane viscosity.28 Sturzenegger et al. observed a change of domain shape from circular to non-deterministic shapes by the application of shear, and studied time-dependent changes in domains just after the flow was stopped.29 The shear stress in their experiments was estimated to be ∼80 dyn cm−2, which is greater than that in our experiments as discussed below. Our study is the first report on the nonequilibrium dynamical pattern of phase-separated domains within immobilized vesicles under a shear flow.
The localization behavior of membrane domains largely depended on the cholesterol contents of the membrane (Fig. 3a). Although domains with above 20% cholesterol showed localization as shear flow increased, domains with 10% cholesterol did not exhibit this trend. This may be attributed to the phase property of the membrane. The membrane shows liquid–liquid phase separation at above 20% cholesterol, and solid–liquid separation at 10% cholesterol.9 The interfacial tension between liquid–liquid phase separation is important to induce the localization of domains at the vortex center, as discussed above. Therefore, this mechanism cannot be applied to solid domains with 10% cholesterol.
The stripe pattern of domains was observed more at 30% cholesterol than at 20% cholesterol (Fig. 4). This may be attributed to the large area fraction of ordered domains. The domain surface area of 30% chol is larger than that of 20% chol.9 It has been reported that a large liquid droplet, such as emulsions, becomes unstable to be dispersed into small droplets under shear flow because of the competition between shear stress and interfacial tension.37 Along these lines, the size of stable domains R is estimated to be 1–3 μm for a flow rate of 1–10 μL min−1 using R ∼ (γ/σ)1/2, where γ is the line tension of domains (10−12 N). The estimated stable domain size is on the same order as our microscopic observation. However, the present numerical simulation cannot reproduce the stripe localization. The two phases are equivalent as far as Cahn–Hilliard equation is considered. We cannot include any asymmetry between the two phases; such as the effect of the compositions. The asymmetric nature may be of importance to reproduce the stripe localization.
In our experiments, the shear stress is estimated to be 1–10 dyn cm−2, which is comparable to that felt by endothelial cells under physiological conditions. The shear stress is several dyn cm−2 in a vein and 10–20 dyn cm−2 in an artery.38 These stresses have been reported to induce signal transductions within plasma membranes.21 Since membrane domains are expected to promote the association of signaling molecules in a living cell,2 our results imply that shear stress may change the position of domains and/or the domain size to regulate signaling reactions. It has been reported that some physicochemical factors, such as line tension39 and bilayer curvature,12 affect the size of growing domains, and shear stress is also a possible stimulus that can control lateral domains. The present results also indicated that the cholesterol ratio in the membrane affected these domain behaviors (Fig. 3 and 4). In a cell experiment, it was reported that shear induces a change in the lipid order in a plasma membrane and the content of membrane cholesterol is related to the cellular response to shear stress.40 Further studies on domain dynamics within a cellular membrane surface under shear are awaited.
Although we reproduced the experimental results regarding localization under shear, the results of the numerical simulation did not perfectly correspond to the experimental results. Several additional factors may be included to improve our simulation and enable us to perform a quantitative comparison. First, the difference in viscosity between two phases (10−6–10−8 Pa s m depending on the lipid composition) was not adopted in the present simulation,41,42 which may change the dynamics of the phase separation, especially the deformation of the domain. Second, the present numerical simulation considered a two-dimensional system, but a three-dimensional numerical simulation is necessary for a quantitative comparison with the experimental results. A three-dimensional simulation may directly include the shear between the vesicle surface and neighboring fluid.
4. Conclusions
We studied the effect of external flow on phase-separated lipid membranes. Our findings can be summarized as follows: (i) as the applied flow rate increased, membrane domains tended to be localized at the vortex center, and (ii) the localized domains showed a stripe pattern. (iii) These trends depended on the cholesterol content of the membrane. (iv) The domains grow more rapidly under shear than by simple diffusion. (v) We discuss the mechanism of domain dynamics by considering the free energy of membrane phase separation. The experimental results of the localization trend were reproduced by a numerical simulation. The interfacial tension of liquid domains could be a driving force of this localization. Thus, the solid domains in the membrane with a low mixing ratio of cholesterol do not show localization behavior. To the best of our knowledge, this is the first report of a systematic investigation of the dynamical state of phase-separated bilayer membranes under shear. As the next research target, it may be of value to detect a shift of phase boundary and tie lines in membrane phase diagram under a shear. Our findings may provide insight into membrane nonequilibrium dynamics under external stress and also membrane mechanics regarding the cellular mechanotransduction of shear stress.Author contributions
T. H. designed the study. T. H. and S. M. performed the experiments. T. H., S. M. and H. K. analysed the data. H. K. performed the simulation. T. H. and H. K. wrote the paper. All authors approved the final version of the manuscript.Conflicts of interest
There are no conflicts to declare.Acknowledgements
This work was supported in part by the Japan Society for the Promotion of Science (JSPS), KAKENHI Grants [20K05447 (T. H.), 21H01891 (T. H.) and 21H01004 (H. K.)], the Japan Agency for Medical Research and Development (AMED) under Grant No. JP20gm0810006 (T. H.), and the Iketani Science and Technology Foundation (T. H.). We thank Prof. K. Yamamoto for valuable discussions.References
- K. Simons and E. Ikonen, Nature, 1997, 387, 569 CrossRef CAS PubMed.
- D. Lingwood and K. Simons, Science, 2010, 327, 46 CrossRef CAS PubMed.
- D. A. Brown and E. London, J. Biol. Chem., 2000, 275, 17221 CrossRef CAS PubMed.
- J. F. Hancock, Nat. Rev. Mol. Cell Biol., 2006, 7, 456 CrossRef CAS PubMed.
- R. Dimova, Annu. Rev. Biophys., 2019, 48, 93 CrossRef CAS PubMed.
- T. Hamada and K. Yoshikawa, Materials, 2012, 5, 2292 CrossRef CAS.
- X. Wang, H. Du, Z. Wang, W. Mu and X. Han, Adv. Mater., 2021, 33, 2002635 CrossRef CAS PubMed.
- T. Baumgart, S. T. Hess and W. W. Webb, Nature, 2003, 425, 821 CrossRef CAS PubMed.
- S. L. Veatch and S. L. Keller, Biophys. J., 2003, 85, 3074 CrossRef CAS PubMed.
- H. Himeno, N. Shimokawa, S. Komura, D. Andelman, T. Hamada and M. Takagi, Soft Matter, 2014, 10, 7959 RSC.
- S. Rozovsky, Y. Kaizuka and J. T. Groves, J. Am. Chem. Soc., 2005, 127, 36 CrossRef CAS PubMed.
- S. F. Shimobayashi, M. Ichikawa and T. Taniguchi, EPL, 2016, 113, 56005 CrossRef.
- C. S. Scheve, P. A. Gonzales, N. Momin and J. C. Stachowiak, J. Am. Chem. Soc., 2013, 135, 1185 CrossRef CAS PubMed.
- N. Wongsirojkul, N. Shimokawa, P. Opaprakasit, M. Takagi and T. Hamada, Langmuir, 2020, 36, 2937 CrossRef CAS PubMed.
- T. Hamada, Y. Kishimoto, T. Nagasaki and M. Takagi, Soft Matter, 2011, 7, 9061 RSC.
- N. L. McCarthy, O. Ces, R. V. Law, J. M. Seddon and N. J. Brooks, Chem. Commun., 2015, 51, 8675 RSC.
- T. Hamada, R. Sugimoto, T. Nagasaki and M. Takagi, Soft Matter, 2011, 7, 220 RSC.
- R. Dimova, K. A. Riske, S. Aranda, N. Bezlyepkina, R. L. Knorr and R. Lipowsky, Soft Matter, 2007, 3, 817 RSC.
- E. L. Talbot, L. Parolini, J. Kotar, L. Di Michele and P. Cicuta, Proc. Natl. Acad. Sci. U. S. A., 2017, 114, 846 CrossRef CAS PubMed.
- D. Abreu, M. Levant, V. Steinberg and U. Seifert, Adv. Coll. Interf. Sci., 2014, 208, 129 CrossRef CAS PubMed.
- P. F. Davies, Physiol. Rev., 1995, 75, 519 CrossRef CAS PubMed.
- K. Yamamoto and J. Ando, J. Cell Sci., 2013, 126, 1227 CrossRef CAS PubMed.
- T. Tabouillot, H. S. Muddana and P. J. Butler, Cell. Mol. Bioeng., 2011, 4, 169 CrossRef CAS PubMed.
- M. A. Haidekker, N. L'Heureux and J. A. Frangos, Am. J. Phys., 2000, 278, H1401 CAS.
- B. Sebastian, T. Favero and P. S. Dittrich, J. Phys. Chem. Lett., 2017, 8, 6128 CrossRef CAS PubMed.
- F. G. Woodhouse and R. E. Goldstein, J. Fluid Mech., 2012, 705, 165 CrossRef.
- C. Vézy, G. Massiera and A. Viallat, Soft Matter, 2007, 3, 844 RSC.
- A. R. Honerkamp-Smith, F. G. Woodhouse, V. Kantsler and R. E. Goldstein, Phys. Rev. Lett., 2013, 111, 038103 CrossRef PubMed.
- F. Sturzenegger, T. Robinson, D. Hessa and P. S. Dittrich, Soft Matter, 2016, 12, 5072 RSC.
- K. Tsumoto, H. Matsuo, M. Tomita and T. Yoshimura, Colloids Surf., B, 2009, 68, 98 CrossRef CAS PubMed.
- M. J. Levesque and R. M. Nerem, J. Biomech. Eng., 1985, 107, 341 CrossRef CAS PubMed.
- A. J. Bray, Adv. Phys., 2002, 51, 481 CrossRef.
- A. Novick-Cohena and L. A. Segel, Physica D, 1984, 10, 277 CrossRef.
- J. W. Cahn and J. E. Hilliard, J. Chem. Phys., 1958, 28, 258 CrossRef CAS.
- T. Witkowski, R. Backofen and A. Voigt, Phys. Chem. Chem. Phys., 2012, 14, 14509 RSC.
- A. Zhiliakov, Y. Wang, A. Quaini, M. Olshanskii and S. Majd, Biochim. Biophys. Acta, Biomembr., 2021, 1863, 183446 CrossRef CAS PubMed.
- G. I. Taylor, Proc. R. Soc. A, 1934, 146, 501 CAS.
- A. Kamiya, R. Bukhari and T. Togawa, Bull. Math. Biol., 1984, 46, 127 CrossRef CAS PubMed.
- R. Brewster, P. A. Pincus and S. A. Safran, Biophys. J., 2009, 97, 1087 CrossRef CAS PubMed.
- K. Yamamoto and J. Ando, Am. J. Physiol. Heart Circ. Physiol., 2015, 309, H1178 CrossRef CAS PubMed.
- Y. Sakuma, T. Kawakatsu, T. Taniguchi and M. Imai, Biophys. J., 2020, 118, 1567 CrossRef PubMed.
- P. Cicuta, S. L. Keller and S. L. Veatch, J. Phys. Chem. B, 2007, 111, 3328 CrossRef CAS PubMed.
Footnote |
| † Electronic supplementary information (ESI) available: Movies of domain dynamics under shear, schematics of micro-chamber and numerical methods. See DOI: https://doi.org/10.1039/d2sm00825d |
| This journal is © The Royal Society of Chemistry 2022 |

